Ethereum Game Plan - TDLRKZ MODELEthereum Game Plan - TDLRKZ MODEL
📊 Market Sentiment
On 29/10, the FED lowered rates by 25BPS, as expected. However, Powell’s comments introduced uncertainty regarding another cut in December, stating that further policy moves depend on incoming data.
Interestingly, one FED member dissented, preferring no cut this cycle — a shift from September when all members supported easing.
Following the statement, rate-cut expectations dropped from 95% to 68%, prompting traders to take profits and hedge, creating a short-term bearish sentiment across markets.
Despite this, the mid-to-long term outlook remains bullish, given the broader liquidity cycle and easing policy bias.
📈 Technical Analysis
Ethereum is currently accumulating inside a well-defined range.
Price failed to sustain above the $4950 range high and has started retracing toward the HTF bullish trendline, a potential reaction zone aligning with prior liquidity pools and confluences.
If price holds around this zone, ETH could seek the range high again once momentum returns.
📘 Model in Use – Trendline Deviation with HTF LR into Key Zone (TDLRKZ Model)
This model identifies setups where price deviates from HTF trendlines while interacting with liquidity zones and key structural levels.
The goal is to align HTF context with LTF confirmation for high-probability trend continuation setups.
Model Steps:
1️⃣ Identify the HTF trend direction and only trade in that direction.
2️⃣ Mark the HTF bullish trendline supporting price.
3️⃣ Spot HTF Key Zones likely to act as reaction areas.
4️⃣ Locate nearby liquidity pools or order concentrations.
5️⃣ Wait for confluence: when all align, confirm with a 4H market structure break for entry.
📌 Game Plan
Looking for ETH to retrace into $3350 and reject from that level.
If a 4H break of structure occurs and daily candle closes above $3350, this will trigger a long-biased setup.
🎯 Setup Trigger
→ 4H structure break after tagging $3350
→ Daily close above $3350
📋 Trade Management
→ Entry: After confirmation above $3350
→ Stop Loss: Below swing low that caused 4H break of structure
→ Targets:
TP1: $4150 (EQ)
TP2: $4550
TP3: $4950 (Range high)
→ Move SL to breakeven after TP1 is reached.
💬 Check my Substack for deeper macro and sentimental breakdowns — free subscriptions are open.
⚠️ Disclaimer: This content is for educational purposes only and does not constitute financial advice. Always DYOR before trading.
Altmarket

SUI Long Opportunity – DTB ModelSUI Long Opportunity – DTB Model
📊 Market Sentiment
FED has resumed its rate-cutting cycle with a 0.25% cut in September and two more expected. Institutional liquidity inflows are accelerating as the U.S. officially adopts crypto as part of its reserves. Despite persistent inflation, a weakening labor market is forcing the FED to ease, driving capital into risk-on assets like crypto.
📈 Technical Analysis
Price remains in a strong HTF bullish trend, so I’ll only be looking for long setups.
After running HTF swing liquidity, price broke structure and created a daily demand zone. The first tap to this zone generated a solid rejection, confirming its validity.
Recently, price closed above the LTF bearish trendline — signaling potential continuation for the next bullish leg.
📘 Model to be used – Demand Bounce to Trendline Break (DTB Model)
1-Identify the HTF trend and trade only in that direction.
2-Wait for a strong bounce from a confirmed demand zone.
3-Look for a break of the lower time frame bearish trendline.
4-Enter on breakout confirmation after two consecutive body closes.
📌 Game Plan
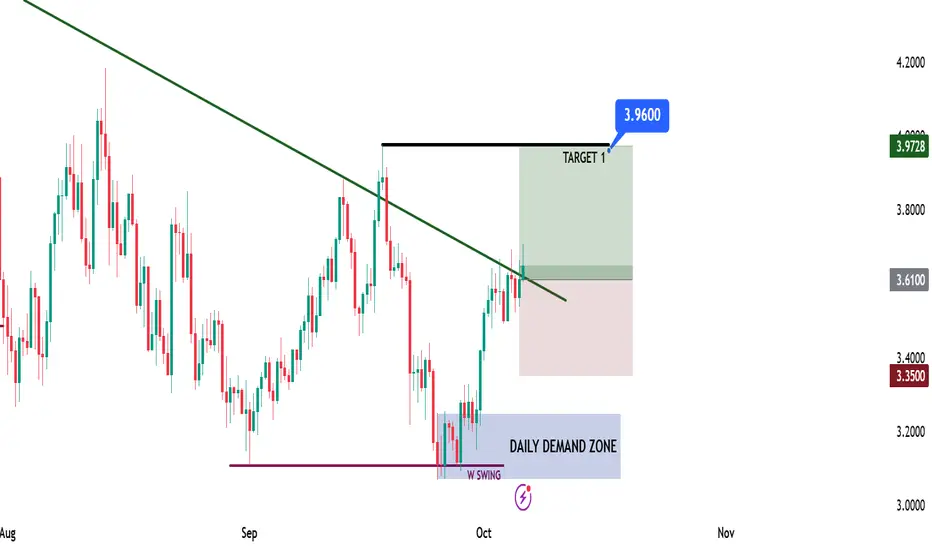
Position entered after 4H trendline break confirmation (two body closes above). Entry taken around $3.61, aligning with HTF bullish bias and demand confluence.
🎯 Setup Trigger
4H body close confirmation above bearish trendline.
📋 Trade Management
Entry: $3.61
Stoploss: $3.35
Target: $3.96
💬 Like, follow, and comment if this breakdown supports your trading! More setups and insights coming soon — stay connected!
⚠️ Disclaimer: This content is for informational and educational purposes only and does not constitute financial, investment, or trading advice. Always DYOR before making any financial decisions.
AVAX Swing Long Idea – TTKZD ModelAVAX Swing Long Idea – TTKZD Model
📊 Market Sentiment
FED has resumed its rate-cutting cycle, starting with a 0.25% cut in September, with two more expected. Institutional liquidity inflows have accelerated as the U.S. officially adopts crypto as part of its reserves. Despite elevated inflation, a weakening labor market is forcing the FED to ease, pushing more capital into risk-on assets.
📈 Technical Analysis
Price remains in a HTF bullish trend, signaling continuation potential.
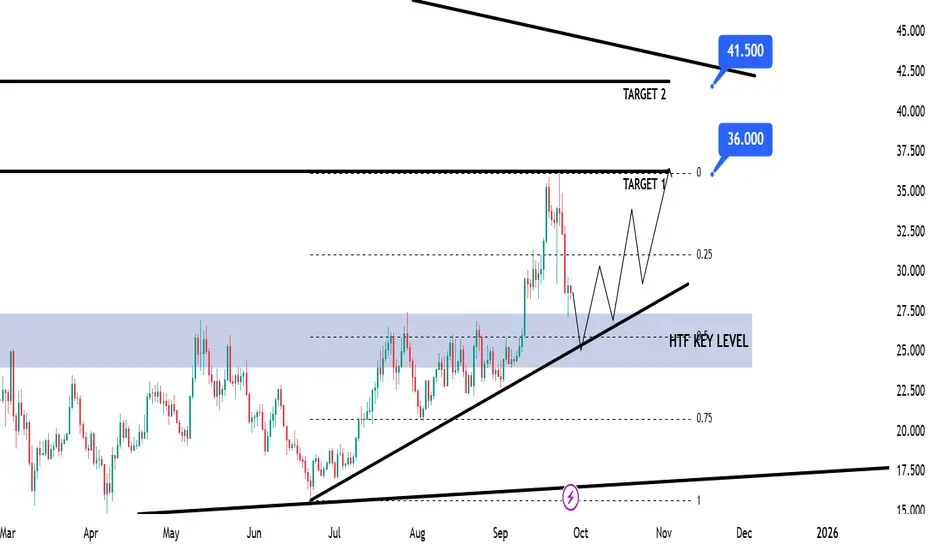
Price broke the HTF Key Zone and closed aggressively above → strong buyer defense.
Supported by the HTF Bullish Trendline → potential retest & rejection.
Approaching the Fibonacci 0.5 equilibrium (discount) → ideal for long positioning.
📘 Model to be used – TTKZD (Trendline + Key Zone + Discount)
In this model, we look for 3 confluences:
1-Clear HTF bullish trendline supporting structure
2-HTF Key Zone defense after aggressive break
3-Fibonacci 0.5 discount zone as entry alignment
📌 Game Plan
Price to test bullish trendline
Retest of HTF Key Zone
Confluence at 0.5 discount → long entry
🎯 Setup Trigger
12H Break of Structure → confirmation for entry.
📋 Trade Management
Stoploss: Below 12H swing low that creates BOS
Targets:
TP1 → $36
TP2 → $41.5
Move stop to breakeven after TP1.
💬 Like, follow, and comment if this breakdown supports your trading! More setups and insights coming soon — stay connected!
⚠️ Disclaimer: This content is for educational purposes only and does not constitute financial advice. Always DYOR before trading.
XRP Game PlanXRP Game Plan
📊 Market Sentiment
Overall sentiment remains bullish, supported by expectations of a 0.25% rate cut in the upcoming FOMC meeting. A weakening USD and increasing global risk appetite are creating favorable conditions for further upside in crypto assets.
📈 Technical Analysis
Price rejected the bearish trendline and started moving lower.
This indicates to me that price wants to grab more liquidity before expanding higher.
However, the HTF order flow remains strongly bullish, so I will only be looking for long setups here.
📌 Game Plan
I will be targeting the $2.72 liquidity zone, which holds significant liquidity.
Additionally, I will watch for price to test the HTF key level and look for rejection from that area.
🎯 Setup Trigger
I will look for a 6H–4H break of structure before entering a trade (with LTF confirmation).
📋 Trade Management
Stoploss: 6H–4H swing low confirming the BOS
Targets:
• TP1: $3.14
• TP2: $3.38
• TP3: $3.67 (All-Time Highs)
💬 Like, follow, and comment if you find this setup valuable!
⚠️ Disclaimer: This content is for informational and educational purposes only and does not constitute financial, investment, or trading advice. Always do your own research before making any financial decisions.

ADA – Cardano Swing Long IdeaADA – Cardano Swing Long Idea
📊 Market Sentiment
Market sentiment remains strongly bullish as the FED is expected to deliver a 0.25% rate cut, with speculation building for a possible 0.5% cut in September. Monetary policy shifts are being driven by both inflation trends and weakening labor market data. The latest August and September job reports were soft, signaling that the economy is cooling rapidly. This environment continues to fuel expectations for a major bullish run in the weeks ahead.
📈 Technical Analysis
Price found support on September 1st at the bullish HTF trendline and has been moving upward since.
Price is currently at the HTF Key Resistance level, showing accumulation rather than sharp rejection, with deviations pushing upward. This indicates strength and a bias toward higher prices.
📌 Game Plan
1)Watch for a daily close above the bearish trendline.
2)Look for the HTF Key Resistance to be broken and confirmed with a daily close above.
🎯 Setup Trigger
Entry after the retest of the HTF Key Resistance level ($0.885).
📋 Trade Management
Stoploss: Daily close below HTF Key Level ($0.85 area)
Targets:
TP1: $0.96
TP2: $1.02
💬 Like, follow, and comment if you find this setup valuable!
⚠️ Disclaimer: This content is for informational and educational purposes only and does not constitute financial, investment, or trading advice. Always do your own research before making any financial decisions.

HYPE | Looking for All-Time HighsHYPE | Looking for All-Time Highs
📊 Market Sentiment
Market sentiment remains strongly bullish as the FED is set for a 0.25% rate cut, with the possibility of a 0.5% cut in September. Monetary policy is being adjusted not only in response to inflation but also weak labor market data. Recent August and September job numbers came in soft, signaling that the economy is cooling rapidly. This shift is fueling expectations for one of the strongest bullish runs in the coming weeks.
📈 Technical Analysis
HYPE continues to show a strong HTF bullish trend — one of the most bullish structures currently in crypto. Price retraced into the 0.75 HTF discounted range and reacted strongly from there. This level also aligned with the HTF bullish trendline, creating a clean confluence. Following the bounce, price established a fresh 4H demand zone, adding further validation to the bullish outlook.
📌 Game Plan
I will be watching for price to revisit the 4H demand zone, which also overlaps with the HTF bullish trendline. This zone aligns with the 0.5 Fibonacci equilibrium level, making it a key area of interest for continuation to the upside.
🎯 Setup Trigger
I will look for a confirmed 1H break of structure before entering long.
📋 Trade Management
Stoploss: Below the 1H swing low responsible for the BOS
Targets:
• TP1: $47.78
• TP2: $51.20 (ATH)
💬 Like, follow, and comment if you find this setup valuable!
⚠️ Disclaimer: This content is for informational and educational purposes only and does not constitute financial, investment, or trading advice. Always do your own research before making any financial decisions.

BNB Targeting All-Time Highs BNB Targeting All-Time Highs
📊 Market Sentiment
Sentiment remains constructive, supported by the prospect of a 0.25% rate cut in the upcoming FOMC meeting. With the USD losing strength and global risk appetite improving, conditions continue to favor upside momentum in crypto markets.
📈 Technical Analysis
BNB shows strong bullish momentum, so I’m only focused on long setups.
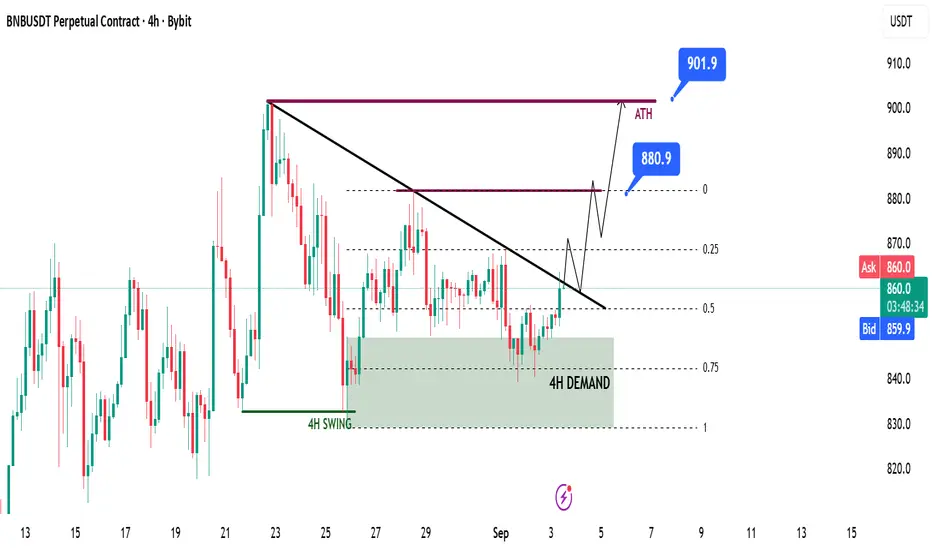
Price swept 4H swing liquidity and closed strongly above, signaling a deviation of the liquidity pool and intent to push higher.
A 4H demand zone was created after the liquidity raid, and price has already retested it while aligning with the 0.75 max discount zone both giving a strong bounce.
Currently, price is moving towards the LTF bearish trendline.
📌 Game Plan
I want to see a clean breakout above the bearish trendline. At least two consecutive 4H candle closes above the trendline will confirm the breakout for me.
🎯 Setup Trigger
I will enter after a confirmed retest of the broken trendline.
📋 Trade Management
Stoploss: Two consecutive 4H closes below the broken trendline
Targets:
• TP1: $880
• TP2: $901 (All-Time Highs)
💬 Like, follow, and comment if you find this setup valuable!
⚠️ Disclaimer: This content is for informational and educational purposes only and does not constitute financial, investment, or trading advice. Always do your own research before making any financial decisions.
XRP | Looking for All-Time HighsXRP | Looking for All-Time Highs
📊 Market Sentiment
Overall sentiment remains bullish, supported by expectations of a 0.25% rate cut in the upcoming FOMC meeting. A weakening USD and increasing global risk appetite are creating favorable conditions for further upside in crypto assets.
📈 Technical Analysis
Price ran liquidity at $2.81 and closed above with a strong reaction.
A 4H demand zone formed after the break of structure, and price found support there.
Currently, price is moving towards the bearish trendline.
If price breaks and closes above this bearish trendline, I will be looking for long entries targeting new highs.
📌 Game Plan
I will wait for price to break and close above the bearish trendline.
Then, I will look for a retest and bounce slightly below or at the trendline before entering.
🎯 Setup Trigger
A 1H market structure shift will be my confirmation for entry.
📋 Trade Management
Stoploss: 1H swing low confirming the BOS
Targets: TP1: $3.14 | TP2: $3.38
💬 Like, follow, and comment if you find this setup valuable!
⚠️ Disclaimer: This content is for informational and educational purposes only and does not constitute financial, investment, or trading advice. Always do your own research before making any financial decisions.

Others: Now or Never- As always, the chart tells the full story (Trend, Fibonnacci and Elliot Waves).
Historically, OTHERS.D (altcoin dominance) has had big swings depending on market cycles:
- During altcoin seasons (e.g. 2017, 2021), it has surged strongly as capital rotated from BTC and ETH into mid-cap and small-cap coins.
- Macro Cycle : if Bitcoin finishes its post-halving run (2025–2026), then money often rotates into altcoins, pushing OTHERS.D higher.
- Historical levels: OTHERS.D peaked near 20% in 2021. So 27% is ambitious but not impossible if altcoin adoption accelerates.
Remember, I only provide technical analysis and assumptions, fundamentals can shift everything at any moment, whether through governments, wars, unforeseen events, or even something as wild as an asteroid or alien invasion.
Happy Tr4Ding !

XRP Game PlanXRP Game Plan
📊 Market Sentiment
Market sentiment has slightly shifted as expectations for a 0.25 bps cut in September are no longer strongly priced in. Current probabilities still show around a 60% chance of easing, but overall, the market remains uncertain. This uncertainty has led to risk-off moves and sell-offs across multiple assets, starting with NQ and extending into crypto.
📈 Technical Analysis
Price is retracing towards a higher timeframe (HTF) key support level.
The main liquidity zone sits around $2.73, where I would expect a significant bounce.
📌 Game Plan
I expect price to run into the $2.73 liquidity zone and close back above it. From there, I will look for price to reclaim the HTF key level as confirmation of bullish continuation.
🎯 Setup Trigger
I will monitor the 4H market structure for confirmation before initiating a position.
📋 Trade Management
Stoploss: 4H swing low confirming the BOS
Targets:
TP1: $3.14
TP2: $3.38
💬 Like, follow, and comment if you find this setup valuable!
⚠️ Disclaimer: This content is for informational and educational purposes only and does not constitute financial, investment, or trading advice. Always do your own research before making any financial decisions.

ETH Daily Recap & Game Plan – 15.08.2025ETH Daily Recap & Game Plan – 15.08.2025
📊 Market Sentiment
Overall sentiment remains bullish, supported by expectations of a 0.25% rate cut in the upcoming FOMC meeting. A weakening USD and increasing global risk appetite are creating favorable conditions for further upside in crypto assets.
Ethereum is approaching all-time highs, fueled by a $1B single-day ETF inflow. Additionally, rumors of potential SEC approval for Ethereum staking policy could directly boost ETH’s utility — strengthening the long bias.
📈 Technical Analysis
Price has started a retracement move after Bitcoin reached new all-time highs.
Currently, ETH is testing the daily demand zone (blue box) — a level where we may see a reaction. For confirmation, I want to see a 4H break of structure before initiating any trades.
Since it’s the weekend, I expect some choppy price action and possibly a deeper retracement. I’m watching two potential scenarios (Blue vs. Red).
📌 Game Plan
Scenario 1 (Blue)
→ Price sweeps 4H swing liquidity at 4255$, then rejects.
Scenario 2 (Red)
→ Price dips deeper, tapping the untested swing high at 4112$ and possibly into the equilibrium discount zone (0.5 Fibonacci), before rejecting.
🎯 Setup Trigger
Waiting for a 4H break of structure before entering any position.
📋 Trade Management
Stoploss: 4H swing low confirming the BOS
Target: Run directly toward all-time highs at 4867$
💬 Like, follow, and comment if you find this setup valuable!
Disclaimer: This content is for informational and educational purposes only and does not constitute financial, investment, or trading advice. Always do your own research before making any financial decisions.

Ethereum Mid Week Update - Swing Long Idea📈 Market Context:
ETH remains in a healthy bullish structure. Despite the recent retracement, price action is still supported by strong demand zones on higher timeframes. No change in the overall sentiment from earlier this week.
🧾 Weekly Recap:
• Price rejected from the Fibonacci 0.5 EQ level — a discounted zone in my model.
• While doing so, it also ran 4H swing liquidity.
• After taking liquidity, ETH formed a 1H demand zone — a sign to look for lower timeframe confirmations for long setups.
📌 Technical Outlook:
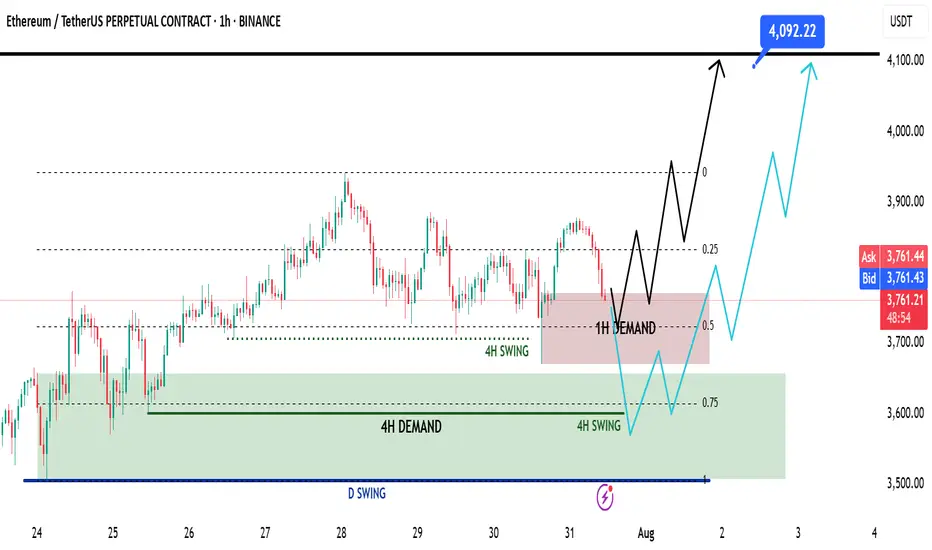
→ Price has already tapped into the 1H demand zone.
→ From here, we have two possible scenarios:
Black scenario (ideal):
• Wait for 15M bullish break of structure (BOS).
• Enter after confirmation for long setups from 1H demand.
Blue scenario (deeper retrace):
• If no bounce from 1H demand, expect price to dip toward 0.75 Fib level (max discount).
• Watch for another liquidity run & 1H–4H demand formation.
🎯 Setup Trigger:
✅ 15M bullish BOS inside 1H or 4H demand zones
→ This would be the entry confirmation trigger for longs.
📋 Trade Management:
• Stoploss: Below the swing low of the 15M BOS
• Target: 4090$
💬 Like, follow, and drop a comment if this outlook helped — and stay tuned for more setups each week!
Total2 wants to inv h&s its way into completing its cup’s handleShould break above the neckline of this lemon lime colored inverse head and shoulder pattern in the upcoming 1-3 weekly candles here, and we are likely less than a week a way from the daily chart golden cross (not shown here). The breakout target from this inverse head and shoulder pattern will take price above the rimline of the larger cup and handle pattern and upon triggering the breakout from that we head to the light blue erasure move target which fro where price action currently is is about a 100% gain for the alt racket which should confirm alt season. *not financial advice*

Wyckoff Pattern- To understand trading at its core, you need to understand the Wyckoff Theory.
- Everything you need is in the chart and yes, it's simple and might look like copy-paste, but it's pure Wyckoff.
- Remember this post i made in 2021 ? check it again :
Remember, trading is like a washing machine, it shakes you up, spins you around, and pressures you to sell when you should be buying or Holding.
Not a price prediction, just a smarter way to level up your strategy.
Happy Tr4Ding !

Market3I haven’t been posting much lately simply because there’s nothing particularly interesting to say, the market has been a bit dull.
2025 should be a strong year for altcoins, as they’ve been consistently suppressed. With BTC dominance reaching 64%, which is quite significant, all attention remains on Bitcoin.
On this chart, you can see that $1.17 trillion acted as a rejection level for the crypto market (excluding BTC and ETH). Time will tell, but I anticipate a $4 trillion altcoin bull market before the end of 2025.
Remember, Fibonacci plays a crucial role in long-term market predictions.
Invest wisely and at the right time.
Happy Tr4Ding !

ALTSEASON Party like 2021 is about to start.This is the unique ratio of the crypto total market cap excluding the top 10 against Bitcoin.
The market is consolidating for 7 straight weeks after rebounding on the top of the former Triangle of the previous Cycle.
Basically it this bearish leg is almost identical to October-December 2020. This kickstarted the Altseason of 2021.
We expect a similar altcoin rally to start as in 2021.
Follow us, like the idea and leave a comment below!!

TonCoin- Eliminate the useless, keep the essential.
- imo Toncoin looks bottomed, but remember, crypto moves fast, if BTC dips, altcoins usually follow harder.
- That said, for now, I don’t see altcoins dropping further; they sound to be not far from a rock bottom.
------------------------------------------------------------------
Simple Trade Strategy :
------------------------------------------------------------------
- Buy now around 3$
- Keep some juice to DCA more around 2.30$
------------------------------------------------------------------
TP : 5.50$
SL : 1.95$
------------------------------------------------------------------
Play Wisely !
Happy Tr4Ding !

The Others UpdateThe market is testing your patience, trying to shake you out so they can buy back at a lower price. Stay strong and hold your ground.
Observe the chart carefully, a perfect double bottom was formed earlier, while now the RSI remains elevated, signaling potential strength in Altcoins.
As always, the crypto market will move faster than you can react.
Happy Tr4Ding !

$XRP sellers missing gains. Don’t fall for the “sold my XRP I’m done” posts..
Look at the RSI we’re in an over sold area heading up into the over brought area.
So really you buy the over sold and sell the over brought areas aka sell high RSI buy lower RSI.
That’s just one way to note potential entry or exit points.
CRYPTOCAP:XRP isn’t done why? CRYPTOCAP:ETH and CRYPTOCAP:BTC aren’t done.

SUI UPDATE - 12.01.2025 / Local long setup1d: sensible flow of orders to Long, looks beautiful
1h: there is synchronization with senior tf, also good!
Not a bad chart for futures
Observe the risks and think with your head!

CAKE SWING LONG IDEAI know everyone is fearful in the crypto market right now.
People are scared to buy at these lows because they believe Bitcoin will likely continue to decline. And yes, that could happen. But guess what?
BTC is sitting on daily support.
BTC dominance hit 60% and is possibly forming lower highs (check my BTC DOM analysis).
The Fear Index is at 54—people are scared.
Funding rates are extremely negative.
Most assets' RSI levels are oversold (in a bull market!).
All these factors tell me it’s the perfect time to open swing long positions while everyone else is panicking and selling their coins at the lows.
All these factors tell me it’s the perfect time to open swing long positions while everyone else is panicking and selling their coins at the lows.
Let’s look CAKE as an example:
Cake has currently hit the monthly and weekly demand zones. It has rejected the weekly demand and broken the 4H structure.
We’ve seen strong upside movement following this, confirming the second leg of the higher high formation on the 4H timeframe.
TARGETS:
TP1: $3.41
TP2: $4.02
TP3: $4.50
SL: Below $2.05 (daily close)

TAO SWING LONG IDEA I know everyone is fearful in the crypto market right now.
People are scared to buy at these lows because they believe Bitcoin will likely continue to decline. And yes, that could happen. But guess what?
BTC is sitting on daily support.
BTC dominance hit 60% and is possibly forming lower highs (check my BTC DOM analysis).
The Fear Index is at 54—people are scared.
Funding rates are extremely negative.
Most assets' RSI levels are oversold (in a bull market!).
All these factors tell me it’s the perfect time to open swing long positions while everyone else is panicking and selling their coins at the lows.
Let’s take TAO as an example:
We’ve hit a key SR level.
The election swing lows have been raided.
A 4H bullish HTF shift has occurred—this is my confirmation.
Entry: $455
SL: $355 (closing daily below)
TP: ATH - $750
Good luck! And remember: buy when they’re scared, and sell when they’re greedy.
-AS ALWAYS, MANAGE YOUR RISK-

XRP Update - 11.12.2024 / Local Long idea Formed liquidity withdrawal from below also structure change and imbalance!
Planning to work in Long on order flow!
Observe risks and think with your head!
