$AAVE Daily Hidden Bullish divergence?CRYPTOCAP:AAVE and alts begin their retracement Wednesday but is this a long term top or just local? Im betting we have a higher to go this summer..
Hidden daily bullish divergence is printing on RSI at the daily pivot and 0.5 Fibonacci retracement which should all act as strong support provided BTC doesn't dump.
The 'alt-coin golden pocket' Fibonacci retracement 0.786 sits at the descending daily 200EMA and High Volume Node support offering a secondary target for reversal and continued upside.
Losing this and closing below would flip me bearish until a new bullish signal emerges.
Safe trading.
ALTS

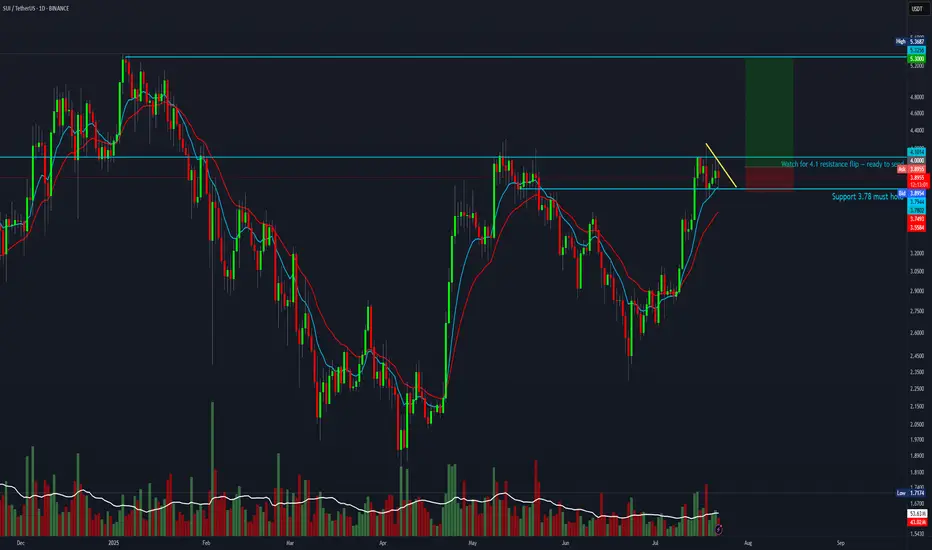
SUI 5R setup forming.SUI looks ready to move. Wait for a breakout above $4 — once it flips the $4.10 resistance, it could fully send toward ATH.
Entry: $4
Stop Loss: $3.70
Target: $5.30
Bitcoin Dominance - No Altseason yetAs long as Bitcoin Dominance is moving in the channel, there will be no AltSeason unless it shows weakness and breaks the channel downwards.

Syrup looks ready to start moving towards new ATH'sCRYPTOCAP:SYRUP has started to break out of its downtrend after revisiting the June lows. It has outperformed most of the market since April, with this month's pullback being an exception. I expect an aggressive move up into new highs. The fibs around $1 look like a good target for the short term, this would also be ~1b mc.

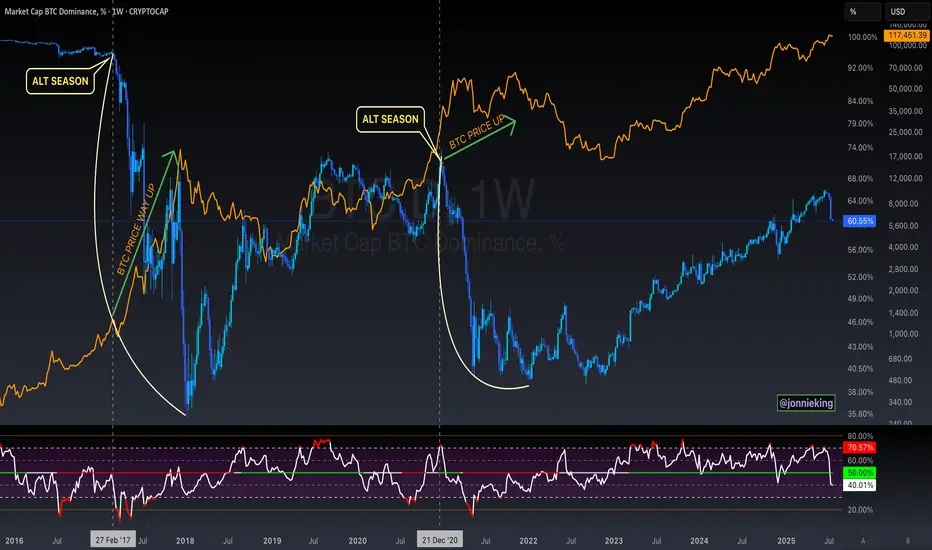
$BTC Will Go Up Alongside Alt SeasonSomeone posted on one of my tweets the following:
" Jonnie my bro, the only problem for me right now is that btc didnt top yet. You also talked how btc shoud top around 200k range. Alt season can only come when btc reach top"
MYTH DEBUNKED ✅
CRYPTOCAP:BTC does NOT need to top in order for Alt Season to commence.
Both can and will occur in tandem 🤝
Altseason Loading?BTC Dominance chart has once again respected the long-term descending trendline resistance, showing a sharp monthly rejection. Historically, similar rejections have marked the beginning of ALT seasons, where capital flows out of Bitcoin into altcoins, boosting their performance significantly.
Chart Highlights:
-Major triangle pattern since 2017
-Clear rejections from the upper trendline coincide with previous ALT seasons (2018, 2021)
-Current rejection resembles those past cycles
-A move down in dominance could fuel strong altcoin rallies
If BTC dominance continues to decline, we could be entering another powerful altcoin season in the coming months.
Cheers
Hexa🧘♀️
CRYPTOCAP:BTC.D BINANCE:BTCUSDT

DOGE | Gearing up For a BIG MOVEDoge is looking mighty bullish after establishing a clear bottom.
Together with confirmation from BTC, we can safely say that altseason is yet ahead of us. BTC's recent increase show that the bullish impulse is still upon us. And after ETH increases, the rest of the altcoin market will follow suit as per usual.
DOGE is bullish because:
✅ Clear bottom
✅ Higher lows, daily looking to reclaim the moving averages:
✅ Altseason upon us after ETH increase
Ultimately, we need to wait for confirmation - if THIS major resistance zone is cleared (in other words if daily candles close ABOVE this zone) then we're full bull mode.
________________
BINANCE:DOGEUSDT

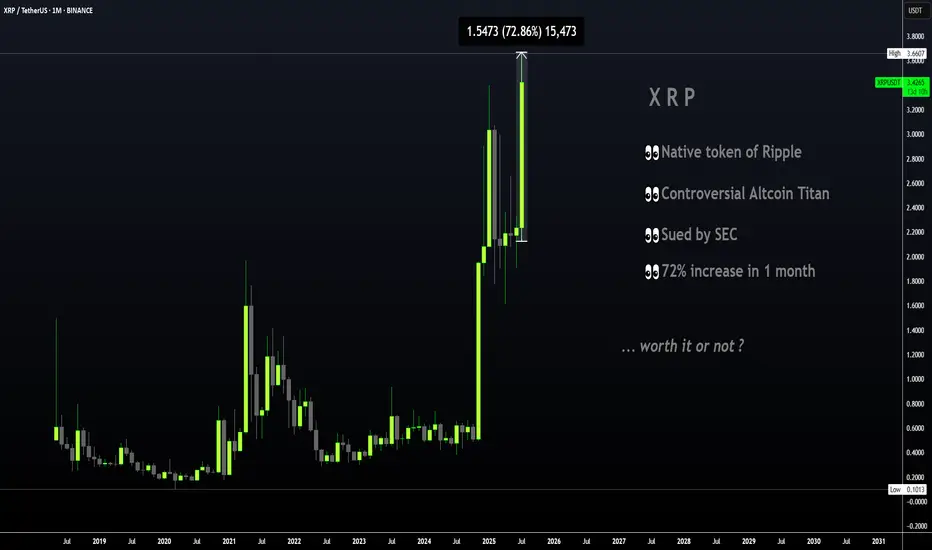
XRP | Great TP Zone is HERE for HODLERSXRP has seen a 62% increase since breaking out above the moving averages in the daily timeframe.
The previous time XRP broke out above the moving averages in the daily, the price increased around 440%:
However, with XRP being the ultimate pumper and dumper, I'll take my chances at 62%! Because this bull run has been anything but ordinary and it's best to avoid being too greedy. The price of XRP falls extremely quick, just as quick as it rises.. ( Maybe not overnight but you know, it has happened before ).
If you're one of few who bought around $1, or heck even later at $2, this is a solid increase and it should not be taken for granted. XRP has gone LONG periods without increases and often stayed behind making new ATH's when other cycles have come and gone (twice), as other alts make new ATH's. Over the years, I've made extensive posts on XRP; documented its use case, followed the SEC case closely and yet, XRP still remains one of the strangest and most unpredictable alts I have ever tried to analyze. Long term followers will remember that a I was bullish in 2018/2019 and then slowly became uninterested up until the point of negative towards XRP for probably the past 3-4 years.
This is not only because of the lagging price compared to other older alts that soared like ETH and even Litecoin. Sure we did not see the growth and the taco stand ( who remembers ) just kept dumping on the market... But the entire "scandal" of the actors marketing/pimping, the dumping behind the scenes by executives to fund Ripple in early days, the lawsuit etc. was just such a colossal mess that I even wonder how XRP is still alive and kicking today.
All I'm saying is that this is truly a spectacular moment - it's hard to even imagine cripple crossed $3 after years and years of waiting on XRP when other alts x1000% and beyond. Point being - Don't miss it! Trading only works when you take profits.
________________________
BINANCE:XRPUSDT
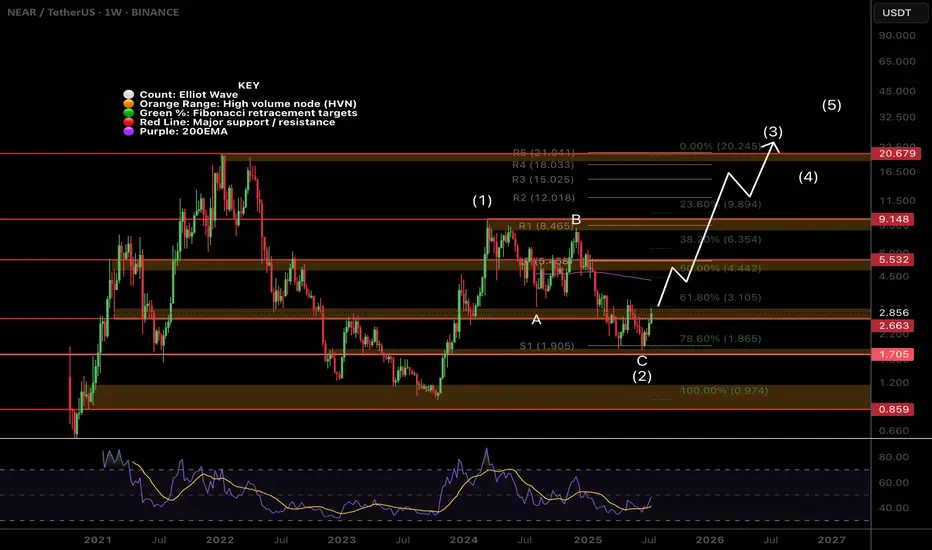
$NEAR Weekly TextBook Elliot Wave!CBOE:NEAR Weekly chart is a great demonstration of the text book motif wave followed by ABC corrective wave.
Bullish divergence has printed on the weekly RSI at the S1 weekly pivot support and the 'alt-coin golden pocket' 0.786 Fibonacci retracement. Price is closing in the major resistance High Volume Node.
The upside target is the newly printed weekly 200EMA followed by the weekly pivot and major resistance HVN just above $5.
A terminal target for this cycle may only see NEAR hitting all time highs around $21, the R5 weekly pivot point.
Safe trading
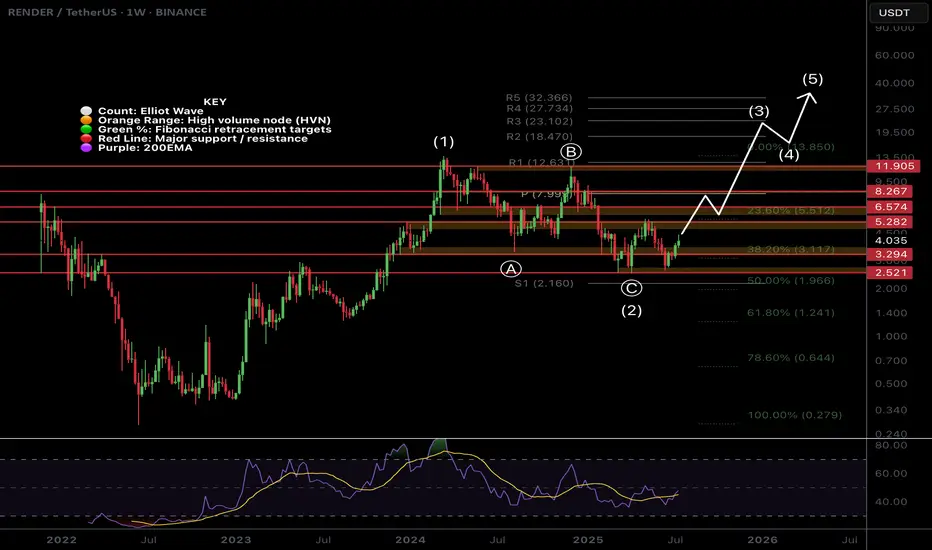
$RENDER Weekly Brings Clarity!CRYPTOCAP:RENDER weekly chart shows long term strength through the depth of the Fibonacci retracement not even reaching 0.5.
The depth of the recent swing low been so close wave (C) does concern me that the larger correction is not yet over and maybe price does want to visit the 'alt-coin' golden pocket of the 0.618-0.768 Fib retracement Where the would be a High Volume Node (not drawn).
For now the upside target is the weekly pivot but the local chart has a lot of work to do first with daily 200EMA!
Safe trading
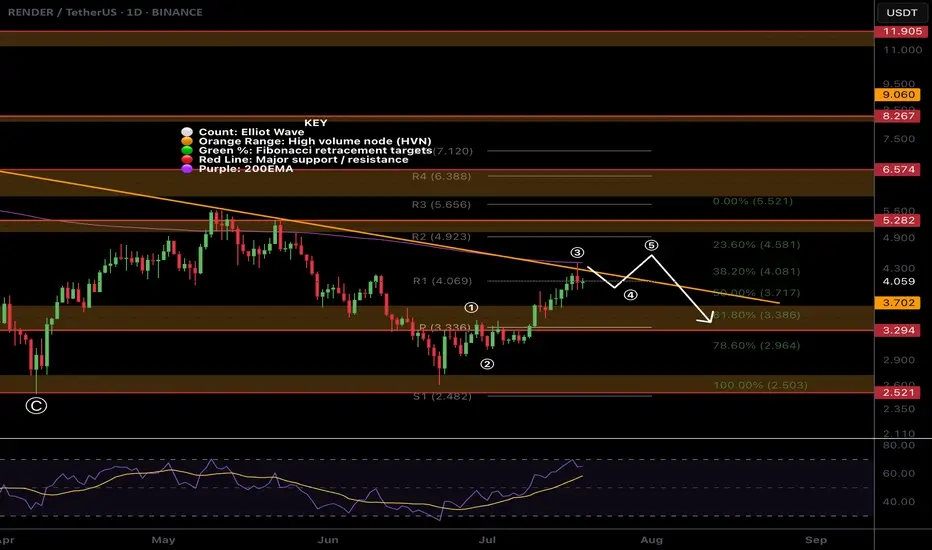
$RENDER At Major Resistance!CRYPTOCAP:RENDER has been relatively weak. Looking at the local chart it appears we have finished a wave (3) at the daily 200EMA and descending resistance.
Price has overcome the High Volume Node (HVN) support flipped resistance but a strong at coin pull could see fresh lows for Render.
There is also daily bearish divergence on the RSI.
The Elliot Wave count could also be an ABC corrective wave up which has now terminated.
If its a new motif wave and a major bottom has formed , wave 2 should find support at the HVN, daily pivot and 'alt-coin' golden pocket between 0.168 and 0.782 Fibonacci retracement
Safe trading
Is Your Altcoin on the Chopping Block?-Update: Originally posted on July 8, 2025… but swiftly vanished into the void by a moderator (rookie mistake—I neglected the sacred posting rules). Turns out, publishing has rules… that I did not interpret accurately?
To my loyal circle of 5 followers: if this feels like déjà vu, my sincerest apologies for the rerun. But with the winds shifting and the drums beating for alts season, I figured it was worth a resurrection.
Let the thrills—and the calls—begin. 🎭📈
Whenever you see “-Update:” that’s the latest as of today — 07/18/25.
Is Your Altcoin on the Chopping Block? 🪓
Brace yourself—this might sting.
Odds are, your favorite altcoin is walking a tightrope. And while I’m not here to spread doom, I am here to give you a wake-up call. Don’t shoot the messenger.
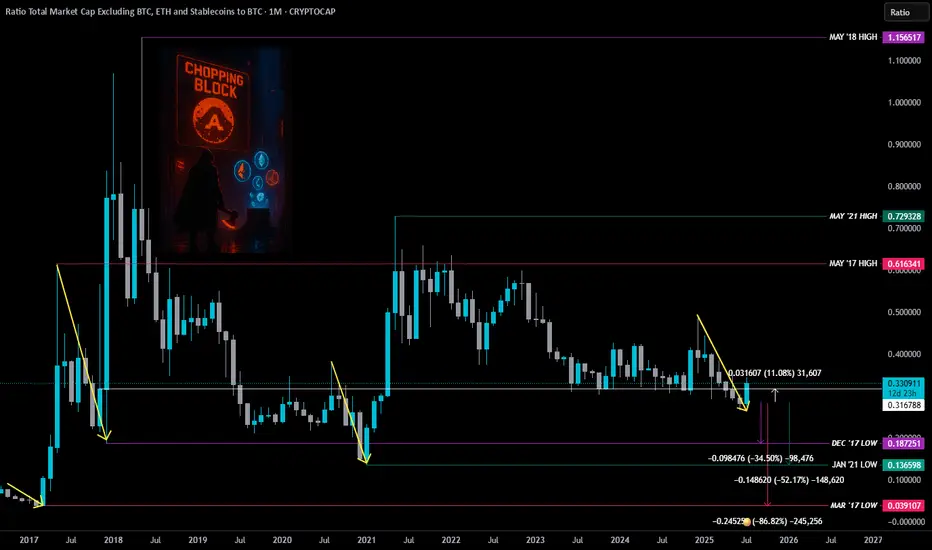
TradingView recently dropped a chart that cuts through the noise: Total3ESBTC.
It’s a ratio of the Total Crypto Market Cap (minus BTC, ETH, and stablecoins) to Bitcoin.
Translation?
👉 A clear, undistorted look at how the altcoin market is actually doing—without ETH clouding the view or stablecoins muddying the waters.
Think of it like night-vision goggles for spotting altcoin strength—or weakness—in the shadows of BTC dominance.
Perfect tool to sniff out market rotation—that sweet spot where Bitcoin hands the baton to alts or rips it back.
So why should you care?
Because the writing's on the wall... and most altcoins might not survive what's coming.
Let’s break it down:
ZOOMED OUT – MONTHLY VIEW 🔭
Before every major altcoin run, there’s always a major low.
You’ll notice three big ones:
🔴 March 2017 (Pink Line)
🟣 Dec 2017 (Purple Line)
🟢 Jan 2021 (Green Line)
Yes, some individual alts have pumped. A few even went full parabolic.
But if altcoins as a whole were ready to fly? They would've taken off already.
-Update: Yes, they finally did it this week… but hold that excitement—there’s more to the story.
Instead, the altcoin ratio broke a critical support (White Line) back in May... and even closed below it. That’s not bullish—it’s a red flag flapping in the wind.
– Update: We just sliced through that white line, but for most alt’s to stay strong, we need a monthly close above it.
Strangely enough (or coincidental, if you believe in coincidences) ...
🗓️ All the major altcoin market highs happened in MAY.
Not once. Not twice. Every. Single. Time.
🔴 May 2017
🟣 May 2018
🟢 May 2021
Call it coincidence. Call it cycle magic.
Maybe it’s a message from the crypto gods—and they don’t whisper for no reason.
So if we just had another May, and the ratio is still sliding with no reversal in sight… ask yourself:
Was that the high?
Or are we still heading toward the low that resets the board?
Here’s the hard pill 💊
If altcoins are ever going to go up again, odds are they’ll need to hit one of these historical lows first.
That’s not a prediction. It’s just how the markets have moved before major alt run.
📉 That means more pain ahead.
We’re talking potential drops of:
🔻 -32% to revisit Dec '17 levels
🔻 -51% to retest Jan '21 lows
🔻 -85% if we go full wipeout to March '17
Harsh? Yeah.
But better you hear it now than wonder “what happened?” when the floor caves in.
The worst part?
Most won’t believe this until it’s already too late.
-Update: Those lows haven’t been tested yet—might be wise to hold off on loading your bags to the brim. Patience pays.
Now here’s the uncomfortable twist:
There’s a legit case to be made that we may never see another “real” alt season again.
Why?
🪙 Liquidity is being siphoned by stablecoins
📈 Speculation is migrating to AI stocks
⚠️ Risk appetite is narrowing
Altcoins used to be the Wild West. Now? They’re the illiquid backyard of a global casino.
BUT… Let’s put on our degen-tinted glasses for a second.
Suppose the Fed hits the panic button:
🛩️ Rates cut
💸 QE returns
🚁 Helicopter money rains from the sky (not that they’d ever do that… right?)
– Update: Crypto Week is announced and broadcasted to the herd.
What happens then?
That’s when this chart—this ugly, broken, bleeding chart—might finally spring back to life.
– Update: Clearing those lows would’ve made this week feel a lot more convincing. But if you’re looking for signs of life—ETH/BTC chart might just be lighting the way. 🚀
Stay Sharp! 🐋R hUNTING!
THIS IS NOT FINANCIAL ADVICE. FOR EDUTAINMENT PUPOSES ONLY.
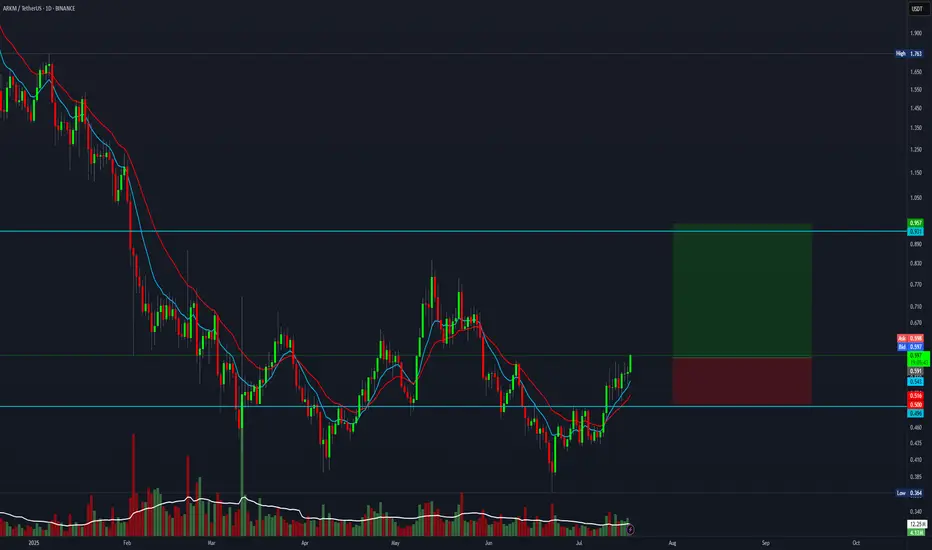
4:1 R:R trade setup for ARKMEverything is pumping right now, and this one also offers a 4:1 R:R setup.
Entry: 0.596
Stop Loss: 0.500
Target: 0.950
ETH relative to AltcoinsI fee like at this current point as we see altcoin pairs bleed against ETH and BTC while putting in lower lows while Eth puts in higher highs we will not see the altseason we are hoping for until altcoin pairs hit here range lows which I can see happen end of Q3 into the start of Q4 but until then they can still rise as ETH.D continues its rally but I feel until altcoins reach its range lows being the .25 lvl on (TOTAL3-USDT)/BTC we will not see that face melting rally we are looking for.

$ETH Pullback to $2630 Support?CRYPTOCAP:ETH has a great week pushing through resistance and making new local highs after testing the daily 200EMA and daily pivot as support.
Price is likely to retest the swing high and previous resistance as support around $2600-2700, also the .382 Fibonacci retracement.
RSI is printing daily bearish divergence in overbought from the wave (3) top to current as it did at the wave (5) top seeing large rejection. The retest of $2600 would reset RSI.
Price is ultimately set to test $3600 as the next resistance if the Elliot wave count is correct.
Analysis is invalidated below $2050
Safe trading

Balla is still Bullish on BITCOIN. Cup & Handle pattern. The trend is still our friend.
I still see bullish developments in the price action.
We must have patience.
Dips still must be bought.
The plan hasn't changed.
We still aiming for that time period of 9 -15 months post #BTC Halving.
We are only one month down :)

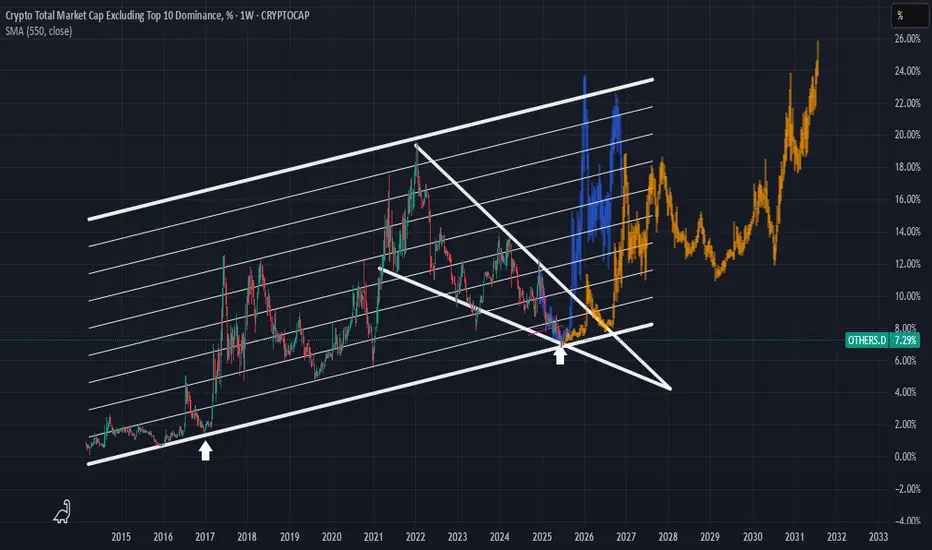
Very similar to January 2016You are looking at the Crypto Total Market Cap Excluding the Top 10 cryptocurrencies (OTHERS.D) on a weekly timeframe. This chart is often used as an "Altcoin Index" to gauge the strength of the broader cryptocurrency market beyond the major players like Bitcoin and Ethereum.
Here's my observation about being in a period similar to January 2016.
The technical analysis on this chart is built around a few key concepts:
1. Long-Term Ascending Channel: The dominant feature is a large parallel ascending channel that has contained the altcoin market cap's movements since 2015. The upper line has acted as a resistance level during bull market peaks, and the lower line has served as a major support level during bear market bottoms.
2. Historical Fractal (The "January 2016" Idea): My idea centers on a historical comparison, or a "fractal."
- The first white arrow points to a period in late 2016. At this time, the altcoin market cap found a bottom right on the support line of the ascending channel. This bottoming phase preceded the explosive 2017 bull run.
- The second white arrow points to a projected time in late 2025 / early 2026. The chart suggests that the market is currently in a similar bottoming pattern near the same long-term support line.
3. Falling Wedge: I've drawn a large falling wedge pattern starting from the peak in late 2021. This is typically a bullish reversal pattern, suggesting that the long downtrend could be nearing its end. The price is currently interacting with the apex of this wedge, a critical decision point.
4. Price Projection: The orange and blue bar patterns are copies of the price action that followed the 2016-2017 bottom. By pasting this fractal to the current time, the chart visualizes a potential future where history rhymes, leading to a massive new bull market for altcoins extending into 2027 until the end of the roaring 20s.
The Bullish Case (According to the Chart)
The argument presented by this analysis is clear:
• The altcoin market is at a historically strong support level (the bottom of the ~10-year channel).
• This is the same support level that kicked off the massive 2017 bull market.
• The market is consolidating within a falling wedge, which has a higher probability of breaking to the upside.
If this analysis holds true, the current period could be seen as a significant accumulation zone before the next major market expansion, much like the period around January 2016 was.
Important Considerations and Risks
While this is a compelling technical setup, it's crucial to maintain a balanced perspective. Here are some factors to consider:
• Past Performance is Not a Guarantee: This is the most important principle in financial markets. While historical patterns can provide valuable insight, they do not guarantee future results.
• Market Dynamics Have Changed: The cryptocurrency market of 2025 is fundamentally different from that of 2016.
• Maturity and Size: The market is significantly larger and includes substantial institutional investment, which can alter market behavior and volatility.
• Macroeconomic Factors: Global economic conditions, such as interest rates and inflation, now have a much stronger influence on the crypto market than they did in its earlier days.
• Regulatory Environment: Increased global regulatory scrutiny can introduce uncertainty and risks that were not present in the 2016-2017 cycle.
• Subjectivity of Technical Analysis: The trendlines and patterns are drawn based on an analyst's interpretation. Another analyst might draw them slightly differently, leading to a different conclusion.
Conclusion
The idea that "we're in January 2016 all over again" is a valid interpretation based on the technical patterns in this chart. The analysis points to the altcoin market being at a critical long-term support level, similar to the setup that preceded a major historical bull run.
This chart lays out a clear bullish roadmap. However, everyone should treat it as a potential scenario, not a certainty. I'll continue to monitor if the price respects these historical levels so that you guys are mindful of the broader market and macroeconomic factors that could influence the outcome.
Disclaimer: This analysis is for informational purposes only and is based on the technical analysis presented in the user-provided image. It should not be construed as financial advice. All investment decisions carry risk, and you should conduct your own research.
Altcoins Rise Again – Off to 1.07T and 1.51T?🌊🚀 Total Market Cap (excluding BTC & ETH) is showing strength again, pushing off support and heading back into the heart of the channel.
💥 The bullish structure has been respected beautifully:
✅ Double bottom near channel base
✅ Clean bounce and new higher low
✅ Momentum building on macro trend
📈 As long as this channel holds, we're eyeing the next targets:
🔹 Mid-channel target: $1.07 Trillion
🔹 Channel top extension: $1.51 Trillion
From the "Escape" back in late 2023 to the clean retest — it’s now about confirmation and continuation.
This could be the altseason move everyone forgot about...
🛑 Long bias stays intact as long as the bottom channel support is respected.
Time to respect structure over noise.
One Love,
The FXPROFESSOR 💙
Disclosure: I am happy to be part of the Trade Nation's Influencer program and receive a monthly fee for using their TradingView charts in my analysis. Awesome broker, where the trader really comes first! 🌟🤝📈

Bitcoin Dominance Rebounds – Bad News for Altcoins??📊⚠️ Bitcoin Dominance Rebounds – Bad News for Altcoins? 🧨💣
Today’s chart says it clearly: Bitcoin Dominance is bouncing off support at the edge of its ascending channel. This rebound zone around 64.58–64.64% has been critical — and the move up confirms it’s holding… for now.
❗ With Bitcoin itself facing heavy resistance, this dominance bounce is not good news for altcoins. In fact, it's a classic setup for capital rotating into BTC and out of alts — not the other way around.
📌 Chart Breakdown:
Biggest alt bull runs have started when BTC.D failed here — not when it rebounded
Breakout above 71.3% = serious risk of altcoin extinction
Breakdown below 62.3% = green light for altseason
🧠 As I’ve written on the chart: the END of alts comes not just from price — but from meme culture, utility decay, and market maker manipulation. That zone? 97% BTC.D. We’re not there, but we’re not heading toward freedom yet either.
🎥 Want to see how this fits into the full market picture? Watch the July 10th macro update:
👉 July 10th Market Outlook – Uncharted Waters, Uncertain Momentum
The market’s pressure is rising.
No good news from BTC.D today.
One Love,
The FXPROFESSOR 💙
Disclosure: I am happy to be part of the Trade Nation's Influencer program and receive a monthly fee for using their TradingView charts in my analysis. Awesome broker, where the trader really comes first! 🌟🤝📈

Can the Graph chart a recovery rally into resistance?Quite a few multiples if it can!
Entires in the support band represent low risk entries
(compared to last cycles elevated valuation's)

APE coin cup & Handle. This chart shows good potential as the #Alts start to take back center stage form #BTC
neckline around 79c
could be a triple if Alts can sustain an uptrend.
it's been a while
but the time is now
if it is to be the case.

Ethereum setup with a 14 R:R.Let’s see if this time marks the beginning of bullish momentum.
This setup offers a 14:1 risk-to-reward ratio
Entry at 2560
Stop loss 2457
Target at 4000.

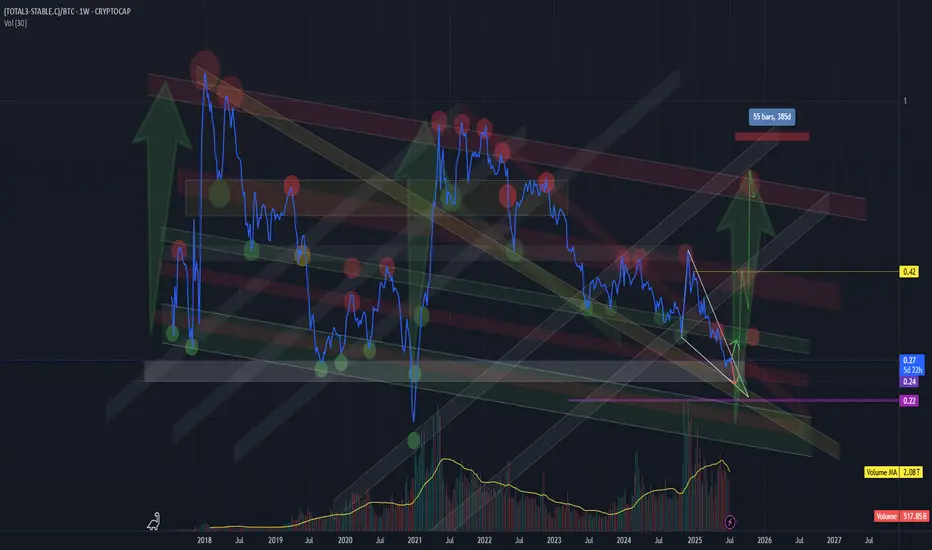
True altcoin-to-BTC strength indicator(CRYPTOCAP:TOTAL3-CRYPTOCAP:STABLE.C)/CRYPTOCAP:BTC
This formula strips out the noise and gives a true altcoin-to-BTC strength indicator.
STABLE.C removes all major stable coins (USDT, USDC, DAI, etc.).
The chart clearly shows previous capitulation zones and launch points for altseasons since 2017
Current formation – potential triangle:
Market makers appear to be coiling price action, forming a triangle-like structure.
This often precedes a volatile breakout — likely to the upside if history repeats.
Market psychology:
Many traders are already heavily positioned in altcoins, which suggests we could be nearing final capitulation.
Historically, altseasons never began with euphoria — but rather fear, exhaustion, and apathy.
BTC halving occurred in April 2024, and typically, the peak of the altseason follows 12 to 16 months later.
The seasonal strength of Q4, often fuels altcoin rallies.
!!! A final washout into a key support zone (on this ratio) could mark the trigger for the next major altseason — possibly starting around August 2025 !!!!!!!!