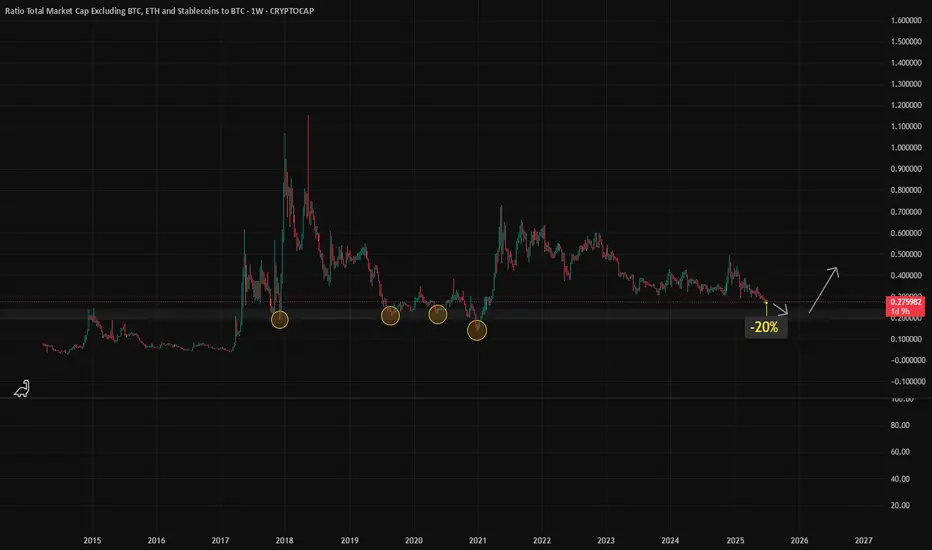
Altcoins Near Key Support, Possible -20% Drop before reversal ?Sharing my analysis on the altcoin market cap (excluding BTC, ETH, and stablecoins) compared to BTC over the past 10 years
I have marked important zones (yellow circles) where altcoins have historically bounced after strong corrections.
Current Outlook:
- I expect a possible -20% more downside, bringing it near 0.22, which aligns with a key historical support zone.
- This level has acted as a strong base multiple times, in 2018, 2020 and 2021
What I’m Watching:
- If price reaches that zone and holds, it could signal the start of the next altseason.
- Past patterns show similar moves before big reversals.
- However confirmation through volume and market sentiment is important before making any move
Final Note:
Not financial advice, just sharing what I see on the chart. If the ratio hits 0.22 and shows strength, it could be a key level to watch. Thanks
ALTS
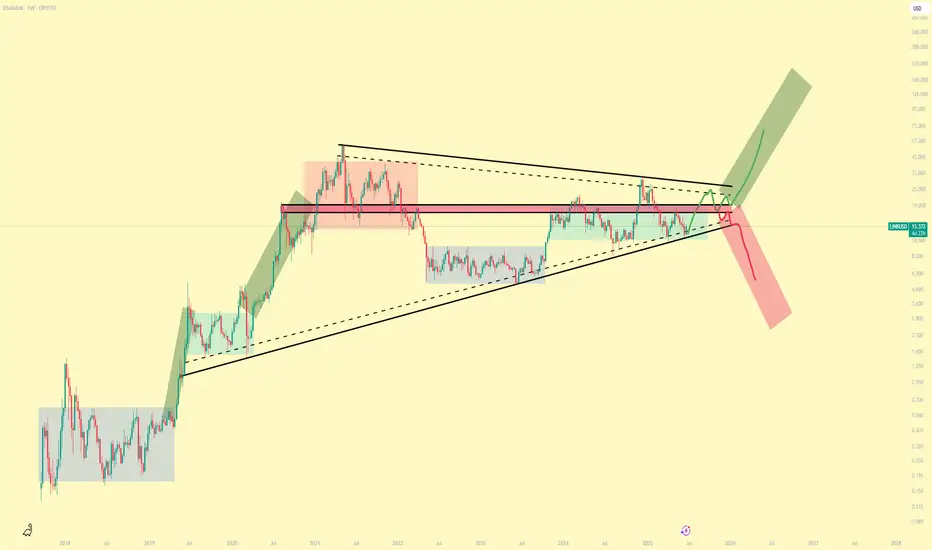
$AAVE Going Through a Major Bullish Trend Shift!CRYPTOCAP:AAVE continues to outperform on pumps and retracements this cycle after being beaten down for many years!
Price consolidated below the weekly pivot and found support, only retracing to the .618 Fibs.
Wave 3 of iii pf a new Elliot Motif Wave looks well underway with the next price target being the R1 weekly pivot High Volume Node at $448.
Long term outlooks is very bullish for AAVE with a terminal target of the R5 weekly pivot £1155
Safe trading

$ETH Wave 3 of 3 Underway?CRYPTOCAP:ETH is back into the range EQ as alt coins pump on the back of CRYPTOCAP:BTC breakout
Price caught a strong bid after testing quadruple support: the major High Volume Node (HVN), daily 200EMA, 0.5 Fibonacci Retracement and daily S1 Pivot. Last week I posted about this area holding to kick off wave 3.
There is still work to do to overcome the recent swing high at HVN major resistance but things are certainly looking bullish. The daily pivot point sits at $3150 as the next target.
Long term terminal target for wave 3 is still the R4 daily pivot at $7340, I don't expect the terminal wave 5 to extend much beyond this, perhaps a wick above to trap retail at the top with a lot of media hype attached.
Analysis is invalidated if we fall below wave (2) swing low $2050.
Safe trading

MEW Main Trend. Memcoin. 2025 07 02Logarithm. Time frame 3 days.
Cat in a dogs world (MEW)
X -133 thousand subscribers (this is not enough).
Reduction from the maximum -87%. For such assets, this is not enough.
I imposed a descending channel on the chart (current descending trend of the main trend), and a horizontal one, if by some miracle this local Ross hook is broken upwards (not forming a local head and shoulders), not only to the resistance of the secondary trend (red line), but to break through it. Percentages to key zones of support/resistance levels are shown for clarity.
After the downward trend is broken, such "psychological-fundamental" assets are usually pumped up by +800-1000% from the minimums or more. Low liquidity, and the contingent of people who subscribe to these projects, allows this to be done easily at the right time: "the hamster is not scared". After pumping — a slow death, with pumps an order of magnitude smaller. Therefore, do not forget to sell in the alt season.
When working with such cryptocurrencies by liquidity, observe money management, use partial entry or on a breakout. Do not use margin leverage, as there may be snot in any direction for a large percentage, which will lead to liquidation "out of the blue".

SOL Ready To Breakout?SOL had a decent move this weekend overcoming descending resistance and now testing as support.
Price appears to have a completed a wave (2) at the .618 Fibonacci retracement and S1 daily pivot and a larger degree wave 2 at the channel bottom, High Volume Node support and .618 Fibonacci retracement.
If a wave (3) of 3 is underway then we should expect a strong move sooner rather than later with an initial target of the swing high resistance a/ R2 daily pivot $208-$216 range
Safe trading.

AAVE Ready For New Highs?AAVE is breaking out of its descending trendline after several tests as resistance.
Wave 2 appears complete at quadruple support: Daily 200EMA, daily pivot, .382 Fibonacci retracement and High Volume Node (HVN). If an Elliot Wave (3) of 3 is underway, price should move strongly sooner rather than later with extended price action.
The next major resistance and partial take profit is at the December swing high range $460.
Analysis is invalidated below $210.
Safe trading

SPA - Next Alt to MOON ??SPA is an altcoin that could make great increases in the near future.
Even though it's currently still trading under the moving averages in the Daily, once it turns there is good upside potential for this alt.
On the bright side, we observe higher lows for SPA:
One should also consider that this may be as good as it gets in terms of a low after the big dip, because a 47% correction is quite something:
IF that diagonal trendline of higher lows doesn't hold, I'd look at these zones next even if just for a wick:
And from here, we can really start to see BIG increases, IF you have the patience:
________________________
COINBASE:SPAUSD

What Is The Market Waiting For?Good Morning Trading Fam,
Our stock and crypto markets seem to have stalled. You may be wondering what they are waiting for. Quite simply, the S&P 500 has reached a double-top. That's all. There may be some more pause here for the next week or so. Barring any significant bearish geopolitical or other events, I expect us to move higher. Any FUD at all will send the market back down again. So yes, unfortunately, the next move(s) will be mostly predicated on news. Traders are rather fragile rn. Trade accordingly.
Best,
Stew

Mr. Rusell (Small Cap index) & Altseason go hand in hand. That's right it does.
Why?
Because small businesses employ nearly half of the workforce of the United States.
So when financial conditions exist for confidence to grow at this level of the economy expressed via hiring and expansion of said businesses the ripple effects are huge.
Which can be seen during Altcoin boom's (banana zones)
This cycle especially as one whole Bitcoin is out of reach for the common man. When Retail hot money does return to crypto expect small cap low numerical valued coins to really start outperforming BTC

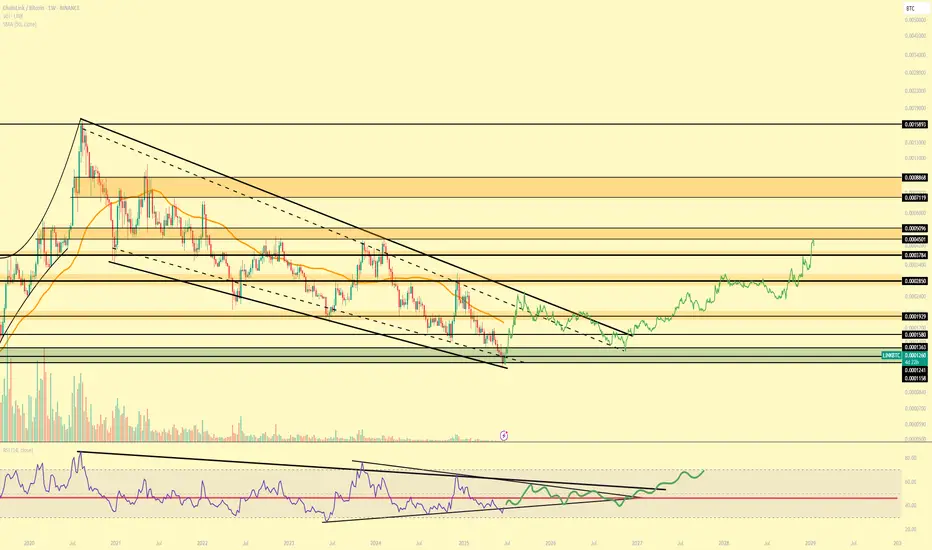
LINKUSD Paths on OfferPretty clear accumulation stages going on and so I am inclined to think we head towards the Bullish path to ~$100
Bears will want to buy LINK at massive discounts and so perhaps we do see some capitulation before our next mark-up phase.
However, the current Total Market cycle patterns, along with the BTC pairing, almost rule out the possibility of further downside, or at least major downside.
LINK / BTC Looking Juicer Than EverEven if you aren't aware of the fundamentals of LINK adoption & application , the chart speaks for itself.
Would be very surprised is LINK isn't bottoming out here and all it needs is a bit of sideways before we get some expansion and mark-up.
How to Tell BITCOIN is BULLISH using MOVING AVERAGES OnlyBTC is trading sideways and it sparks a lot of debate whether or not we are at the beginning of a new bearish cycle, or if there is still a push upwards waiting to happen.
Here's how you can use the Moving Averages to determine whether or not BTC is bullish.
Don't miss this update on my stance on the market and why I think ALT Season is waiting:
______________________
BINANCE:BTCUSDT

Something Like ThisI believe the charts are pointing towards the market gearing up for a play somewhat like this.
The timing may well be off, but the levels and sequence seem broadly predictable.

Altcoin Season - Just around the corner!!!In this analysis I share my hypothesis on #OTHERS CRYPTOCAP:OTHERS as to why the big awaited alt season is right around the corner !
After analysing how the Trump mania season unfolded, I could see plenty of similarities:
1. Price filled the supply before the last retrace - gray rectangle
2. Then it broke the downtrend line and made a decent move up - red dot
3. Price correction to the 618 retrace on fib AND in the supply -> became demand from #1
4. RSI formed a hidden bullish divergence, marking a potential start of the rally
5. Time passed from #2 trendline breakout to the big impulse -> around 50 days
-> now we are around 60 days, which means more time to accumulate, bigger impulse
In an ideal scenario, the total OTHERS cap (all crypto excluding top 10) should at least reach the last high of 450 billions, and to pour some hopium, to around 600-700 billions...
So if you filled your bags around recent prices on your alts, you should expect at least 10-20x imo!

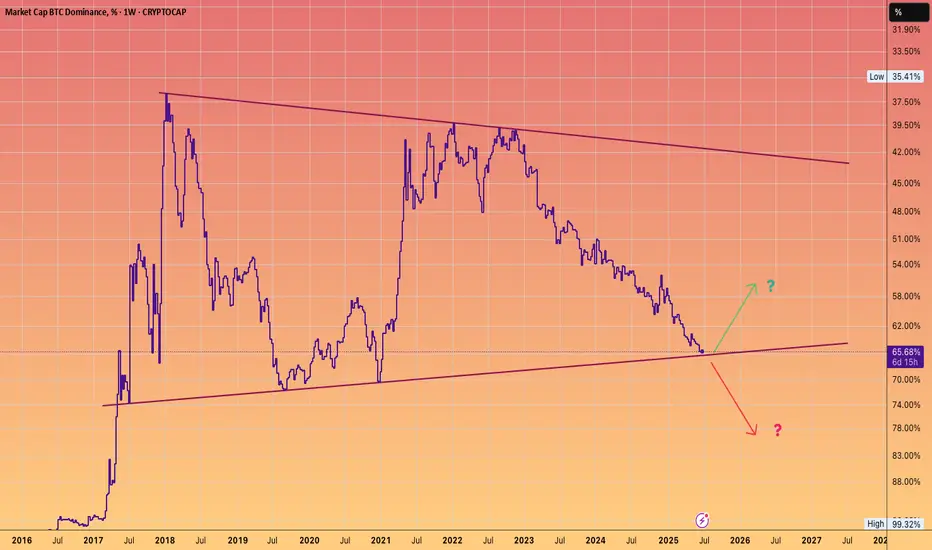
BTC DOMINANCE at pivotal juncture.Which direction do you favour?
The chart is inverted, so the up move will result in #Alts outperforming #Bitcoin.
AAVE Standing out among the alt coins!CRYPTOCAP:AAVE is looking stronger than most for now. Local analysis has broken the bullish market structure on what appears to be a textbook Elliot Wave 1.
Price is testing quadruple support: Daily 200EMA, daily pivot, major support High Volume Node (HVN) and the 0.382-0.5 Fib retracements. This should be a tough nut to crack (as long as CRYPTOCAP:BTC doesn't dump hard).
Wave 2 retracement's are usually deep and come with a strong fear. It is where most retail investors capitulate only to find price turns around and continues bullishly without them in a aggressive wave 3.
Analysis is invalidated below $111, so quite a ways off yet.
If war escalation continue, irrational investor behaviour will likely break this technical analysis.
Safe trading.

ALTCOINS: Market bottomed and about to surge.The Altcoin market is almost oversold on its 1W technical outlook (RSI = 30.160, MACD = -0.160, ADX = 18.210) but this very same 1W RSI pattern has emerged numerous times before an altcoin market surge (Altseason). How high it can go depends on whether the Fed will cut on its next meeting or not. Nevertheless, this level is an excellent opportunity to start investing in altcoins.
## If you like our free content follow our profile to get more daily ideas. ##
## Comments and likes are greatly appreciated. ##

ATOM | SLEEPING GIANT | Altcoin GEMATOM is an alt that I have high expectations for.
From a 4h perspective, we can see the short term price is still very bearish.
This is confirmed by trading under the moving averages, which indicates that the sellers are in control.
The great news about this is that the price doesn't stay long UNDER the moving averages in the 4h. From the chart below, we see a very evident bearish trend - the price STAYS under the moving averages, with occasional, random wicks above and to the upper purple (200d MA).
After the bottom, marked the " BIG TURNAROUND ", we see the price trading mostly just under or just above, as we observe range trading. This is how we know, the bottom is in / close. And from here, it's only a matter of time until we start turning around to another bullish cycle . Where the gains far outweigh the risk.
Following this logic, the next reasonable ( very reasonable ) target, is the purple moving averages, and beyond. Currently at $4.3, a nice +8% from here.
_______________________

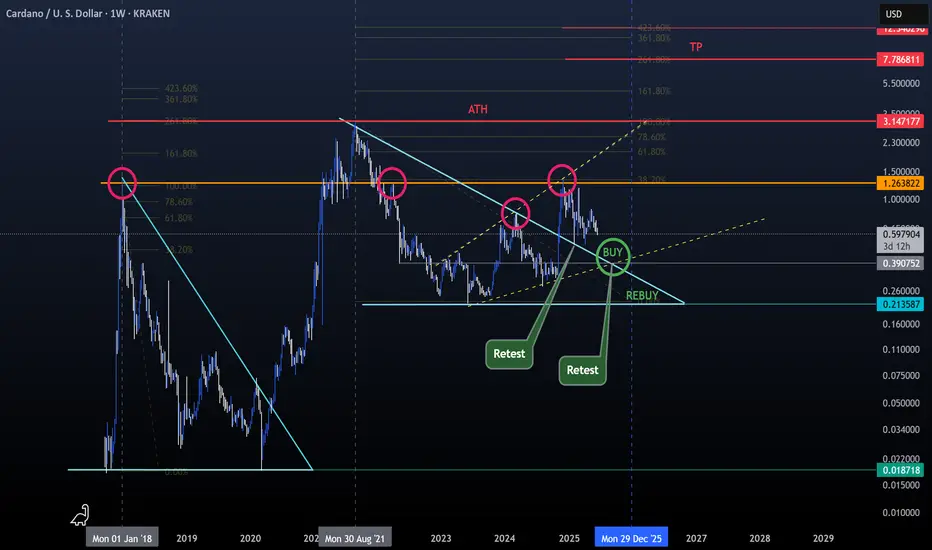
Cardano UpdateA lot of you have been DMing me asking for altcoin analysis. i hear you, but here's the truth:
- Right now, most altcoins are simply too weak to offer a reliable forecast. I prefer to post when timing makes sense, not just for engagement, but to avoid misleading anyone.
- BTC Dominance is still heavily suppressing the altcoin market, and I’d rather wait than risk rekting my followers with premature calls.
So why do I post about Cardano? :
- Simple, Cardano is one of the most established altcoins. It makes sense to track its evolution alongside Bitcoin and Ethereum. When you're analyzing the broader market cycle, starting with BTC, ETH, and ADA gives meaningful context. Newer cryptocurrencies from 2020+ don’t have the same historical data, which makes reliable analysis much harder.
Back to Trading (Everything is marked on the chart for easier reading) :
- Cardano got rejected around $1.25, which aligns with its 2018 ATH, a key historical resistance.
- Check the bullish megaphone pattern and how it connects with the trendline and that $1.25 level (marked with yellow dotted lines).
- Also observe the minor bounces and retests above the bearish triangle trendline (light blue).
What we can do now?
- Nothing. If BTC dips, altcoins will likely follow and get rekt.
Best strategy for now:
- Consider setting a buy order around $0.41 (don’t go all in).
- Keep some dry powder in case of further downside, potentially to rebuy around $0.21 if pressure continues.
Be wise, be patient, ride the wave, don’t fight it.
Happy Tr4Ding !
Alt Season: When’s the Big Boom?TOTALE100 refers to small caps or the total market capitalization of the top 100 cryptocurrencies , excluding stablecoins. It is part of the CRYPTOCAP series.
It measures the total combined market cap (price × circulating supply) of the top 100 crypto assets by market cap.
Useful for:
* Gauging overall market strength or weakness.
* Spotting macro-level trends or capital inflows/outflows into the crypto sector.
Technical Outlook:
On the weekly chart, the price is facing rejection at 16B, forming a triple-top distribution pattern.
For positioning in small caps, we should wait for a price pullback to the key support zone between 5B and 3B.

Altcoins: Warning. Check this chart!On the weekly timeframe, I’ve noticed a striking similarity between the 2021 cycle and the current one.
Take a close look at the chart—once you see it, you can’t unsee it.
Are we at the same point we were in March 2022?
The MACD is nearly identical
The RSI mirrors the same pattern
The Vortex Indicator stands at a critical crossroad
The only difference: trading volume is significantly higher
This setup resembles a potential triple top formation. If it confirms, it could completely contradict the bullish forecast I’ve held for months—or it might just be a fakeout.
We're at a decision point for altcoins: either the altseason kicks off in September and invalidates this bearish pattern, or we're headed toward a dot-com-style crash for most altcoins—excluding the top 10.
Keep a close watch on $OTHERS. History tends to repeat—let’s hope not this time.
DYOR
#Crypto #Altseason #BTC #CryptoAnalysis #MACD #RSI #BitcoinDominance #Altcoins #TradingView #TripleTop #CryptoCrash #Blockchain #CryptoCycle #MarketAnalysis

$INJ to re-enter my buy zone? $11.12 must hold!Altcoins are experiencing another pullback.
CRYPTOCAP:INJ had a solid pump recently, but it’s now facing a significant drop.
This could be a good buying opportunity — assuming we’re not entering a bear market.
Key level: $11.12 must hold.
If it breaks, the next major support is around $9.10.
While the macro trend remains bullish, this retracement is concerning.
Set your stop losses accordingly.
DYOR.
#INJ #Altcoins #CryptoTrading #MarketUpdate #CryptoAlert #BuyTheDip #DYOR

SWARMS can be a double digit crypto again.Low risk entry level --- if we assume the bull still has legs.
