ONDO,1 more push lowerLSE:ONDO Price is sitting just above High Volume Node support, testing the descending trend-line as resistance. As long as we are below the trend-line, the probability is to the downside.
Wave 2 appears complete after 5 waves down from the wave X flat correction. Price was front-run at the golden pocket Fibonacci retracement, but only a bounce so far. We are below the daily pivot and 200EMA, which is bearish.
📈 Daily RSI tapped oversold twice with slight bullish divergence.
👉 Continued downside has a target of the bottom of the High Volume Node at $0.5
Safe trading
ALTS

HBAR back in the channel!CRYPTOCAP:HBAR Price is back in the descending range after dropping below during the flash crash, which can be viewed as an anomaly.
Wave 2 appears complete at the golden pocket Fibonacci retracement. Price was rejected at the daily 200EMA and channel upper boundary and has lost the daily pivot and High Volume Node, suggesting further downside is to come.
📈 Daily RSI reached oversold and has printed hidden bullish divergence, which is bullish
👉 Continued downside has a target of the $0.13 High Volume Node
Safe trading

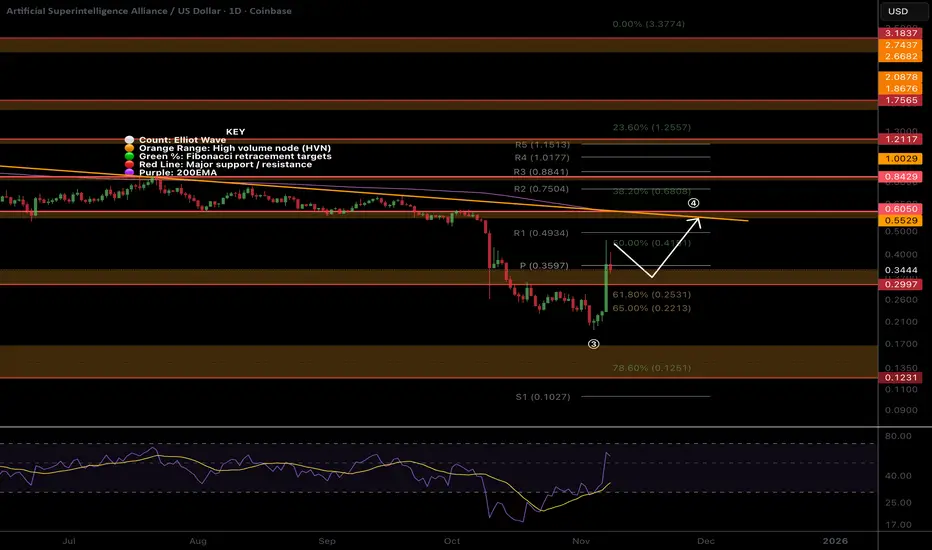
FET, Pump and dump?NYSE:FET Price bounced with a one day candle of 70% recovering the High Volume Node resistance and daily pivot from the golden pocket Fibonacci retracement.
Chasing candles higher is what’s on the cards of naive investors now. Greed and FOMO immediately took over socials with much gloating. This is a recipe for lower, humbling them.
📈 Daily RSI went too high, too fast, and now has bearish divergence in a bear market, a strong signal.
👉 Continued upside has a target of the daily 200EMA and High Volume Node resistance at $0.6.
Safe trading
ETH Correction complete?CRYPTOCAP:ETH Wave 2 is taking the form of a complex WXYXZ correction broadening wedge. Ugly, hard to trade or find any entries. This will cause a lot of stress. This is also potentially a wave 4, but my preferred count is 2 for now.
Wave 2 appears complete with a swing below the boundary, but the recovery should have been stronger by now; instead, we are stalling below the daily 200EMA. The trend is down, and so we should expect more down. Wave X printed a triangle
📈 Daily RSI has not reached oversold and is still bearish with no divergences.
👉 Continued downside has a target of the High Volume Node $2600, where I will be adding.
Safe trading

DOGE More downside to come?CRYPTOCAP:DOGE Price is testing the bottom of the channel and pivot point as resistance, where it is likely to be rejected.
Wave (2) appears complete after the Friday flash crash, hitting the ‘alt-coin’ golden pocket, 0.786 Fibonacci retracement. The trend remains down, so this is the higher probability. Price needs to overcome the heavy resistance ahead before we can talk about being bullish long-term.
📈 Daily RSI has printed bullish divergence, which is bullish
👉 Continued downside has a target of the 0.618 Fibonacci retracement and High Volume Node $0.12
Safe trading

BNB Bearish continuation?CRYPTOCAP:BNB Price appears to have completed wave (1) at the R1 pivot and has retraced to the daily 200EMA, 0.5 Fibonacci retracement and S1 pivot so far. A tough nut to crack.
Wave (2) appears complete with a textbook ABC correction ending at strong support. The downtrend is intact, so the probability is still to the downside until the structure flips.
📈 Daily RSI has not reached oversold and is still bearish with no divergences
👉 Continued downside loses the 200EMA and brings up the Golden pocket as support $740
Safe trading

AAVE local analysis updated, Bear trend continueEURONEXT:AAVE Locally, price continues bearish after falling out of the wedge, completing wave 1. Until the price gets above the orange descending trend-line, the probability is downside continuation.
Wave 2 appears complete after the big drop, black swan event. I was looking for a dip back into the long lower wick, which we have and price found support. This suggests we grind higher from here, but we must get through the daily 200EMA, just above the High Volume Node resistance and daily pivot. This area will be tough to crack.
The alternative count is a triangle forming discussed below, which is the (A)(B)(C) shown.
📈 Daily RSI has printed bullish divergence from the oversold threshold, which is bullish and a bottoming signal.
👉 Continued downside has a next target of $150.
Safe trading

A NEW YEARS GIFT! CHEAP SHITCOINS!OTHERS Index
Has a Clear head and Shoulders
That could see an acceleration and further deterioration of #Altcoins
With major Capitulation's possible
protocol's could suffer hacks, exploits and rugs
Be careful of leveraged positions
And be aware of the risks of certain #defi platforms.
#sol
#sui
#ada
#eth
#bnb
#pulsechain
#btc

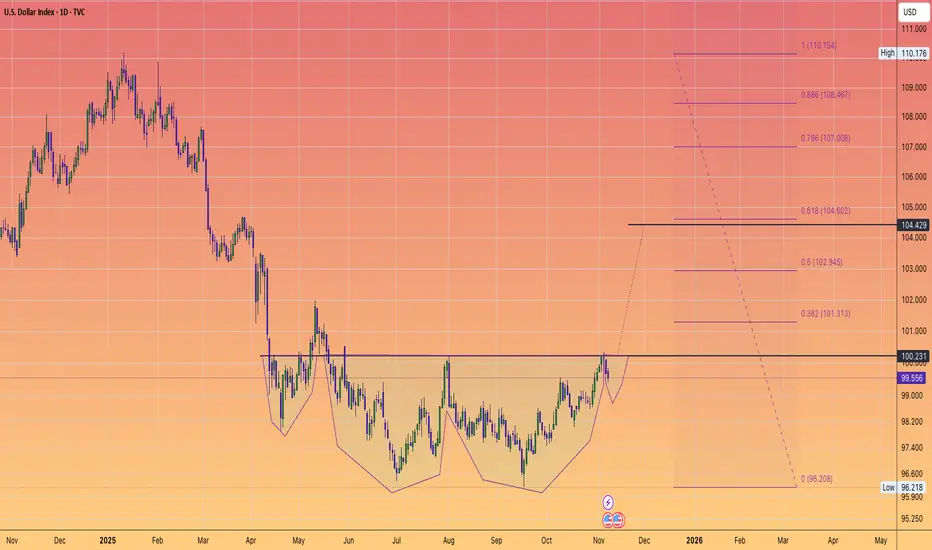
$DXY eye a 5 point move. RISK OFF.The dollar index is reversing course.
And I believe highly likely to trigger this complex inverse head and shoulder's.
A swift move to the 105 region
lines up with a expected downside move in #BTC
A corrective move in the #PreciousMetals
and further profit taking on the #AI trade.
I believe this all could play by Xmas.
So the odds of a #SantaRally are slim given current price action that we are seeing across the board.
ZEN Long
**Technical Structure:** Horizen has a strong uptrend since September 28, 2025, with clear higher highs and higher lows. The October 10 flash crash was an eccentric event (liquidation cascade) that doesn't break the long-term structure. The blue trendline support at ~$13.30 is solid and would require exceptional bearish volume to break.
**Sector Catalysts:** Privacy coins are in a major bull run led by Zcash, which surged +1000% in 2025 and flipped Monero by market cap. Horizen is historically correlated with ZEC and remains undervalued relative to the sector leader. Bitcoin is holding strong support at $101k with massive liquidation walls defending $100k.
**Market Maker Psychology:** Why would market makers break the chart now by hitting the stop-loss at $12.40, when they could pump the price to $20-31 and dump at much better prices? Breaking the $13.30 support would constitute "chart crime" that scares away retail traders and reduces liquidity for optimal distribution. The rational strategy is to accumulate, pump during the privacy narrative, then distribute at the top.
**Odds of Success**
- **TP $16-18:** 65-70% probability
- **TP $20-25:** 45-50% probability
- **TP $28-31:** 20-25% probability
- **Stop-loss (<$12.40):** 25-30% probability

ICP - 35% UP!! CRYPTOCAP:ICP - yesterday vs today... 🔥
Same chart:
9.00$ almost hit✅
+35% given on a silver platter✅
Follow to not miss the next one! 🐸

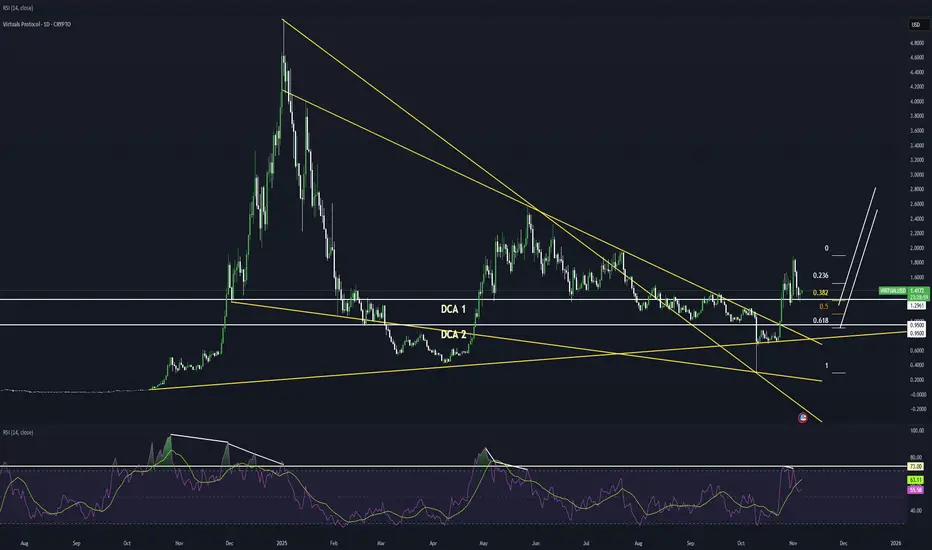
Virtuals Protocol Potential Bullish Breakout OpportunityVirtuals Protocol seems to exhibit signs of overall potential Bullish momentum if the price action breaks the previous prominent Higher High with multiple confluences through key Fibonacci and Support levels which presents us with a potential Non-Levered buy and hold opportunity.
Entry: (Buy 1 CMP & Buy 2 around 1 - 0.95 range)
Stop Loss: 0 (Non-Levered Buy & Hold is recommended)
Potential Range for Targets: 2.5 - ATH
ETC - BEARISH OUTLOOKBME:ETC - price update: 🔴
The current price is sitting on a key support monthly/weekly. .
PA looks weak at the moment, but support are holding.
Yellow zone: 14.50 - 16.80$ = Neutral.
Prices remain stuck under key level, and bias is clearly bearish yet.
A daily candle close under 14.00$ could trigger another big bearish breakout toward 11.50 - 10.00$ or even 8.00$ again!
Upper key resistance:
16.80 - 17.70 - 20.00$ & downtrend daily!
To sum up:
No bull pressure yet, prices is stuck under key levels, and support could be break by the downside! 📉🔴

Altseason? Not yet — but the real move is coming... soon.As shown in the chart, the weekly MACD reset isn’t complete yet. A similar setup happened in September 2024 — we got a fake pump that fooled many, while the real breakout started in December 2024.
🔍 Why does this happen?
Impatient whales — often close to the “crypto president” — start buying early. Using influencers and media hype, they push the "New ATH" narrative and lure in retail. But this early FOMO creates a massive bearish divergence — the RSI hasn’t reset yet, and the market isn't ready.
📉 The result?
A painful 6-month correction that punishes impatience. The market always reverts to math — and math doesn’t lie.
You can’t fake momentum forever — no matter how much money you throw at it.
💡 My forecast remains unchanged:
Once the MACD weekly crossover happens, the real pump begins — no ETF, no Saylor needed. The market moves on its own, as it always has.
📊 Check the chart. Read the signals. Trust the data.
#Bitcoin #BTC #CryptoTrading #CryptoWhales #MACD #TechnicalAnalysis #BearishDivergence #Altseason #DYOR

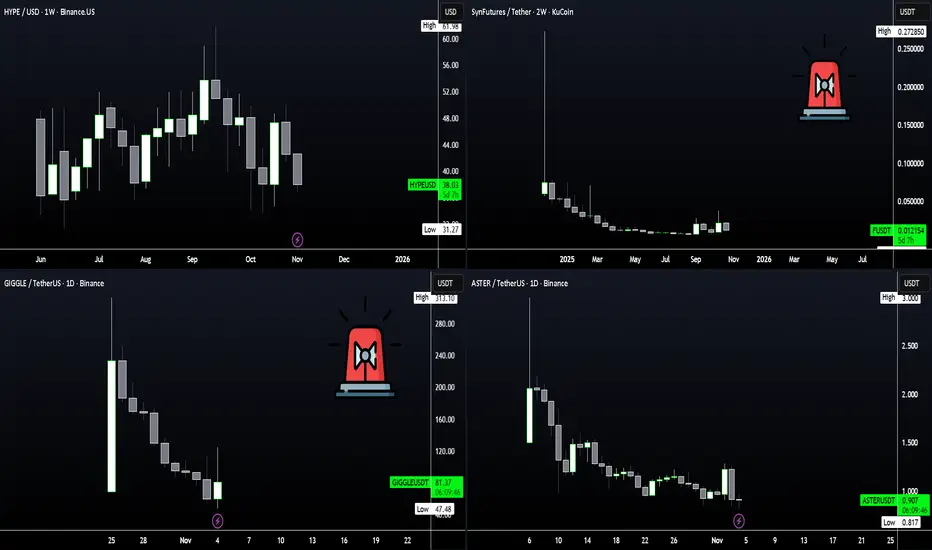
How To Trade NEW ALTS - SECRET PATTERN !!New Alts - a Pattern
Newly released alts all seem to follow the same pattern, at least for the first few weeks. From the frontpage chart, you'll notice a very interesting "fractal" if we can call it that.
It goes something like this:
🚀 Opening Candle 💥 Top Out 👇 Hard Drop ❕ Re-enters opening price or goes under 🔁 Bottoms out (HERE IS WHERE YOU BUY) 🚀 Higher Highs follow.
With this said, it seems evident that you should WAIT to buy a coin that has just been released on the exchange. Although you could try to jump in to the moving train, the risk is simply too high if you do not already have a position.
ALTS that have already retraced, bottomed out and establishing higher lows. These alts you could easily preset TP targets from 15% onwards, depending on your risk appetite.
📈HERE are some examples:
JTO, almost there:
RVF, full retracement and beyond (This could be a warning sign as a liquidity drain)
RAY, clear bottom, full retracement, approaching re-accumulation zone:
ADA, full retracement, hard bounce, approaching key re-accumulation zone:
ALWAYS remember to take caution in the volatile world of crypto with a SL and reasonable targets. Remember that trading newly released alts and memecoins greatly increase the risk on top of the existing risk of crypto.
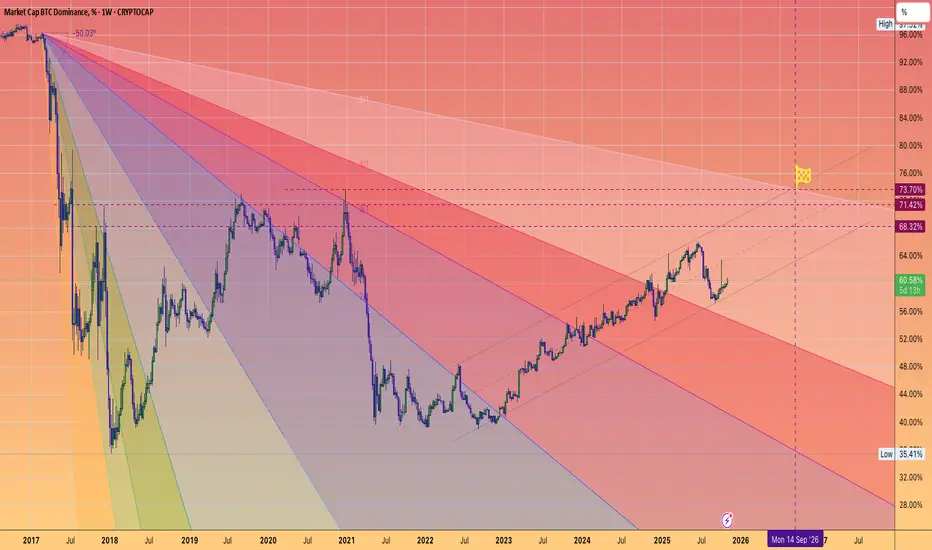
BTC.D May not TOP until next September!Despite alt/BTC pairs looking battered
**Capitulation is likely not complete**
Most Altcoins remain in downtrends v BTC
Timeline:
2025: grind to 63-65%
2026 Final Push to 73%?
Altcoins to seek relief once this finally turns around.
You may be able to start DCA'ing BTC as early as next March in preparation to buy beaten down quality Alts...
focusing on ETH, SOL, and 2's that have usage... not simply clogging up the landscape of empty chains.
LTC - GREAT Potential : ALT for 2026Hello Traders 📈
LTC / Litecoin may still present great opportunities for 2026.
From a bigger perspective, it may seem like LTC doesn't move much. But if we zoom in, we see massive bounces over the course of 3-4 weeks which presents big opportunities if you can buy in low:
From a technical indicator perspective, in the 4h LTC is still trading UNDER< showing that bears are still in control:
In the daily, we still see the same story however there seems to be a bullish W pattern appearing. As soon as the price reclaims the MA in the DAILY timeframe , that would be the first positive indicator of more upside:
For the short term, we need to see LTC trade ABOVE ALL the 4h moving averages in order to begin anticipating a bigger move up.

ALTUSDT Forming Bullish WaveALTUSDT is currently forming a bullish wavering wedge pattern, which is often seen as a strong reversal signal indicating potential upward momentum. The pattern highlights a period of consolidation where the price narrows between converging trendlines before breaking out with significant force. In ALTUSDT’s case, the consistent volume and healthy market activity support the likelihood of a breakout to the upside, aligning with the projected gain of 190% to 200%. Traders are closely watching this setup as it combines strong technical signals with rising investor enthusiasm.
The bullish wavering wedge pattern typically emerges when a market is preparing for a powerful move after an extended correction phase. For ALTUSDT, this pattern suggests that sellers are losing strength while buyers are gradually taking control. The consistent volume flow adds confidence that a breakout could lead to a substantial rally once key resistance levels are breached. This setup has historically provided high-probability trading opportunities in trending markets, especially when accompanied by growing investor attention.
The current technical outlook on ALTUSDT reflects strong accumulation, improving momentum, and renewed optimism across the broader crypto market. If the breakout confirms with strong candle closes and follow-through buying, the pair could experience a significant surge in price action. This aligns with the bullish sentiment seen in other major altcoins, reinforcing ALTUSDT’s potential for exponential growth in the upcoming sessions.
✅ Show your support by hitting the like button and
✅ Leaving a comment below! (What is You opinion about this Coin)
Your feedback and engagement keep me inspired to share more insightful market analysis with you!

BTC DominanceBitcoin Dominance gives up 1 year after each halving. You should accumulate altcoin as long as Bitcoin dominance is above 50%.

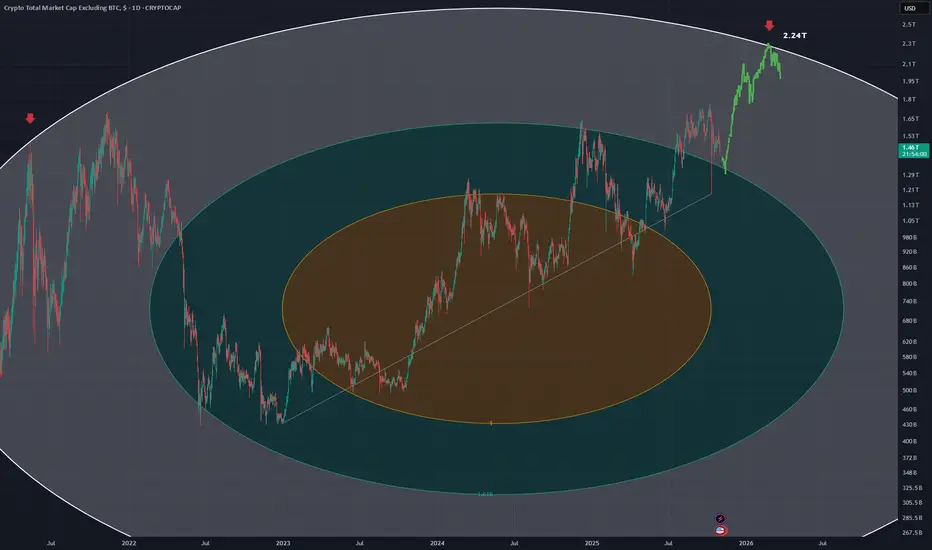
TOTAL2 - Fib CircleUsing a fib circle with a trend from the start of the current bullrun
Looking for another top along 2.618 which can be seen to be a previous top for the last bull run in may 2021 (red down arrows)
Still a fair amount of room to move up for alt coins
This is the daily chart for TOTAL2
AIA --> +30% UP!! Nothing magic, just pure trading skillls based on year"s of experience, losses & win! 🔥
NASDAQ:AIA +30% up - setup was just insane! TP4✅

Total3 \ Altcoins On the Total3 chart, the price is trapped within the 3.8-year-old major resistance and uptrend range, which hasn't been surpassed even during the recent rally.
price is holding strongly above the 4.2-year uptrend support and the 21EMA.
Even the recent downtrend wave failed to break this structure, on the contrary, it confirmed the trend.

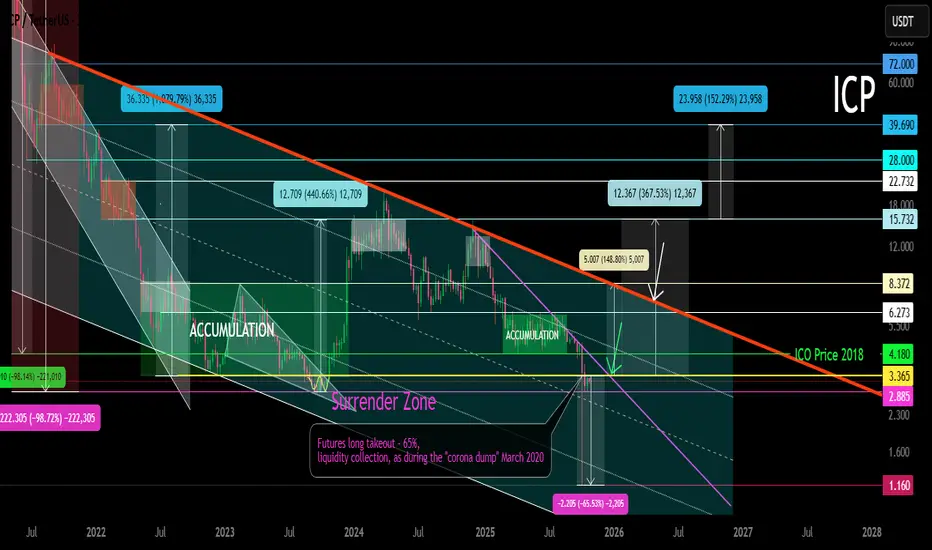
ICP Main Trend 10 2025Logarithm. Timeframe: 1 week. I'm updating my previous trading idea for the primary and secondary trends (it achieved its goals with pinpoint accuracy), published 2.5 years ago.
A patient and consistent person will be rewarded, while a restless person will not.
Locally, this reversal zone is after a futures long takeout:
Low-liquidity instruments and huge leverage (targeted by the main information traffic of "easy money" lures) are incompatible... logically... But, it's profitable for exchanges to create such futures trading instruments, as people will leave their money there. There's no real supply or demand, and exchange algorithms completely control the price (volatility), which is why "traders" are doomed.
That's why we've recently seen cascading collapses in futures liquidity and mass liquidations, which have been reflected in the spot market. Spike prices on many instruments reached -40-80%, practically in a completely empty order book.
It's quite easy to direct the price to such a massive liquidation up or down on a large exchange by manipulating the entire trading volume, given low supply and demand. However, this is impossible (considered blatant manipulation) on a single instrument, and there will be many questions and lawsuits. But if this is done on hundreds of cryptocurrencies simultaneously and across all exchanges, under a correspondingly negative news backdrop, everything is fine; it's the market and the negative news.