SOL at resistance, has work to doCRYPTOCAP:SOL is at major resistance High Volume Node just below the daily pivot.
The local trend has flipped bullish but a strong move may not be on the cards until we climb the wall of worry through resistance. Price is riding the daily 200EMA.
Daily RSI did not print bullish divergence or reach oversold.
Safe trading
ALTS

ONDO beaten down, resistance aheadLSE:ONDO has work to do but I am a forward looking narrative trader and believe we have a major RWA (Real World Asset tokenisation) narrative ahead to pump these coins.
Ahead lies High Volume Node resistance, previous channel lower boundary, descending daily 200EMA and the daily pivot to overcome... not easy but this is crypto and can be all taken out in 5 seconds.
Price terminated with a front run of the golden pocket showing strength over other alts.
Daily RSI hit oversold, no divergence
Safe trading
HBAR Heavy resistance aheadCRYPTOCAP:HBAR is about to hit resistance - daily 200EMA and S1 pivot, but has re-entered the channel after a deep swing below with daily RSI hitting oversold.
I am expecting price to climb the wall of worry generated by all the fear from the Friday flash crash + macro-economic environment and 'cycle top' narrative that is all driving market FEAR
WaveC of 2 completed at the golden pocket Fibonacci retracement.
Safe trading

ETH back above resistanceCRYPTOCAP:ETH megaphone channel is being respected as we approach the upper boundary after overcoming resistance High Volume Node now support.
The daily pivot will also proof tough to overcome and there should be no clean breakout to all time high as we climb the wall of worry from all of the cycle top nonsense... FEAR
Price tested the daily 200EMA as support, normal behaviour and printed bullish divergence from oversold W to Y.
Safe trading

BNB respecting the trend-lineCRYPTOCAP:BNB tested the lower boundary support line and caught a bid flipping bullish market structure.
Daily RSI printed bullish divergence from the EQ where price continues to find a bottom
Even during the flash crash price only tested the 0.382 Fibonacci retracement demonstrating the power of the macro uptrend and token reliability
Analysis is only invalidated below the trend-line. Elliot wave count is particularly difficult on BNB but it appears a macro wave 5 is underway which can extend for months.
Safe trading

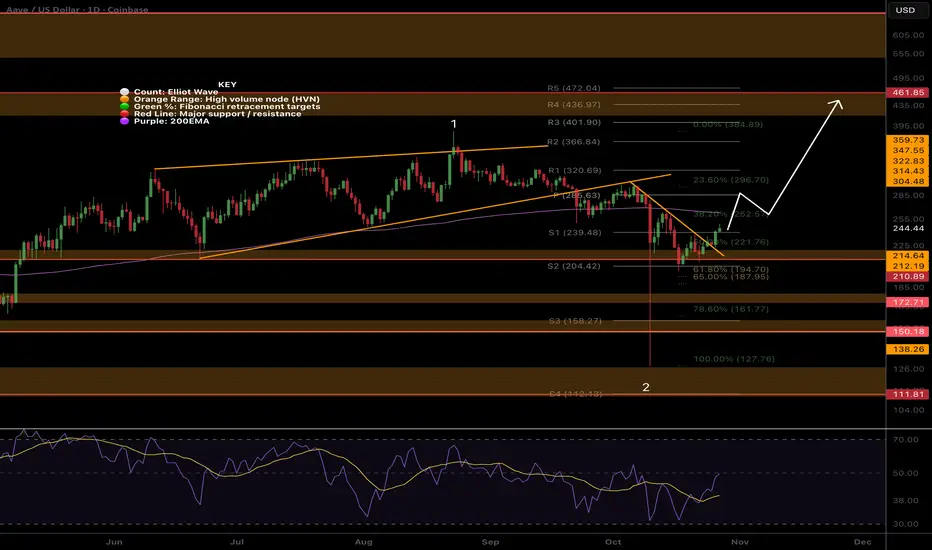
AAVE Bullish structure from supportEURONEXT:AAVE has printed bullish structure from support but the daily 200EMA looms ahead, once cracked AAVe should move well. Price tested the golden pocket Fibonacci retracement.
AAVE did not pullback as much as most alt-coins and is expected to be one of the first to break into all time high / price discovery. First target is $460 High Volume Node.
Daily RSI almost hit oversold twice in what looks like a double bottom
Analysis is invalidated if we drop below $187
Safe trading
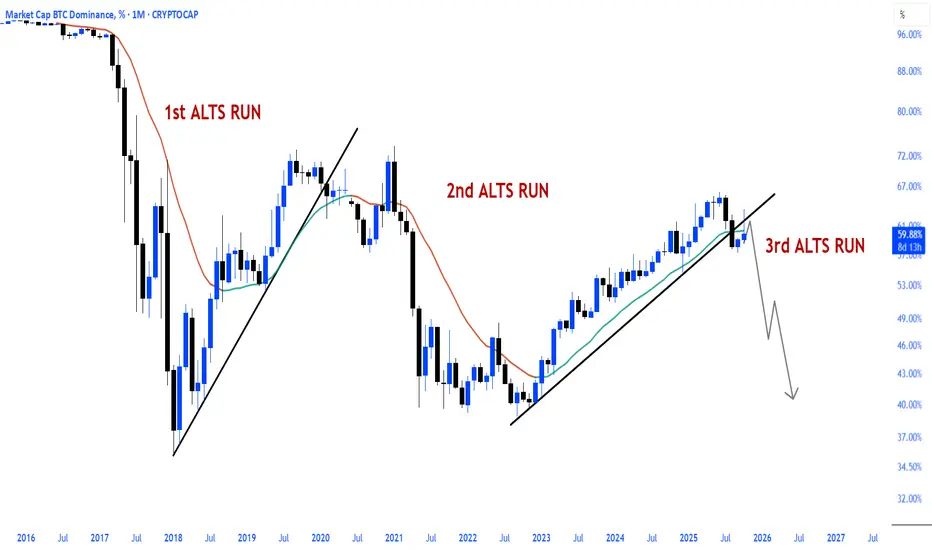
Others \ Altcoins Cycles 1st and 2nd... Channel movement starting from the bottom → Parabolic breakout.
Today? We're in the lower band of the 3rd cycle.
Momentum is at historic lows in HTF...
Expansion waves haven't even fully begun for Alts yet.

KGEN - LEVEL BY LEVEL - UDPATE:SET:KGEN - update:
Big resistance hit ⚠️ - 0.3580 - 0.3600$.
Possible scenario i'm watching:
Pull back toward 0.2850 - 0.2900$; then leg up toward 0.420$+ 📈
Momentum might remain strong above trend + possible (curve line).
Remember:
70% up from previous call, so don't be greedy!✅💰
Level by level team! 🐸

Total2 \ AltcoinsTotal2 HTF is also forming a strong reversal pattern.
The fall trend breakout and retracement process have been completed, with the price holding steady above MA21 and the uptrend.
The 2021 ATH region has still not been breached, but the current structure is at the beginning of a new expansion phase.

$BTC.D down $BTC up : ALTS run.CRYPTOCAP:BTC.D down CRYPTOCAP:BTC up : ALTS run.
Bitcoin dominance has broken down from its major uptrend and is currently in a retest.
It's important to remember that dominance alone isn't an altseason indicator; the key is for dominance to decline alongside Bitcoin's rise.
When this scenario plays out, a healthy altcoin season, as seen in the past, will resume.
So why did Altseason start in 2017 when BTC was falling?
1. Capital Rotation from Bitcoin to Altcoins
When Bitcoin approached $20,000 at the end of 2017, investors fell into the mindset that "BTC has risen too much, altcoins are cheaper."
Those who realized their profits sold Bitcoin and moved to altcoins.
So money didn't leave the market — it just changed direction within it.
That's why altcoins soared even as BTC fell.
2. New investor influx and FOMO
New investors entering crypto at that time turned to coins like Ethereum, Ripple, IOTA, ADA, and NEO, saying "Bitcoin is expensive."
New money flowed directly into altcoins.
So even as Bitcoin fell, the total market value continued to grow.
3. The historic collapse of dominance
BTC dominance fell from 65% in December 2017 to 35% in January 2018.
This was the sharpest "altcoin rotation" in history.
In short, everyone was "dumping their BTC profits into altcoins."
4. The ICO boom
Thousands of new projects were issuing ERC-20 tokens.
Demand for Ethereum skyrocketed because everyone was participating in ICOs with ETH.
This accelerated the shift from BTC to ETH and ignited the altcoin bull run.
5. Liquidity staying in the market
The stablecoin ecosystem was not yet developed (USDT was limited).
So when investors wanted to take profits, they were fleeing to altcoins instead of cashing out to fiat.
This caused altcoins to shine.
ZECUSD - Oh no are we in bear market since 2 weeks ? want to finish on a good working idea before stoping publishing hehe
this double bottom formation has been seen too much time lately
I entered now
SL : 340 for now, will update lower at 310 when white trendline broke down
Also depends on BTC reaction but i think daddy is going to see 100k or sub 100k first before going a bit up (last rejection made me switch bear for some days)
first TP : 155
second TP : 60/70
Cheers not advice

AIA - BOTTOM IN?Bottom can be in on NASDAQ:AIA ; I'm taking my chance here around 1.150$ ✅📈
If we fall more, then —> 1.00 - 0.980🎯
Volatile & likely manipulated asset.
High risk reward setup, #DYOR.

MLN - BULL REACTION AWAITEDCBOE:MLN , as long as price hold above 8.20$ I'll do DCA. Expecting to see another big bull reaction 📈

MEMECORE/USDT — Range Recovery Forming, Watching Higher levelsMEMECORE has shown a steady rebound from the lower range near $2.00, regaining short-term momentum as it attempts to reclaim the $2.34 zone, which has acted as a strong resistance multiple times.
A confirmed breakout above $2.34 would signal a shift in momentum and open the path toward the range high at $2.53, where the next major liquidity zone sits.
📊 Technical Overview:
Range Support: $2.00
Range Resistance: $2.34
Breakout Target: $2.53
Bias: Neutral → Bullish above $2.34
If MEMECORE continues to hold above the $2.00 base with rising volume, the structure suggests potential for a range breakout and short-term trend reversal.
📈 Outlook: Building strength inside range
🎯 Targets: $2.34 → $2.53

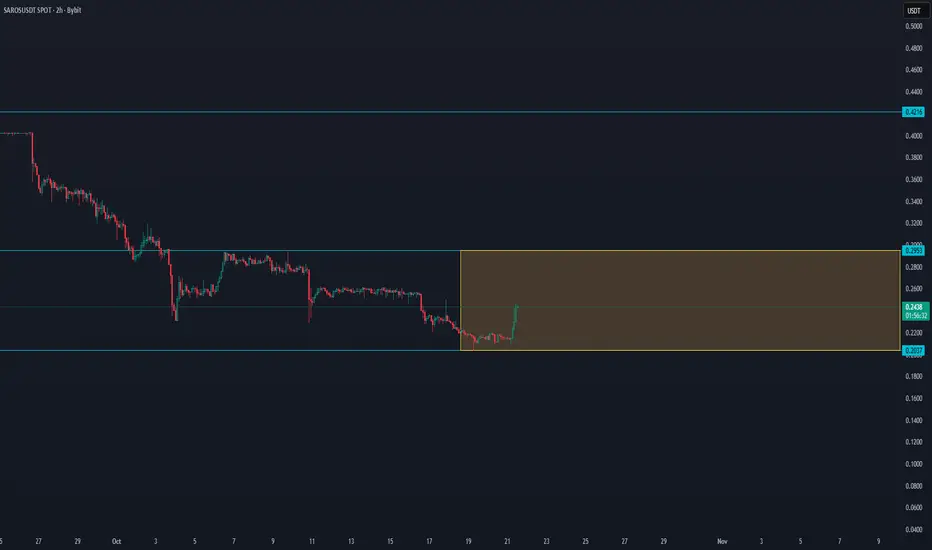
SAROS/USDT — Range Reversal Forming, Eyeing Breakout Toward $0.3SAROS/USDT — Range Reversal Forming, Eyeing Breakout Toward $0.30 🚀
SAROS is showing a strong early rebound after testing its range low at $0.203. The price has now reclaimed the mid-range zone near $0.24, indicating buying pressure returning and a potential shift in short-term momentum.
The key resistance and confirmation area is found near $0.295 — a breakout above this level could signal the start of a trend reversal, with further upside potential toward $0.42 if volume confirms.
📊 Technical Overview:
Range Low Support: $0.203
Range High / Breakout Zone: $0.295
Extended Target: $0.421
Bias: Accumulation → Bullish shift once $0.295 breaks
If SAROS maintains this momentum and reclaims the upper range, the structure suggests a strong continuation setup forming for the next leg higher.
📈 Outlook: Building strength inside the range
🎯 Targets: $0.295 → $0.42
BAS - BULLISH SETUP XETR:BAS - Bottom is probably in!
Bull reversal incoming? 📈
Key support hitted ✅
Clean bull DIV RSI & trend breakout ✅
We are likely gonna see a bull correction 📈
Setup & more data in my charts. #DYOR before investing!

The foundations of the next Altseason are quietly being built. OTHERS / BTC ratio one of the most important indicators for altcoins market strength has just touched the bottom of its falling wedge structure after a major drop, exactly 1743 days since the last similar event.
This point coincides precisely with December 2020, the starting zone of the previous major altcoin bull run.
The current setup mirrors that historical structure strikingly.
Historically, such levels have marked the early phases of massive altcoin rallies.

XRP Wave (2) CompleteCRYPTOCAP:XRP wave (2) appears complete after last Fridays flash crash at the 0.382 Fibonacci retracement and weekly pivot point.
RSI is crossed bearish and has room to fall into oversold with no bullish divergence. Bearish divergence marked the short-term top.
Price is expected to dip into the wick before moving up in wave 3 into price discovery with an initial target of $5.7
It should still be noted that XRPs move up was from a multiyear triangle which is a terminal pattern. Prices are expected to hit the bottom of the triangle at $0.3 but take this with a pinch of salt.
Safe trading

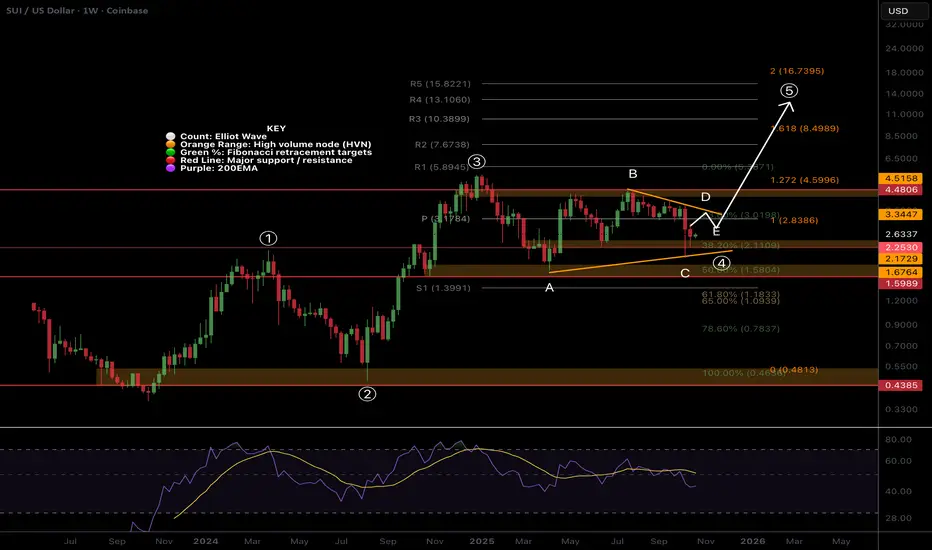
SUI Triangle macro outlookCRYPTOCAP:SUI structure, after a failed all time high, now appears to be a macro triangle in wave (4), also characterised by the long drawn out range. Wave D is underway to the triangle upper boundary with wave E expected to complete around the weekly pivot point, $3.17.
Wave (5) has a minimum target of the R5 weekly pivot at $15.8, at the 2 Fibonacci extension.
Falling below $1.7, wave A, invalidates the analysis and suggests we have much lower to go in a bear market.
Weekly RSI is bearish with lower to go but hidden bullish divergence has formed, a good raly will confirm.
SUI i holding up better than most with shallower retracements overall.
Safe trading
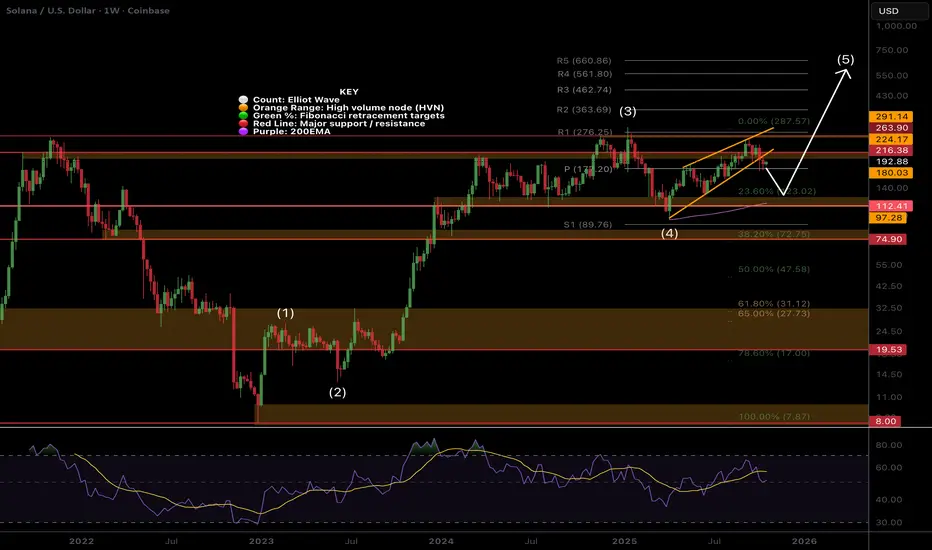
SOL Waiting at the weekly pivot...CRYPTOCAP:SOL has fallen out of the wedge, an interior wave 5 completion structure, which suggests we should see a broader sell off to the next High Volume Node in interior wave 2, $120. It is concerning no new high was made and backs up a deeper correction. This would also meet the ascending the weekly 200EMA.
Weekly RSi is crossed bearish but price remains above the weekly pivot and EMA which is bullish. Direction is ambiguous for now. A push back into the wedge would flip the outlook bullish.
Wave 5 target remains $600 at the R5 weekly pivot.
Safe trading
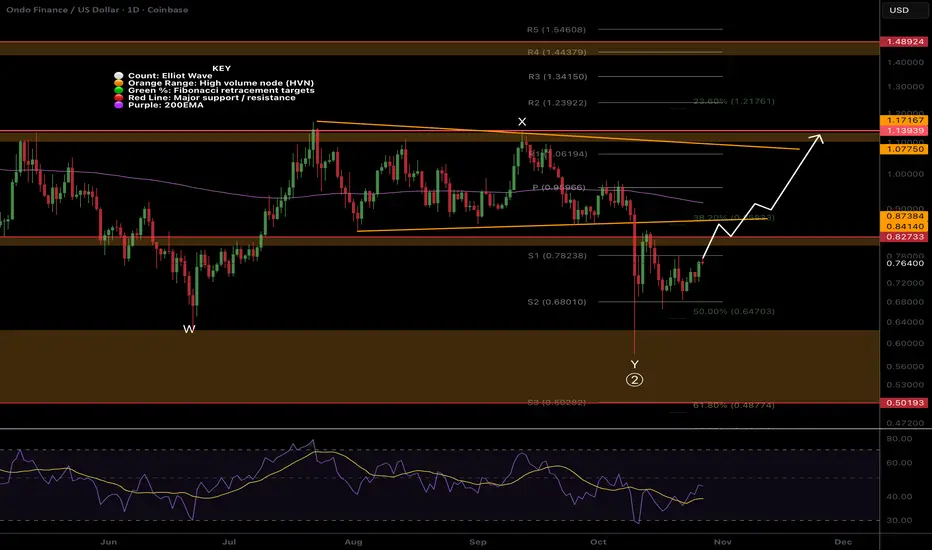
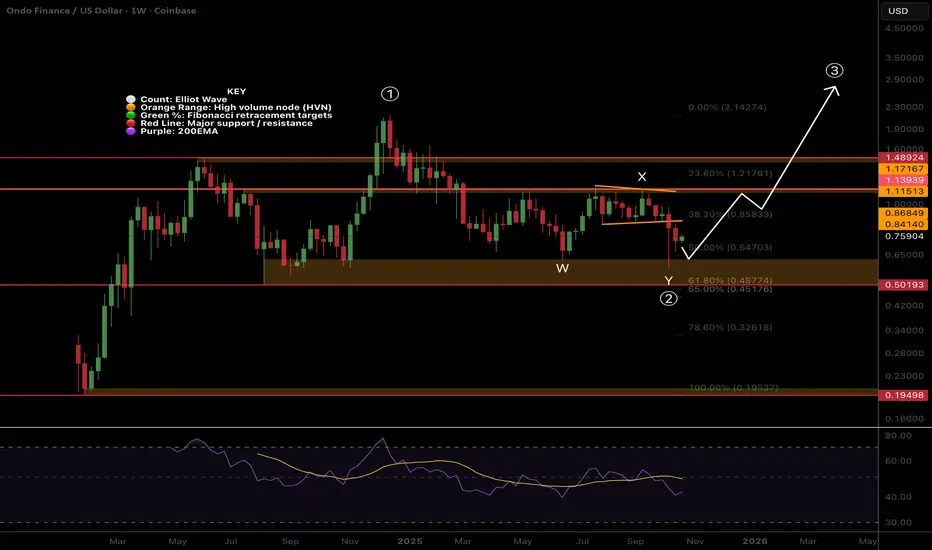
$ONDO wave (2) Bottomed?LSE:ONDO appears to have completed wave 2 with WXY complex correction ending at the major High Volume Node support just above the golden pocket.
Weekly RSi has printed bullish divergence but is not yet confirmed. A dip into the wick and High Volume Node is to be expected before high but may not get there.
Wave (3) has an initial target of the R2 weekly pivot at $3.18, a strong move from here. $1.22 weekly pivot and High Volume Node will put up a fight.
Safe trading
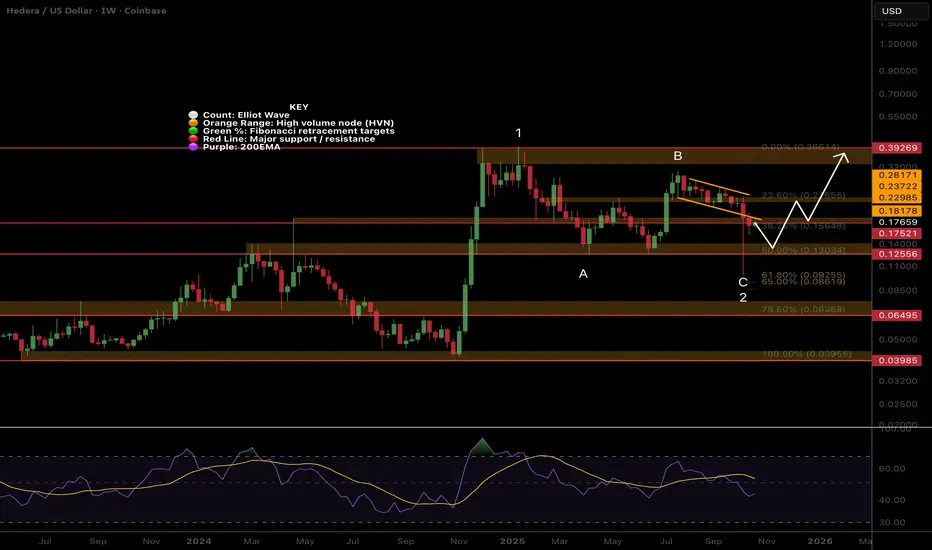
HBAR Wave 2 complete, but more downside firstCRYPTOCAP:HBAR wave 2 looks complete at the golden pocket and High Volume Node support after printing an ABC down. A deeper visit into the wick left behind is likely before we continue up in wave 3. Testing the 0.5 Fib and High Volume Node is where I am looking for a long.
Weekly RSI has bullish divergence, a good sign, but plenty of room to fall until oversold. Price is currently at major resistance of the channel lower boundary and High Volume Node.
A strong upside move has a target of the all time High Volume Node. Targets of $1+ are still on the cards.
Safe trading
FET Macro flipped long term bearish! Done and dusted?NYSE:FET has disappointed many and continues to be dumped hard. We can see 3 waves up from the very bottom as an ABC followed by a 5 wave structure down that's nearly complete, as weekly RSI hits oversold. No bullish divergence.
The wave 5 structure down resembles a motif wave which means any bullish moves are now corrective and we won't likely see all time highs again but we can still make decent profit.
Once a bottom is found, price should return to $0.6, at least, as counter trend rally / reversion to mean where it may find heavy selling.
Price needs to break $0.84 and find a higher low to flip the structure bullish again, a tough challenge.
Downside 'alt-coin golden pocket' Fibonacci, 0.786 has not been reached yet and is the highest probability area for alts to bottom, $0.13.
Safe trading
