DOA trading Strategy - AMC#AMC - Green DOA sniper and meter are holding strong
We have a gap to fill all the way to $44 then potential break on this pennant soon
AMC

AMC Mother Of All Short Squeezes, APES! (MOASS)Wow, what a ride it's been so far, huh? What an incredible time to be alive. It seems as if we are at the cusp of a truly once-in-a-lifetime tectonic-shifting economic event that will probably be studied and talked about for decades, if not centuries to come. What will the headlines/history books say about the planet of the apes? Will the memes be immortalized forever? What I see is the most massive bull flag I have ever seen in my 3 years of trading/watching the market and not only did we breakout to the upside, we backtested for support and it held. The chart only really makes sense if you look at it on a logarithmic scale because of the very long time frame/insanely high year-to-date percentage gain. The red line has been an EXTREMELY strong resistance trendline dating back to Oct. 13th, 2020, and has only broken to the upside TWICE, once on Jan. 27th when we ran to $20 and the second time on May 27th leading up to the run-up of $72. The blue line has been an EXTREMELY strong support trendline dating back to January 1st, 2021, everytime it gets tested and holds, it leads to a bull run and it has only been tested 3 times ever. The golden line has been a VERY strong resistance/support trendline dating back to March 13th, 2020. As you can see from the chart we just backtested the red trendline for support and we got it, this is the first time this has happened. Let me reiterate, the strongest logarithmic resistance trendline has turned into support. THIS IS INSANELY BULLISH. Anyone else excited for tomorrow?? I know I'm not, all I do is HODL anyways. Wake me up when $801,000. I have been adding to my position at every opportunity and have not sold a single share since I opened my xxx position. Not financial advice. Also, I don't have enough karma to post Reddit, would someone please share? It means the world to me, thanks, everyone! Cheers to the MOASS!!

AMC to 100 Dollars If AMC breaks to the upside first target could easily be 100 dollars before we get some sort of sell off. Alot of reaction points at the bottom of this triangle , showing real strength a break is near and with the 2D MACD bullish cross its looking like we could break to the upside.
Fib Time Zone Date - 26th Oct 2021

Break this triangle and head up?This is my analysis shown above. If break out of this upward flag we look to head up to around the 44’s.

AMC HOLDINGS - DAILY CHART - BULL FLAG BREAKOUT Amc holding - Daily chart - Now I am not the one to buy meme or hype stocks infact I would rather do the opposite and sell the hype but in the case of AMC holdings I can't help but notice these beautiful bullish patterns on signs of new demand on charts so Im expecting a explosive bullish continuation on this possibly even higher then the all time highs.

AMC my target price.I will not sell my positions until i get confirmation on my EMA positions. We are still very far from a squeeze, as we near closer we will see a major MA convergence . We did reject the macro MA in the chart, and in possibility we will follow an ABC correction back to 38$.
My target price however for this still stands @ 300$

AMC's 3rd Squeeze PredictionAMC has been prepping for it's next squeeze for almost 5 months now. Short Interests is at all time highs meaning shorts have not covered and the technicals show bullish momentum starting to build up once again.
Some indicators that suggest the next squeeze is starting.. low volatility, low volume (increasing now), high short interest, pennant close to breaking out, and previous trend analysis.
My price target is taken from AMC's Speed Trendline & Fib Retracement levels which suggest the next squeeze will peak end of November at around the $150 area
Low/High Weekly Price Targets:
October 22 - $38/$48
October 29 - $42/$62
November 5 - $52/$80
November 12 - $73/$88
November 19 - $87/$104
November 26 - $96/$150

Crypto vs GME/AMC vs Evergrande in the Last 3 MonthsA 3 month chart of the returns as a side-by-side comparison. That red line slowly sinking into nothingness is Evergrande, the lines in the middle are GameStop, AMC, and a random ETF I found on the real-estate market here in the US.
How the Evergrande crash will affect the US markets is yet to be seen (it'll probably take at least a business cycle or 2 before the effects of it show up here) but we do know that it will be negative, potentially recession-inducing.
As you can see, as the real-estate market dips, crypto is actually doing better, not worse. People liquidating their assets in China may have lead to the runs that we see today -- and right now where the interest rates of banks are low, crypto is the only asset that makes any sense if you want any sort of reliable return.
If this trend continues, we could see a jump in crypto prices like never seen before. Crypto is also what you call a "inflation friendly" asset because it's not beholden to supply chain issues like other assets are so it's more likely to adapt to economic conditions much faster -- at the very least, it will be affected differently.
But the important thing to pay attention to for the #crypto folks is how this is talked about in public -- if you notice, about a month ago crypto and #blockchain markets have taken a slight hit -- but the media around then started publishing articles how Bitcoin and Ethereum was "tanking" along with the real-estate market, due to Evergrade scares. This is what's called "cherry picking" your data set, since the overall trends show that the two things obviously don't correlate.
Don't get caught up in other people's problems, other people's fears, in other words. Misery loves company, after all. Crypto is in for some good times ahead, I'm pretty sure of it now.

AMC accurate playout structure!?!I expect to see the gap down going into Monday to 37.5~37.8$.
But the (yellow) line is my prediction on the macro scale of this bull run.
I dont expect a breakout. not yet atleast.
However I do expect a rally to maybe 50$ where it will be met with heavy resistance, pushing the price back down.
In the micro sense, i do expect the chart to follow an ABC elliot correction wave, to meet the breakout confirmation point, fueling us to the moon.
Follow and like for updates

AMC breakout has begun. Time to apewould wait for the friday daily candle to close. would like to see a close above 41.13 for bulish momentum to start


AMC - Price OutlookLooks like we have a Mini-Breakout here finally, setting up an IHS on the 4 hour/ daily, MACD crossed up with momentum continuing and RSI 50 line trend being crossed above as well.
Looking for some price consolidation from here tomorrow and a bounce off the RSI trend line to let the STOCH cool down a bit. All in all looks like a nice entry should show up tomorrow for a continued run into next week.
...I'm Buying More

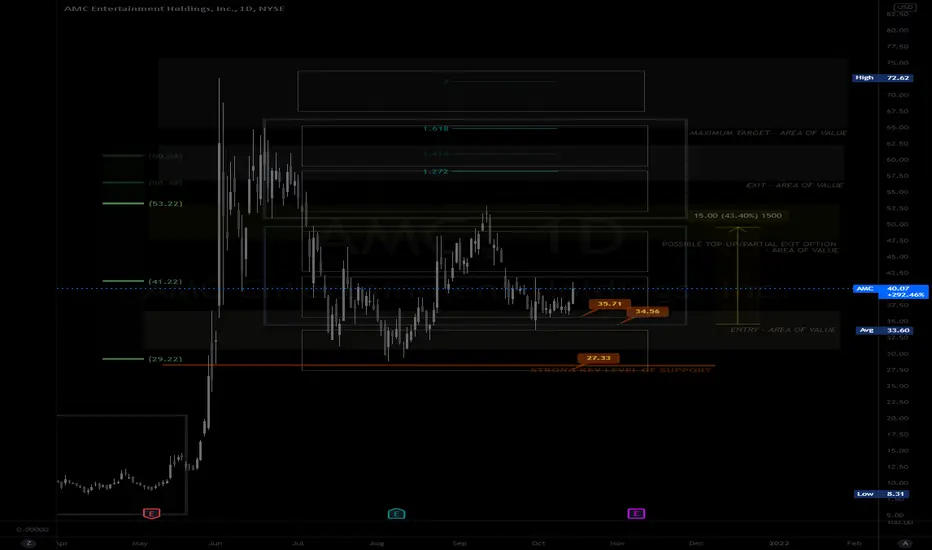
MY MINIMALIST ANALYSIS FOR $AMC10.15.21 1150H +8 SINGAPORE
ALERT: GOOD ENTRY
HOW TO USE MY CHART
It is designed for SWING TRADES at the BOTTOM. I do not SHORT, though, you can still use it.
Created on a WEEKLY & DAILY Analysis of Dynamics of the Market.
LARGE BOXES are major pivots that will occur, while the small boxes are MINOR PIVOTS. These can be entries to a BUY/ SELL POSITION or an EXIT/PARTIAL EXIT/TOP-UP AREAS.
Watch out for Chart Patterns, Candlestick Math, Market Dynamics, and your Fibs.
This CHART is best used without indicators.
Price action, candlestick /bars, and FIBS alone will be sufficient as a major deciding factor for this MINIMALIST CHART.
Disclaimer:
The findings/predictions of the following analysis are the sole opinions of the publisher of this idea and must not be taken as investment advice.
Thank You for your appreciation and support (fFollows, Comments and Likes.)
Looks like AMC is a DO! Bulls back on the menu lads!looks like AMC did an explosive move upwards breaking back above the trendline. We will wait for a minor correction @ 38$ or so to buy back in.
not financial advice.
follow and like for more content
AMC to the moon people
#AMC200
lfg

AMC Weekly #2I entered 15 Oct 21 36 $0.95. It consolidated this week. I'm expecting the same or slightly bearish move next week.

$AMC VIOLENT BREAKOUT INCOMINGamc is looking to breakout to the upside, once it reaches $44+ it could very likely breakout massively to the upside

$NAUT next to run, $AMZN invested in them$NAUT undervalued and ALOT of insider and institutional buying past 2 weeks at $7+ discounted right now and $AMZN invested

AMC Looking Bullish AGAIN ( analysis prediction)If you have been following AMC , you know this is not a fundamental play.
My analysis is based on few factors.
I first placed a fib chart to help display the key levels we should be looking at. The bounce off the $36 support is clear confirmation AMC has begun to turn back around after the previous pullback.
At $38 we see the candle wick form a new resistance.
Also the RSI levels continue to show strong bullish momentum. This is a good sign if the volume can hold for the bulls. My price prediction for the next couple of weeks is $40-$45 range.
I would wait for options until price can hold new levels. Shares are much safe to hold even at $38 still a great entry point.

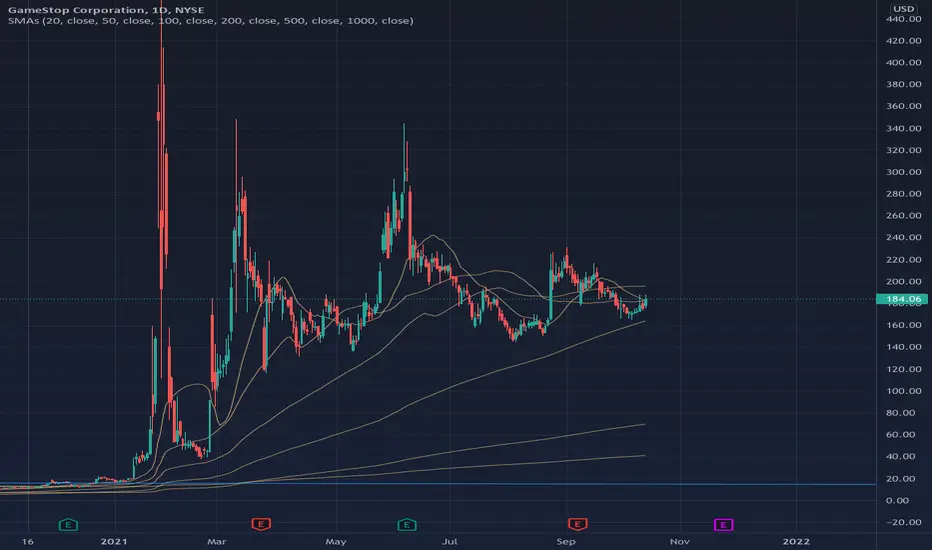
$GME: "Weaponized Commodity Markets" Could Mean Another SqueezeAs crude oil sits in a very vulnerable position, Putin has come out declaring it could head to $100 and while China contemplates the scale of a potential Evergrande bailout, there's a serious potential risk here that the inflation trade will continue thus leading to another squeeze out of GME which has been an efficient barometer for inflation since it's grand squeeze in January. However, it isn't just the movement of liquidity that could benefit the prospects of GME. If sky-high gas prices are here to stay, another stay-at-home windfall could push GME back into the 200 pivot or even beyond as reopening vacation plans get shelved.


$AMC WILL PUSH BACK ABOVE $50 THIS WEEKThe Numbers ARENT REAL, WE HODL REGARDLESS.. But In the short term this Dip will RIP and follow YELLOW TREND LINE to push back above $38. THEY ARE TRYING TO TO KEEP IT BELOW $40 BUT WE WILL BREAK $50 THIS WEEK!
