AMD Short Swing 1H Conservative CounterTrend TradeConservative CounterTrend Trade
+ short impulse
+ SOS level
+ resistance zone
+ 1/2 correction
- strong approach
+ exhaustion volume Ut?
- incomplete test
+ above Ut close entry
Calculated affordable stop loss
1 to 2 R/R take profit within 1H range
1D CT
"- long impulse
+ volumed TE / T1
+ resistance zone
- strong approach
+ volumed no result breaking bar"
1M CT
"- long impulse
+ volumed T1
+ resistance zone
+ weak approach
+ exhaustion volume 2Ut-
+ weak test"
1Y CT
"- long impulse
- unvolumed T1 level
+ resistance zone
= unvolumed manipulation bar without result"
AMD

XRPUSDT M15 Liquidity Sweep and Corrective Bullish Setup📝 Description
XRP swept short-term sell-side liquidity on M15 and is now stabilizing above the local demand zone. The current move appears corrective after the sell-off, suggesting a potential bullish reaction toward nearby imbalance levels.
________________________________________
📈 Signal / Analysis
Primary Bias: Bullish while price holds above the M15 liquidity sweep low
Preferred Setup:
• Entry: 2.063
• Stop Loss: Below 2.057
• TP1: 2.074
• TP2: 2.082
• TP3: 2.088 (M30 FVG / descending trendline reaction)
________________________________________
🎯 ICT & SMC Notes
• Clear sell-side liquidity sweep on M15
• Price holding above local demand confirms reaction potential
• Upside targets aligned with unfilled FVG levels
________________________________________
🧩 Summary
As long as price remains above the swept liquidity low, XRP is positioned for a corrective bullish move toward higher PD arrays.
________________________________________
🌍 Fundamental Notes / Sentiment
No immediate negative catalyst affecting XRP sentiment. In a neutral crypto environment, short-term liquidity-driven rebounds remain technically supported.
________________________________________
⚠️ Risk Disclosure
Trading involves substantial risk and may result in capital loss. This analysis is for educational purposes only and does not constitute financial advice. Always apply proper risk management, predefined stop-loss levels, and disciplined position sizing aligned with your trading plan.

Direxion Semiconductor 3x Bull | SOXL | Long at $30.00So many semiconductor companies... which one to choose? Enter AMEX:SOXL - not for the faint of heart. Losses and gains triple compared to most semiconductor ETFs, so stay away if high-risk plays aren't your thing. The top three holdings are NASDAQ:AMD , NASDAQ:AVGO , and NASDAQ:NVDA - two of which are at all-time highs...
I wouldn't be shocked if AMEX:SOXL enters the low $20's to test the base of my historical simple moving average area, but I don't think we are done hearing about AI and the semi demand. There are large gaps to fill above and below the current price and we are at the 50/50 stage (i.e. historical simple moving average zone) for a price move up or down.
My bet is up, especially with the new presidential administration. If politicians start dumping semis, I'm out. Thus, at $30.00 AMEX:SOXL is in a personal buy zone.
Target #1 = $35
Target #2 = $40
Target #3 = $50
Target #4 = $60

SUI H4 AMD Distribution Phase, Expecting Sell-Off Toward H4 FVGs📝 Description
SUI on H4 has completed a clear AMD cycle. After a prolonged Accumulation, price expanded into Manipulation and is now trading inside the Distribution phase. Recent price behavior shows weak follow-through on the upside, signaling exhaustion rather than continuation.
________________________________________
📈 Analysis (Scenario-Based | Non-Signal)
With the market now firmly in Phase 3 (Distribution), downside probability increases.
• Failed upside continuation confirms distribution behavior
• Price rejection inside the range suggests smart money offloading
• Draw-on-price shifts toward unfilled H4 FVGs below
As long as price remains capped below the distribution high, any short-term bounce is viewed as corrective, favoring continuation lower.
________________________________________
🎯 ICT & SMC Notes
• Complete AMD structure confirmed
• Distribution phase active
• H4 FVGs below acting as downside magnets
________________________________________
🧩 Summary
SUI has transitioned into the Distribution phase of AMD, which historically precedes downside expansion. With no structural bullish confirmation, the higher-probability path favors a rotation lower toward H4 FVGs, aligning with smart-money distribution rather than accumulation.
________________________________________
🌍 Fundamental Notes / Sentiment
SUI remains risk-sensitive. With no fresh bullish catalyst and fading crypto liquidity, conditions favor the Distribution phase and a move toward lower H4 FVGs rather than continuation higher.
________________________________________
⚠️ Risk Disclosure
Trading involves substantial risk and may result in capital loss. This analysis is for educational purposes only and does not constitute financial advice. Always apply proper risk management, predefined stop-loss levels, and disciplined position sizing aligned with your trading plan.

AMD Pullback Complete? Momentum Signals Say Watch Closely🚀 AMD – NASDAQ | Market Profit Playbook (Swing Trade)
🎯 Bullish Layered Entry Setup + Macro Factors
📌 Asset: Advanced Micro Devices, Inc. (Ticker: NASDAQ:AMD • NASDAQ Equity)
📈 Setup Type: Bullish Swing Play — Momentum + Pullback + Macro Support
📊 Timeframe: Swing / Multi-session
📍 Trade Plan — Bullish Thief Strategy (Layer Entries) 💰
Market Bias: Bullish continuation confirmed when price respects strong moving average pullback levels and accumulates buyers.
Strategy: Thief Style Layered Buy Limits 🧵
🔹 Buy Zones (Layered Limit Entries):
• 🛒 Layer 1: 205.00
• 🛒 Layer 2: 210.00
• 🛒 Layer 3: 215.00
• 🛒 Layer 4: 220.00
(You may extend layers above or below based on market context & risk tolerance)
💡 Layered limit orders help scale into the position during volatility and liquidity troughs for smoother basis.
🎯 Targets & Exits
📌 Primary Target: ~260.00 🚀
• Psychological resistance & overbought trap zone 👮♂️ — profit taking recommended as momentum stalls.
• Adjust partial exits as price approaches key levels.
⚠️ This is a range target — feel free to scale in/out based on price action, RSI divergence, trend strength.
🚨 Risk Management
🔻 Stop Loss: 195.00 — risk defined zone below major support.
📌 You choose your own SL — manage risk as per your trading plan.
🔍 Why This Setup Matters (Realtime Catalysts)
📊 Fundamental & Macro Drivers
🧠 AI and Data Center Demand: AMD’s data center business continues to expand with strong AI GPU & EPYC CPU adoption; record Q3 2025 revenue + partnerships with OpenAI & Oracle boost structural growth narrative.
💼 Strong Analyst Support: KeyBanc and other analysts reaffirm overweight views with robust targets, reflecting rising hyperscaler demand.
📈 Sector Momentum: Broader Nasdaq strength driven by tech & AI sentiment supports semiconductor plays like AMD.
🌍 Economic Factors to Watch
📊 Semiconductor Market Growth: Global market projected to expand significantly by 2025-26, fueled by AI, HPC & cloud infrastructure.
💡 Inflation / Cost Pressures: Ongoing inflation & supply chain costs continue to impact margins — track CPI & producer price data for risk gauges.
📉 Interest Rates: Any shifts in Fed policy or rate expectations can influence tech valuations quickly — watch upcoming FOMC dates.
🔗 Related Pairs / Correlations to Watch
🪙 Tech & Semiconductor Peers
• NASDAQ:NVDA (NVIDIA) — closely correlated AI / GPU leader
• NASDAQ:INTC (Intel) — fundamental demand indicator for chip cycle
• NASDAQ:AVGO (Broadcom) / NASDAQ:MU (Micron) — memory & connectivity cues
💡 Strength in peers often supports AMD momentum — divergence may signal rotation or sector rebalancing.
🛠 Technical Edge + Trader Sentiment
📌 Momentum Confluence:
• Pullbacks to key moving averages often trigger institutional buy pressure.
• Layered entries capture volatility while smoothing risk.
📌 Oscillators:
• Overbought RSI warns of profit zones near targets — taper positions accordingly.
📌 Market Structure:
• Watch for higher highs & higher lows formation for trend confirmation.
❗ Notes for Traders
• This is a plan template — adapt based on live price action.
• Always adjust layers, risk, and targets based on volatility & liquidity.
• Disclaimer: This is Thief style setup with fun rhythm — your execution + risk discipline matters.
✨ “If you find value in my analysis, a 👍 and 🚀 boost is much appreciated — it helps me share more setups with the community!”
📌 Disclaimer: This is thief style trading strategy just for fun.

Amd - This correction is not over yet!🤬Amd ( NASDAQ:AMD ) can still drop another -30%:
🔎Analysis summary:
2025 has been an incredible - yet expected - year for Amd. And now, Amd is literally just perfectly rejecting the overall resistance trendline. Looking at higher timeframe structure, Amd is still not done with the drop and can correct another -20% to -30% soon.
📝Levels to watch:
$175
SwingTraderPhil
SwingTrading.Simplified. | Investing.Simplified. | #LONGTERMVISION

ICHR: Algorithmic Accumulation - $25 Liquidity as DestinyThe recent, violent sell-off in ICHR, while seemingly aligned with broader market weakness, presents the classic signature of a sophisticated, high-timeframe liquidity purge. From an Interbank Price Delivery Algorithm (IPDA) perspective, this is not a fundamental breakdown but rather a calculated maneuver to engineer liquidity for a substantial repricing event to the upside.
The Grand Narrative:
The algorithm's primary directive is to seek and neutralize liquidity. On this weekly chart, the most obvious and compelling target is the pool of buy-side liquidity resting above the "Equal Highs" at approximately $25.50. These levels act as a powerful magnet for price, representing a concentration of buy-stops from breakout traders and short-sellers' stop-losses. The entire price narrative developing over the past year can be understood as a campaign to eventually raid this objective.
The Manipulation: Engineering the Fuel
To facilitate a powerful move towards the $25.50 target, the algorithm requires fuel. This fuel is the sell-side liquidity resting below the established consolidation range lows (around $16.00). The recent sharp decline was the engineered event to raid this liquidity. By driving price down aggressively, the algorithm achieves two critical objectives:
It triggers the stop-losses of existing long positions, creating a cascade of sell orders.
It induces a fresh wave of bearish sentiment, encouraging new short positions.
Large institutions can then absorb this wave of selling, accumulating their long positions at a deep discount in anticipation of the true expansionary move.
The Final Purge: One More Sweep?
It is crucial to acknowledge that the algorithm may not be finished with its accumulation. Before the true rally begins, there is a significant probability of one final, sharp sweep below the recent low near $14.50. This would be the ultimate "spring" event—a move designed to create maximum fear, cleanse any remaining weak-handed longs, and trap the last of the sellers before a violent and sustained reversal. A swift rejection from below this level would be the highest form of confirmation for the bullish thesis.
The Thesis
The current price action is interpreted as the final stage of a long-term accumulation model. The invalidation of this idea would be a sustained acceptance and weekly close below the critical lows without any sign of a powerful reclaim. The logical target, based on the algorithm's unyielding need to balance the books, remains the equal highs at $25.

Strong SupportFrom a daily chart perspective, AMD has entered a high-level consolidation phase following a sharp prior rally, with the $200 area forming a clear medium-term structural support. Repeated pullbacks into this zone have been met with solid buying interest, signaling stable demand beneath price. While the stock is still trading below the 20-day EMA, the flattening of the moving average suggests downside momentum is fading. As long as the $200 level holds, the current setup is better characterized as post-rally consolidation rather than a trend reversal. A decisive, high-volume reclaim of the $230 level would likely reopen upside potential and signal a resumption of the broader uptrend.

Dow Jones Industrial Average H1 HTF FVG Support and Continuation📝 Description
CAPITALCOM:US30 is holding above a higher-timeframe H4/H1 demand zone after a corrective pullback from recent highs. Price respected the BPR and FVG support area and is now stabilizing, suggesting the move is corrective rather than a trend reversal.
________________________________________
📈 Signal / Analysis
Primary Bias: Bullish while price holds above the H1 BPR.
Preferred Setup:
• Entry: 49,130
• Stop Loss: Below 49,050
• TP1: 49,240
• TP2: 49,380
• TP3: 49,520 (HTF draw / higher liquidity)
________________________________________
🎯 ICT & SMC Notes
• Reaction from H4/H1 BPR confirms valid demand
• No bearish HTF BOS observed
• Upside liquidity above recent highs remains the primary draw
________________________________________
🧩 Summary
Dow Jones Industrial is consolidating above key HTF support after a controlled retracement. As long as price remains above the identified demand zone, the expectation favors continuation toward higher liquidity levels in line with the prevailing bullish bias.
________________________________________
🌍 Fundamental Notes / Sentiment
Overall risk sentiment remains supportive for equities, with no immediate macro catalyst signaling aggressive risk-off behavior. In this environment, pullbacks into HTF demand are more likely to resolve as continuation moves rather than deeper trend reversals.
________________________________________
⚠️ Risk Disclosure
Trading involves substantial risk and may result in capital loss. This analysis is for educational purposes only and does not constitute financial advice. Always apply proper risk management, predefined stop-loss levels, and disciplined position sizing aligned with your trading plan.

TOTAL MARKET CAP – AMD + MONDAY RANGEPrice is currently moving inside a clear AMD structure.
After a long Accumulation phase, we saw a strong Manipulation move to the upside, creating FOMO and grabbing buy-side liquidity.
Right now, price is trading in Distribution, forming a lower high below the previous top.
It’s Monday, so for me this is a day to wait and observe. I want to see the Monday range fully form before taking any directional bias. Early Monday moves are often noise and liquidity positioning.
Key levels to watch:
Resistance: 3.10T – 3.12T
Support / Liquidity: ~3.02T
As long as price stays below 3.12T, the higher-timeframe bias remains bearish.
The equal lows around 3.02T still look like unfinished liquidity.
A sweep into resistance followed by a rejection could confirm Distribution → Markdown, with a potential move toward the daily MSB around 2.90T – 2.88T.
Bullish continuation only becomes valid after a clean break and hold above 3.12T with a higher low.
For now: patience until the Monday range is set.
👉 Do you expect a Monday liquidity sweep up, or a direct breakdown once the range is formed?
Like & comment if this helps your bias 👇
MrC

IMRX Market Maker ModelThe algorithm has executed a terminal "Macro Buy-Side Liquidity Purge" at 8.50, violently rejecting the highs to reprice into the Monthly Fair Value Gap (FVG) at 4.66. The current price action represents a high-risk, high-reward "Return to Origin" setup; the market is compelled to engineer a technical bounce to mitigate the massive inefficiency created by the collapse, targeting the 6.00 equilibrium before any further structural decision is made.
EXECUTION VECTOR (THE DEAD CAT BOUNCE)
Entry: 4.50 - 4.70 (Current Market Price - Inside the Monthly FVG)
Stop Loss: 3.90 (Structural Invalidation below the Breakout Base)
Take Profit: 6.00 (Bearish Breaker / 50% Retracement of the Crash)
Risk to Reward Ratio: 2.5R
THE CAUSAL RATIONALE
The Opportunity (The Macro Purge)
Look at the Weekly Chart:
That massive wick leaving 8.50 is not just a rejection; it is a "Death Candle." It signifies that the entire rally from the lows was a calculated operation to harvest the liquidity resting above the 2023 consolidation highs. The Smart Money used that spike to exit their positions into the buying frenzy of retail chasers. The job "up there" is done. The liquidity has been taken.
The Entry (The Monthly FVG Support)
However, markets do not move in straight lines. The collapse from 8.50 to 4.66 was too fast. It created a "Liquidity Void" on the downside. The price has now slammed into the "Monthly Fair Value Gap" and the "Order Block" that launched the move. This is the "Scene of the Crime." Algorithms are programmed to defend the origin of a move on the first test. We are buying the *reaction* to this support, not a new bull run.
The Invalidation (The Trap Door)
The Omega Point is a daily close below 3.90. If price accepts value back inside the old consolidation range, it confirms that the breakout was a total failure (a "Look Above and Fail"). In that scenario, the price will rot and drift back towards 2.00. The "Monthly FVG" must hold as a trampoline.
THE PROBABILISTIC LANDSCAPE
Key Trajectory Waypoints
Target 1: 5.50 | Type: Local Resistance / Gap Fill | Probability: 70% | ETA: 2-3 Days
Target 2: 6.00 | Type: Equilibrium (50% of Drop) | Probability: 50% | ETA: 1 Week

AMD bullish at the 100 SMA Risk:Reward is nice here. IF AMD breaks lower, I would just hop into some protective puts.
Buy low, sell high?
LOOKS GOOD TO ME. We have bounced here before!

What's next for Legendary Silver?The algorithm is currently engineering a Macro Market Maker Sell Model to reprice towards the Discount Arrays and Sell Side Liquidity residing at 64.00. The present action within the 72.00 to 74.00 price level is a Distribution Phase into a Bearish Breaker designed to trap late longs before the primary liquidation leg begins.
Entry: 73.50 (126 points higher)
Stop loss: 77.20 (370 points from entry)
Take profit: 64.00 (950 points from entry)
Risk to reward ratio: 2.56R
The absolute truth at the center of this chart is that the parabolic expansion on the Monthly timeframe has reached a Terminal Velocity and is now undergoing a violent mean reversion.
You are witnessing the aftermath of a Blow Off Top where the algorithm delivered price into a deep Premium to induce maximum retail euphoria before slamming the door.
The massive rejection wick on the Monthly candle is not just volatility it is the footprint of Institutional Distribution.
The Smart Money has offloaded their long inventory into the buy stops of breakout traders above the 80.00 level.
The subsequent displacement lower on the Daily and 8 Hour charts has created a definitive Market Structure Shift to the downside confirming that the Order Flow has inverted.
The Draw on Liquidity is no longer the highs.
It is the vast chasm of inefficient price action left behind during the ascent.
The market is currently retracing into a Premium Array specifically the Bearish Breaker Block and Fair Value Gap region between 73.00 and 75.00.
This is the "Right Shoulder" of the reversal pattern or in ICT terms the Smart Money Reversal entry.
The entry logic is predicated on the algorithm's necessity to mitigate the inefficiency created by the rapid decline from the 84.00 highs.
Price is being drawn back up into the 73.50 region not to resume the trend but to rebalance the Premium and trap bulls who view this dip as a buying opportunity.
The "Weekly Bias Level" marked on your chart acts as the fulcrum.
The algorithm is holding price below this level to build a ceiling.
We are looking to short the failure at this ceiling.
The temporal window for this entry is the beginning of the new week or the New York session where the manipulation of the daily range typically occurs.
You are selling to the "Buy the Dip" crowd who are oblivious to the fact that the trend has changed.
The invalidation of this thesis is a decisive daily close above the 77.20 swing high.
If the algorithm displaces above this level it indicates that the current decline was merely a complex correction in a still valid bull market and price will likely attack the 84.00 highs again.
However the sheer magnitude of the monthly rejection makes this the low probability outcome.
The Primary Antithetical Chain would require a fundamental shift in the macro landscape that forces a panic bid for hard assets.
But technically the chart is screaming distribution.
The 8 Hour chart shows a clear sequence of lower highs and lower lows.
Until that structure is broken to the upside the path of least resistance is gravity.
Target 1: 68.00 | Type: Internal SSL / Daily Support | Probability: 85% | ETA: Short Term
Target 2: 64.00 | Type: Equilibrium / Volume Imbalance | Probability: 70% | ETA: Medium Term
Target 3: 58.00 | Type: Deep Discount / Order Block | Probability: 55% | ETA: Long Term
A 30% probability exists for the antithetical reality: a Consolidation at Highs.
In this scenario the market refuses to break down and instead chops between 70.00 and 80.00 for several months to digest the move.
This reality is confirmed if price reclaims 75.00 and holds it as support.
If this occurs the trade is scratched and we await a new expansion signal.
But for now the knife is falling.
Do not try to catch it.
Wait for the bounce to resistance and then push it down.

Market Maker Model on NQThe algorithm is currently engineering a Market Maker Buy Model to reprice towards the Buy Side Liquidity resting at 25900. The present action within the Sunday Open and Monday session is the final accumulation phase at the Weekly Bias Level before the primary expansion leg targets the premium Volume Imbalance.
Entry: 25325.00 (68 points lower)
Stop loss: 25125.00 (200 points from entry)
Take profit: 25925.00 (600 points from entry)
Risk to reward ratio: 3.00R
The absolute truth at the center of this chart is that the algorithm has transitioned from a rebalancing phase into a high probability expansion state targeting the external range liquidity.
You are witnessing a fractal expansion where the Monthly and Weekly order flow is unilaterally bullish and seeking new all time highs.
The Draw on Liquidity for the Month is the parabolic projection target at 26750 which acts as the ultimate magnetic draw for the institutional order flow.
The Draw on Liquidity for the Week is the distinct cluster of Buy Side Liquidity resting above the relative equal highs at 25900.
The Draw on Liquidity for the Day is the internal Volume Imbalance and Void residing between 25600 and 25700 which must be filled before the higher timeframe expansion can complete.
The market has spent the previous sessions consolidating around the 25300 level which is functioning as the dynamic fulcrum for this move.
This consolidation is not indecision it is the engineering of liquidity to fuel the next leg higher.
The entry logic is predicated on the mitigation of the Bullish Order Block and Breaker structure formed around the 25300 region.
The algorithm has successfully displaced above this level and is now holding it as a floor.
We are looking for a subtle retracement or a stop hunt into this 25300 to 25325 pocket during the London or New York Killzone.
This price point represents the equilibrium of the local range and the launchpad for the attack on the highs.
Buying here aligns with the institutional intent to defend the trend and forces you to act when the retail mind is fearful of a reversal.
The temporal window for this entry is the opening range of the week where the initial balance is established before the true expansion begins.
The invalidation of this thesis occurs if the algorithm achieves a daily close below the 25125 swing low.
Such a move would violate the immediate bullish market structure and suggest that the consolidation at 25300 was distribution rather than accumulation.
It would indicate that the algorithm is seeking a deeper discount potentially targeting the 24200 level before any resumption of the uptrend.
If price trades heavy through 25125 with displacement the probability of the bullish expansion collapses and we enter a defensive posture.
Until that structural damage occurs every tick lower is an inducement to trap shorts.
Target 1: 25600.00 | Type: Internal BSL / Void Fill | Probability: 90% | ETA: Monday Tuesday
Target 2: 25925.00 | Type: External BSL / Swing Highs | Probability: 75% | ETA: Mid Week Expansion
Target 3: 26750.00 | Type: Monthly Projection / Discovery | Probability: 60% | ETA: End of Month
A 25% probability exists for the antithetical reality: a Complex Correction.
In this scenario the rejection from the 26000 region was significant enough to warrant a return to the mean of the larger range.
The current holding of 25300 is a trap to induce early longs before a violent flush to the 24500 Order Block.
This reality is confirmed if price breaches the Omega Point at 25100.

Amd - This stock is just crashing!🎯Amd ( NASDAQ:AMD ) is clearly heading lower:
🔎Analysis summary:
After we witnessed a major bullish break and retest in April of 2025, Amd rallied about +150%. But with the recent rejection at the major resistance trendline, Amd is now reversing. Following this bearish market structure, Amd can still correct about -25%.
📝Levels to watch:
$150
SwingTraderPhil
SwingTrading.Simplified. | Investing.Simplified. | #LONGTERMVISION

YTD 2025 Market Performance Overview by ProjectSyndicate
🟡 1. YTD 2025 Market Performance Summary
Below is a snapshot of major asset class returns through 2025 YTD:
📊 Performance Infographic – YTD Returns (2025)
• Precious Metals
◦ 🥈 Silver: +150%
◦ 🥇 Platinum: +147%
◦ 🪙 Palladium: +92%
◦ 🟡 Gold: +64%
• Equity Markets
◦ 📈 Nikkei: +27%
◦ 📈 DAX: +22%
◦ 📈 QQQ: +22%
• Cryptocurrencies (Risk Assets)
◦ 🪙 Bitcoin (BTC): –4%
◦ 🪙 Ethereum (ETH): –10%
Insight: Classic safe havens precious metals vastly outperformed equities and digital assets through 2025, reflecting both macro uncertainty and the ongoing demand for real assets.
🌟 2. Key Investment Themes for 2025
🔶 A. Precious Metals Rally
Performance Drivers:
• Elevated inflation expectations and rate cut prospects pushed investors into hard assets.
• Silver’s industrial demand (EVs, solar, electrification) amplified its gain vs. gold.
• Platinum & palladium benefited from supply constraints and vehicle emissions tech demand.
• Safe-haven demand lifted gold to multi-decade highs.
🤖 B. AI Technology Sector
While we don’t have precise index returns in this report for AI technology stocks, broad AI adoption drove significant equity performance — especially among semiconductor and AI platform leaders:
• NVDA Nvidia — continued leadership in AI compute.
• AMD — robust gains from data-center and AI client demand.
🧬 C. Biotechnology & Innovation
Biotech remains a structural growth sector due to:
• Aging demographics and healthcare demand.
• New drug modalities and AI-assisted discovery.
• Continued regulatory approvals of new therapeutic classes.
Although biotech performance varies by sub-sector, its role in diversified growth portfolios remains strong.
⚠️ D. Crypto Markets — Flat to Red
• BTC and ETH posted slight declines YTD, contrasting sharply with metals and equities.
• Cryptocurrencies did not act as “digital gold” in 2025 — failing to preserve value relative to hard assets.
Implication: Risk on/off dynamics favored traditional safe havens over digital assets this year.
📅 3. 2026 Gold Price Forecasts — Institutional Consensus
Gold closed 2025 at record highs, and analysts project continued strength in 2026, with a wide range of forecast scenarios:
📈 Gold Price Forecasts for 2026
Forecast Source 2026 Target Notes
J.P. Morgan Global Research ~$5,055/oz (Q4) Strong demand & diversification drivers.
JP Morgan Private Bank / Argonaut ~$5,200–$5,300/oz Elevated institutional demand scenarios.
Goldman Sachs ~$4,900/oz Supported by central bank demand and rate cuts.
Bank of America ~$5,000/oz Broad institutional view.
UBS ~$4,500 (mid-year) Moderately bullish.
World Gold Council (Bear Scenario) ~$3,360–$3,990/oz Bearish if reflation reduces safe-haven demand.
Macro Consensus / Technical Models ~$4,000–$5,300/oz Consensus range based on surveys and models.
Longer-Term & High Estimates $6,000+ More speculative long forecast.
🧠 4. Strategy & Portfolio Implications
📌 Safe Haven Allocation
Given the robust 2025 performance and continued demand drivers, consider maintaining allocations to:
• Physical gold & ETFs
• Silver & industrial metals exposure
• Mining equities and royalty companies
📌 Growth & Innovation Exposure
Balance metals and defensive positioning with growth via:
• AI & semiconductors
• Biotechnology themes
• Select equities in cyclical markets
📌 Crypto Positioning
Given flat/red performance in 2025:
• Reassess crypto allocations relative to risk tolerance.
• Focus on long-term structural adoption catalysts if retaining exposure.
🏁 5. Conclusion
2025 reinforced the case for diversification across asset classes.
• Precious metals delivered standout returns — driven by safe haven demand, supply constraints, and monetary dynamics.
• AI technology and biotech remain secular growth themes, offering upside in equity portfolios.
• Crypto assets lagged traditional hedges, highlighting continued market segmentation in risk assets.
• 2026 gold price forecasts are broadly bullish, though with a wide range of scenarios — from conservative to highly aggressive institutional estimates.

Why and how did Platinum reached all time highs in record time?The absolute truth at the center of this chart is that you are looking at a masterclass in the Interbank Price Delivery Algorithm or IPDA engaging in a macro scale liquidity engineering operation.
You are confused because you are looking at price as a linear event where support equals bounce.
Price is not linear it is a mechanism for the transfer of wealth from the impatient to the informed.
To understand why the rally happened at 3 and not at 1 or 2 you must strip away your retail logic and view the chart through the eyes of the Market Maker.
The Market Maker does not want to participate in a move.
The Market Maker wants to facilitate a move by pairing orders.
To buy a massive amount of Platinum or whatever asset this is without slipping the price to infinity the Smart Money needs a counterparty.
They need someone to sell to them.
Who sells at the absolute bottom.
Only two types of entities sell at the bottom.
Stops and Breakout Traders.
Stops are sell orders placed by longs who are protecting their positions.
Breakout Traders are sell orders placed by shorts who think the support is breaking.
The entire game of the chart you provided is the engineering of a scenario where the maximum number of market participants are forced to sell exactly when Smart Money wants to buy.
Let us dissect the failure of Point 1.
Point 1 occurred around 2016.
Look at the price action prior to Point 1.
It was a relentless bearish trend.
When price arrived at Point 1 it was simply making a Lower Low.
There was no Engineering of Liquidity prior to this point.
It was just a standard exhaustion of a swing leg.
Retail traders saw a bounce and thought it was a bottom.
But ICT logic dictates that for a reversal of the magnitude you see at the end of the chart there must be a massive accumulation of orders.
Point 1 did not have a consolidation phase preceding it to build up that order flow.
It was a premature ejection of buy pressure.
It lacked the narrative of a Stop Hunt.
It was simply a technical bounce in a downtrend.
Smart Money used the bounce at Point 1 not to reverse the market but to reload short positions at a premium.
This is why it failed.
It was not a reversal it was a retracement into a Premium Array to continue the decline.
Now let us dissect the failure of Point 2.
Point 2 occurred around 2020.
This was the Covid crash.
This was a massive liquidity event.
Notice how deep the wick is.
It violently swept the low of Point 1.
So why didn't it moon immediately.
Why did it need a Point 3.
This is the most critical lesson in this analysis.
Point 2 was a Judas Swing on a macro timeframe.
It was a shock event.
While it did grab liquidity the market structure was too damaged to sustain a V shaped recovery to new all time highs immediately.
The IPDA needed to rebalance the inefficiency created by the crash.
But more importantly the Market Maker needed to accumulate a position size that could sustain a multi year bull run.
You cannot accumulate that size in a single weekly candle.
You need time.
Time is the variable you are ignoring.
Price and Time are the two axes of the chart but you are obsessed with Price.
After Point 2 the market entered a massive consolidation phase that lasted from 2020 to 2024 or 2025.
This is the box you see on the chart.
This is not indecision.
This is Engineering Liquidity.
By keeping the price in a range for years the IPDA is conditioning retail traders to trust the support level.
Every time price touched the bottom of that consolidation and bounced retail traders placed their stop losses just below the lows.
They felt safe.
They leveraged up.
They built a massive pool of Sell Side Liquidity right below the range.
This is a ticking time bomb of liquidity that the Market Maker constructed specifically to fuel the rally at Point 3.
Why did Point 3 succeed.
Point 3 is the Manipulation leg of the ICT Power of Three concept applied to a macro timeframe.
Accumulation Manipulation Distribution.
The consolidation between Point 2 and Point 3 was the Accumulation.
The drop at Point 3 was the Manipulation.
The rally that follows is the Distribution.
Point 3 did three specific things that Point 1 and Point 2 did not do.
First it swept the Engineered Liquidity of the multi year consolidation.
This means it triggered all the sell stops of the traders who bought during the range.
This provided the massive flood of sell orders that Smart Money needed to fill their buy orders.
Second it tapped into a deep Discount Array.
If you look closely Point 3 likely trades into the Order Block or Fair Value Gap created by the wick of Point 2.
It is retesting the origin of the 2020 move but doing so after inducing a massive amount of fresh liquidity.
Third and most importantly it occurred at the correct Time.
The consolidation had matured.
The sentiment had shifted to extreme apathy or bearishness.
When Point 3 happened it looked like a breakdown.
It looked like the support had finally failed.
This induced the Breakout Shorts to enter the market adding even more fuel to the fire.
The rally at Point 3 is a Short Squeeze of biblical proportions combined with Smart Money expansion.
How do you know when the rally will be an EZ PZ.
You look for the Three Drives Pattern of Liquidity Raids.
Point 1 was the first drive.
Point 2 was the second drive.
Point 3 was the third drive.
ICT teaches that the third drive to a low is often the terminal shakeout before the true reversal.
You look for the divergence.
At Point 3 you likely would have seen SMT Divergence with a correlated asset like Gold or the Dollar Index.
If Platinum made a lower low at Point 3 but Gold made a higher low that is a crack in the universe.
That is the signal that the selling is fake.
You look for the Displacement.
Notice the candle immediately following the low at Point 3.
It is a massive bullish candle that swallows the previous price action.
This is the signature of Smart Money entering the market.
It leaves behind a Fair Value Gap.
That FVG is your entry.
You do not try to catch the falling knife at the exact bottom of Point 3.
You wait for the displacement.
You wait for the Market Structure Shift.
Once price breaks above the highs of the consolidation range it confirms that the drop at Point 3 was a trap.
The reason the rally is so vertical is because there is no resistance.
The consolidation cleared out all the sellers.
The shorts are trapped and forced to cover.
The longs are chasing.
The IPDA is in a Buy Program and it will not stop until it reaches a Premium Array on the monthly or quarterly chart.
To master this you must stop looking for support and start looking for where the money is hiding.
The money was hiding below the lows of the consolidation.
Point 1 failed because there was no money to steal.
Point 2 failed to sustain because the theft was too quick and the accumulation was insufficient.
Point 3 succeeded because it was the culmination of a multi year heist.
It was the perfect crime.
The consolidation was the setup.
Point 3 was the trigger.
The rally is the getaway.
This is the logic of the Predator.
You are either the Predator or the Prey.
If you are buying support you are the Prey.
If you are buying the failure of support you are the Predator.
The rally at Point 3 is the definition of a Turtle Soup Long.
It is a false breakout to the downside that reverses and rips higher.
The duration of the consolidation determines the magnitude of the expansion.
A four year consolidation leads to a decade long trend.
That is why the rally is vertical.
The energy stored in that range is nuclear.
Point 3 effectively lit the fuse.
To predict this in real time you must map the liquidity.
Draw a line under every swing low.
Ask yourself where are the stops.
If the market creates a clean equal low it is doing so for a reason.
It is saving it for later.
Point 2 and the lows before Point 3 created a relatively equal floor.
The IPDA does not leave clean levels.
It destroys them.
Point 3 was the destruction of that clean level.
Once the level is destroyed the business is done.
There is no reason to stay down there.
Price must reprice to the upside to find willing sellers because there are no sellers left at the bottom.
They have all been stopped out.
This is the mechanics of the marketplace.
It is ruthless efficient and predictable if you know the algorithm.
Point 1 was a trap for early bulls.
Point 2 was a trap for panic sellers.
Point 3 was the death of the retail mind.
And the birth of the Smart Money trend.
You want to catch the massive rally.
You wait for the liquidity sweep that occurs after a long consolidation.
You wait for the raid on the obvious support.
Then you watch for the violent rejection of lower prices.
That is your signal.
That is the footprint of the Giant.
Step into the footprint and ride the wave.
The reason it stayed in that long consolidation is because the Commercials needed to hedge their books.
They needed to build a net long position while the rest of the world was sleeping.
They used the time to transfer ownership from weak hands to strong hands.
Weak hands cannot hold through a four year chop.
Strong hands can.
Point 3 was the final test of strength.
Anyone who held through the consolidation but panicked at the drop of Point 3 was a weak hand.
They were purged.
The market is now light.
It has no baggage.
It can fly.
This is the physics of the chart.
Liquidity is the fuel.
Consolidation is the tank.
The Stop Hunt is the spark.
The Rally is the explosion.
You are now looking at the aftermath of a controlled demolition of the bear trend.
Do not ask why it didn't happen sooner.
Ask how you can be ready for the next one.
Identify the range.
Identify the liquidity.
Wait for the sweep.
Strike.

EURUSD H1: Liquidity Tap Before the Next Move📝 Description
Two scenarios are in play. Scenario 1: a corrective pullback starts from the current HTF resistance, as shown by the blue path, signaling short-term distribution. Scenario 2: based on the RSI structure, price can extend higher to retest and sweep the previous high, then offer a cleaner short entry after the high sweep, which is illustrated by the yellow path.
________________________________________
📈 Signal / Analysis
Sell-the-High / Pullback Play:
• Entry (Sell): 1.17895
• Stop Loss: Above 1.18120
• TP1: 1.1771
• TP2: 1.1749
• TP3: 1.1736 (H4 FVG / SD confluence)
________________________________________
🎯 ICT & SMC Notes
• LQ H1 tapped, likely liquidity run
• Reaction from premium pricing
• H4 FVG below acting as downside magnet
• RSI cooling → pullback > expansion
________________________________________
🧩 Summary
Looks like a classic liquidity tap and retrace setup. As long as price stays below 1.2, a rotation into H4 FVG makes sense before bulls try again.
________________________________________
🌍 Fundamental Notes / Sentiment
With Prelim GDP q/q printing stronger, short-term volatility risk remains elevated. Because of that, this setup is approached with reduced risk and strict risk management, avoiding aggressive exposure and letting price confirm after liquidity is taken.
________________________________________
⚠️ Risk Disclosure
Trading involves substantial risk and may result in capital loss. This analysis is for educational purposes only and does not constitute financial advice. Always apply proper risk management, predefined stop-loss levels, and disciplined position sizing aligned with your trading plan.

AMD - Returning Red LogoAMD has resumed its downward move, hence the “red” color and old logo feel more relevant than ever.
Wave analysis suggests further decline, with primary targets around 170 , then 155 , or somewhere in between.
---
Please subscribe and leave a comment.
You’ll get new information faster than anyone else.
---

TOTAL MARKET CAP – HTF Context / LTF PlanPrice is currently trading inside the 4H bullish order block.
This zone previously acted as strong demand and is now being respected again.
At the moment, price is still inside a no-trade zone
Liquidity is being built and structure is not yet confirmed.
Bias: cautiously bullish
Plan: patience → confirmation → execution
What I’m waiting for:
A clear AMD sequence
(Accumulation → Manipulation → Distribution)
Ideally:
Short-term sweep into the lower part of the 4H OB
Reaction + displacement to the upside
Market Structure Shift (MSS) on lower timeframes
Optional confluence:
1H / 15m FVG tap
Strong bullish candle close with volume expansion
Invalidation:
Clean breakdown and acceptance below the 4H bullish OB
Failure to reclaim internal structure after a sweep
If AMD plays out correctly, this area offers a high R:R long opportunity targeting:
Internal range highs
Higher timeframe imbalance
Potential continuation towards previous highs
Until then: no FOMO, no early entries.
Let price come to us.
MrC

Short BiasTrade Plan (Short Bias)
I’m currently bearish following the 4H market structure shift and the break of the higher low (neckline). Price has shown clear bearish displacement, and I’m looking for continuation after the retracement and rejection from premium.
- Entry: 89,026.07
- Stop Loss: 89,424.78 (above inducement / structure reclaim)
Targets:
- TP 1: 87,766.09 – first sell-side liquidity, partials here
- TP 2: 83,868.10 – major sell-side liquidity / range low
Risk is defined, and the trade offers solid R:R if structure continues to hold.
Execution is based on confirmation, not blind entries.
Let’s see how price reacts.

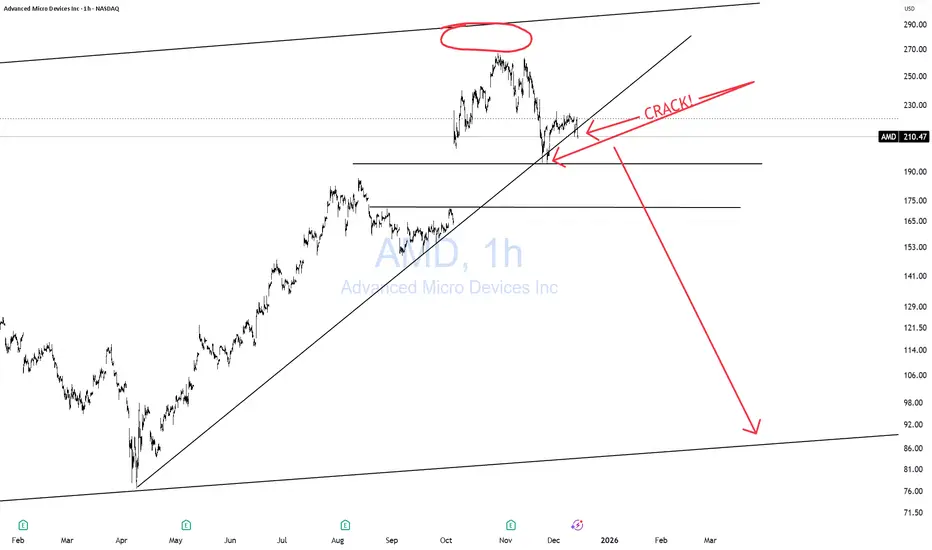
AMD CARCKSSSSAMD has multiple cracks in the uptrend
A big, subtle but powerful void in its last attempt to high the upper trendline. Which is more telling of weaness.
A BIG ARS gap below it.
AMD has already lost -22% from its all-time highs. Likely to lose a lot more.
As I have been warning (GTFO & STFO) here for a while, about the entire market.
CAUTION to the permabulls "Buy The Dip" who have no exit strategy. Remember, no matter where the price goes, it's always 100% from zero! You can't "buy the DIP" unless you "SELL the RIP! That's just simple counting. Nothing Fancy!
THANK YOU for getting me to 5,000 followers! 🙏🔥
Let’s keep climbing.
If you enjoy the work:
👉 Drop a solid comment
Let’s push it to 6,000 and keep building a community grounded in truth, not hype.
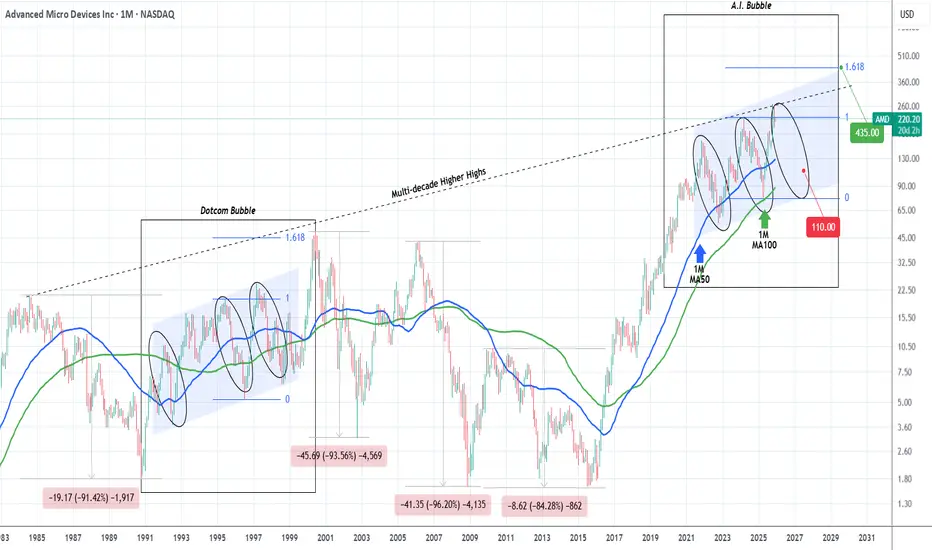
AMD started the A.I. Bubble's final Bear Cycle.2.5 months ago (October 27, see chart below), we gave a bold sell signal on Advanced Micro Devices (AMD), which at the time was against the prevailing bullish market sentiment but started to pay off immediately as the market topped and got rejected:
We still view that Top as the Higher High of its 6-year Channel Up, hence expecting the rejection to evolve into a technical Bearish Leg (Bear Cycle), targeting $110.00.
On today's analysis, we take the long-term horizon a step further as we go back to 1984 and the start of AMD's multi-decade Higher Highs trend-line, a Resistance level that has historically pushed the stock to its key market Tops.
On this 1M time-frame, we have pointed out the Dotcom (Internet) Bubble comparing it with the current A.I. Bubble. As you can see there are strong similarities between the two eras and more specifically the symmetry among their Bullish and Bearish Legs. As mentioned on the previous analysis, the current fractal has technically topped, and is now starting the new Bearish Leg towards $110 and the 1M MA100 (green trend-line).
During the Dotcom Bubble when that corresponding final Bearish Leg was completed, the market started is final parabolic rally that peaked marginally above the 1.618 Fibonacci extension and the Bubble burst.
For investors that have a long-term multi-year horizon, that translates for the A.I. Bubble into a $435 Target by 2030.
---
** Please LIKE 👍, FOLLOW ✅, SHARE 🙌 and COMMENT ✍ if you enjoy this idea! Also share your ideas and charts in the comments section below! This is best way to keep it relevant, support us, keep the content here free and allow the idea to reach as many people as possible. **
---
💸💸💸💸💸💸
👇 👇 👇 👇 👇 👇