Amd - Here comes the massive reversal!🩻Amd ( NASDAQ:AMD ) is starting to reverse:
🔎Analysis summary:
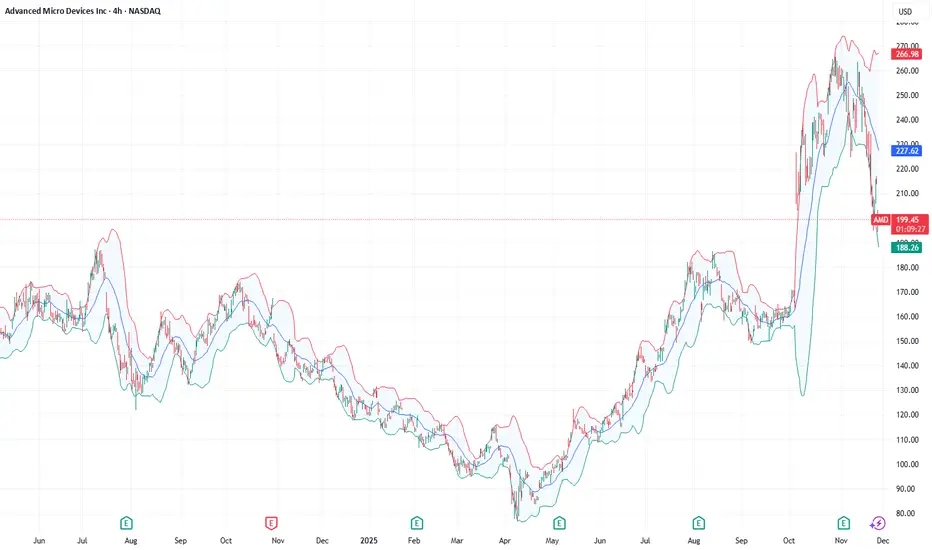
Starting back in mid 2025, Amd retested a major confluence of support and rallied about +200%. All of this was expected and the rally ended with a retest of a significant trendline. Eventually, after some back and forth, Amd will then create a short term retracement.
📝Levels to watch:
$250
SwingTraderPhil
SwingTrading.Simplified. | Investing.Simplified. | #LONGTERMVISION
AMD

AMD Alert: Bullish Reversal Opportunity Amid Sector DipAMD QuantSignals V3 Swing 2025-11-25
Ticker: AMD
Signal Type: Swing Options Setup (Expiry: 2025‑12‑12)
Direction: BUY CALLS
Confidence: 68% (Medium conviction)
Strike Focus: $210.00
Entry Range: ~$13.12
Target 1: ~$18.75
Target 2: ~$22.50
Stop Loss: ~$8.75
Horizon: 17 days
1W Move: -2.93%
2W Move: -6.86%
Volume vs Prior Swing: 1.7×
Swing Range: $194.28 – $217.13
Risk Level: Moderate-High — due to volatility
🧠 Key Technical & Chart Insights
Support/Resistance:
Support at $194.28
Resistance at $256.27
Oversold Condition: AMD down ~18.84% intraday, trading 9.4% below VWAP ($222.16), signaling potential mean reversion.
Momentum: Indicators show extreme bearish exhaustion; RSI likely in oversold territory.
Candlestick Patterns: No specific reversal patterns detected yet.
Trend Context: Overall sector bearish (SPY/QQQ moderately bearish), creating a contrarian swing opportunity for AMD.
📰 News & Market Context
News Sentiment: Mixed but leaning constructive
White House AI initiative (“Genesis Mission”) = long-term tailwind
Google-Meta deal concerns = short-term pressure
Options Flow: Bullish bias with PCR 0.54 and max volume at $350 call, signaling institutional optimism.
🎯 Trade Rationale
Entry Advantage: Stock at maximum fear phase after sharp single-session decline.
Timing: 17-day horizon aligns with Katy AI’s predicted 14–21 day recovery window.
Risk/Reward: Entry at $210 provides buffer below current price, 50–80% potential upside.
Position Size: Suggested 2.5% of portfolio, considering elevated volatility (VIX 20.19).
⚠️ Key Risks
Semiconductor sector sentiment may shift negatively.
High single-day volatility — stop loss adherence is critical.
Trade dependent on Katy AI’s predicted recovery timeline; monitor daily momentum and news catalysts.

Tech giants and a crypto exchange under pressure!Recently, the stocks of Advanced Micro Devices (#AMD), Coinbase Global Inc. (#Coinbase), Oracle Corp. (#Oracle), NVIDIA Corp. (#NVIDIA), and Arm Holdings plc (#Arm) have come under pressure amid a reassessment of artificial intelligence (AI) valuations and growing caution toward risk assets. Investors are reacting nervously to the cost of capital, the pace of AI monetization, and the resilience of demand within adjacent ecosystems.
5 Factors Behind the Decline:
#AMD (−10.33%) — profit-taking after a strong rally and growing doubts about the scalability of server GPUs. Additional pressure comes from margin risks driven by aggressive capital spending and competition in high-performance GPU accelerators.
#Coinbase (−10.31%) — a weakening crypto market reduces trading volumes and fee revenue. Regulatory risks and volatile client flows deepen the valuation discounts.
#Oracle (−10.29%) — concerns over rising debt levels amid heavy investments in cloud and AI infrastructure. The market fears shrinking free cash flow and pressure on valuation multiples if growth slows.
#NVIDIA (−4.08%) — “overvaluation + maxed-out expectations”: even strong earnings reports fail to calm concerns about cyclical demand in data centers. Added to this are risks of margin normalization and potential inventory build-ups among customers.
#Arm (−3.02%) — high sensitivity to sell-offs in the “AI sector,” especially given its premium valuation. Investors question how quickly the royalty-based model can translate into stable accelerated growth.
If concerns about AI-related spending and uncertainty around interest rates persist, stocks inflated by AI and crypto market expectations may continue to fall. Further capital outflows or rising borrowing costs would serve as triggers for additional downside.
FreshForex analysts see potential for a correction in #AMD, #NVIDIA, #Arm, #Oracle, and #Coinbase due to slowing AI infrastructure growth and persistently high capital costs. For #Coinbase , elevated crypto market volatility is an additional pressure factor. The current market situation creates conditions for developing scenarios for asset price declines.
Breaking; Advanced Micro Devices, Inc. (AMD) Is Up 7%The price of Advanced Micro Devices, Inc. (AMD) spike 7% in early market trading on Thursday as the stock broke from a bullish flag pattern.
In another news that served as a catalyst, AMD, Cisco and HUMAIN to invest in a joint venture and serve as its exclusive technology partners, deepening their multi-year strategic collaboration announced in May during U.S. President Donald J. Trump's visit to the Kingdom of Saudi Arabia.
The joint venture plans to deploy up to 1 GW of AI infrastructure by 2030, with the shared ambition to expand capacity to multiple gigawatts, as a key pillar of HUMAIN's overall ambitions.
With the RSI at 44, the stock is more than able to break through highs and claim the $300 resistance.
Financial Performance
In 2024, Advanced Micro Devices's revenue was $25.79 billion, an increase of 13.69% compared to the previous year's $22.68 billion. Earnings were $1.64 billion, an increase of 92.15%.
About AMD
Advanced Micro Devices, Inc. operates as a semiconductor company worldwide. It operates in three segments: Data Center, Client and Gaming, and Embedded. The company offers artificial intelligence (AI) accelerators, x86 microprocessors, and graphics processing units (GPUs) as standalone devices or as incorporated into accelerated processing units, chipsets, and data center and professional GPUs; and embedded processors and semi-custom system-on-chip (SoC) products.

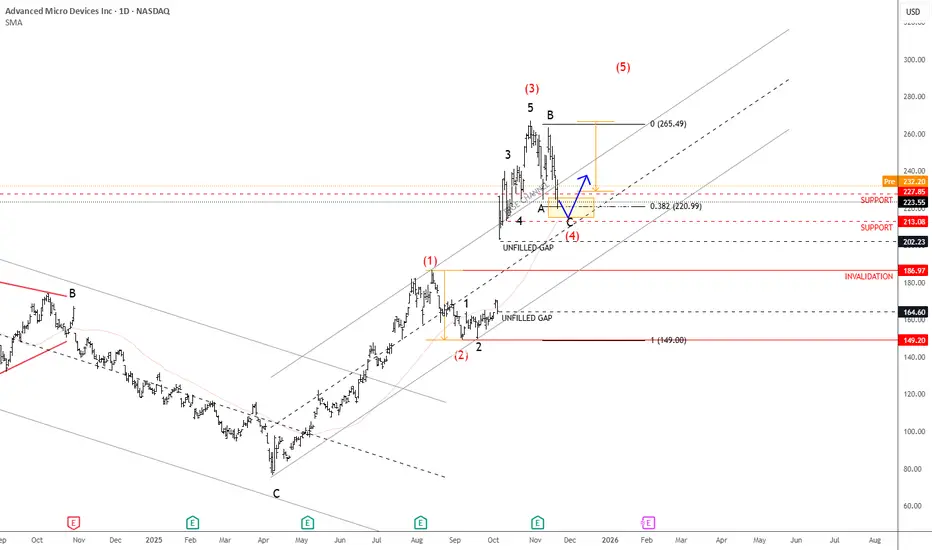
AMD Is Approaching Support, While Finishing A CorrectionAMD is in a very strong uptrend, supported by the impressive rally since early October when it gapped higher on positive AI news. Since then, the stock has gained more than 50%, and this bullish momentum could continue after a retracement, especially considering latest company’s better-than-expected earnings report.
But based in latest price action, we assume that the market is now in a corrective pullback before resuming higher, ideally forming wave four within a broader five-wave sequence. The previous high around 220 could act as the first key support, followed by the 200 area, which also aligns with upper range of unfilled gap. So if we are correct, then later this month or early in December, the market can once again stabilize and turn up for a new high, while the price is above 187 invalidation level.
Highlights:
Trend: Strong uptrend, wave four correction in view
Support: 220 / 200 zone
Invalidation: Below 186
Note: Wait for a pullback to complete before considering new long opportunities
Amd - Here comes the major reversal!👺Amd ( NASDAQ:AMD ) is reversing right now:
🔎Analysis summary:
Over the course of the past couple of months, we witnessed a very expected rally on Amd of about +250%. But right now, Amd is retesting a major resistance trendline. If we actually see bearish confirmation in the near future, the next bearmarket will start quite soon.
📝Levels to watch:
$250
SwingTraderPhil
SwingTrading.Simplified. | Investing.Simplified. | #LONGTERMVISION

ICHR: Algorithmic Accumulation - $25 Liquidity as DestinyThe recent, violent sell-off in ICHR, while seemingly aligned with broader market weakness, presents the classic signature of a sophisticated, high-timeframe liquidity purge. From an Interbank Price Delivery Algorithm (IPDA) perspective, this is not a fundamental breakdown but rather a calculated maneuver to engineer liquidity for a substantial repricing event to the upside.
The Grand Narrative:
The algorithm's primary directive is to seek and neutralize liquidity. On this weekly chart, the most obvious and compelling target is the pool of buy-side liquidity resting above the "Equal Highs" at approximately $25.50. These levels act as a powerful magnet for price, representing a concentration of buy-stops from breakout traders and short-sellers' stop-losses. The entire price narrative developing over the past year can be understood as a campaign to eventually raid this objective.
The Manipulation: Engineering the Fuel
To facilitate a powerful move towards the $25.50 target, the algorithm requires fuel. This fuel is the sell-side liquidity resting below the established consolidation range lows (around $16.00). The recent sharp decline was the engineered event to raid this liquidity. By driving price down aggressively, the algorithm achieves two critical objectives:
It triggers the stop-losses of existing long positions, creating a cascade of sell orders.
It induces a fresh wave of bearish sentiment, encouraging new short positions.
Large institutions can then absorb this wave of selling, accumulating their long positions at a deep discount in anticipation of the true expansionary move.
The Final Purge: One More Sweep?
It is crucial to acknowledge that the algorithm may not be finished with its accumulation. Before the true rally begins, there is a significant probability of one final, sharp sweep below the recent low near $14.50. This would be the ultimate "spring" event—a move designed to create maximum fear, cleanse any remaining weak-handed longs, and trap the last of the sellers before a violent and sustained reversal. A swift rejection from below this level would be the highest form of confirmation for the bullish thesis.
The Thesis
The current price action is interpreted as the final stage of a long-term accumulation model. The invalidation of this idea would be a sustained acceptance and weekly close below the critical lows without any sign of a powerful reclaim. The logical target, based on the algorithm's unyielding need to balance the books, remains the equal highs at $25.

S&P At The End Of The Trend?Seems like on the weekly and monthly charts, the S&P has completed a 5 wave Elliott which started in fall 2022, exactly 3 years ago. The indicators also seem getting weaker on both time frames. Probably there is a distribution going on. Everybody you see is talking about a recession in 2026, mostly towards the middle of the year and we will have a Christmas rally this year. Well, by now we have learned that if everybody is expecting something to happen, either it doesn’t happen or it happens earlier . We’ll see because nobody knows the future. Though, as I see, most people now are in the mood that every fall is a buying opportunity and “this time it’s different” with ai. So many cocky opinions flying around. Maybe this time it’s different but for now, I am thinking that we will have a 3 wave Elliott downwards. Actually, I didn’t like the sentiment that is going around. We’ll see if we will wear our shorts in winter.

AMD Trade Setup | AI Leadership + Strong Earnings MomentumAdvanced Micro Devices NASDAQ:AMD remains a key name in the ongoing AI and semiconductor rally. Just ahead of earnings, AMD announced a $1B partnership with the U.S. Department of Energy (DOE) (Oct. 27), a major validation of its role in high-performance computing. This bullish development set the stage for strong momentum into the earnings release.
🚀 Earnings Recap:
AMD delivered a solid Q3 report with 36% YoY revenue growth, margin expansion, and upbeat guidance. The Client and Data Center segments led the charge, while Embedded was softer. With macro support for semiconductors and increasing AI investment, market sentiment remains bullish.
🔧 Trade Plan:
Entry: $224
Take Profit 1: $248
Take Profit 2: $267
Stop Loss: $211

Is AMD expensive? Earnings News!AMD just posted a double beat and reporting a record amount of revenue. crossing the $9billion mark.
The company expects revenue of about $9.6 billion for the next quarter, plus or minus $300 million, compared with analysts' average estimate of $9.15 billion.
AMD last month said it would supply AI chips to OpenAI in a multi-year deal that would bring in tens of billions of dollars in annual revenue and give the startup the option to buy up to roughly 10% of the chipmaker.
The deal covers the deployment of hundreds of thousands of AMD's graphics processing units (GPUs), roughly equivalent to the energy needs of 5 million U.S. households, or about thrice the amount of power produced by the Hoover Dam.
The stock still seems a bit expensive for my liking but a good solid report.

$INTC - Best in the sector against Trump tariffsIntel is a semiconductor technology giant, renowned for its x86 processors that dominate the CPU segment, top revenue in Q2 2025 came from PC chips (Client Computing Group, ~$7.9B) and server/AI chips (Data Center & AI, ~$3.9B) . Other revenue includes foundry services ($4.4B) and legacy businesses ($1.1B).
But, for the last 4 years the company has experienced one disaster after another:
- Loss of Market Share & Intensified Competition vs AMDs Ryzen and NVIDIA AI GPUs has been major drivers for last 4 years of decline.
- Gross margin dropped to around 38–39% in 2024—a steep fall from pre‑pandemic levels above 60%, while NVIDIA maintained margins above 75%.
- Intel perpetually lagged in transitioning to advanced nodes (7 nm, 5 nm), resulting in costly delays and reduced competitiveness .
- Credit rating downgrade: In August 2025, Fitch downgraded Intel’s credit rating from BBB+ to BBB (negative outlook) due to weak demand and deteriorating profitability . S&P had already downgraded Intel to BB+, and Moody's also cut its rating in 2024 .
Recent events and price action show its time for a buy at these prices.
- Spin-off of Network & Edge (NEX) group: Intel announced the spin-off of its Network and Edge Group (NEX) into an independent entity focused on critical communications and networks, seeking external investors while retaining a major stake .
- Workforce reduction and factory cancellations: Intel confirmed layoffs of ~24,000 employees (~15% of workforce) and cancellation of chip plant projects in Germany and Poland . New CEO Lip-Bu Tan plans to cut the headcount to ~75,000 by year-end 2025 .
- Executive departures and internal reorganization: Three corporate VPs (Kaizad Mistry, Ryan Russell, Gary Patton) announced retirement from manufacturing operations amid deep restructuring . Intel also cut its manufacturing capacity planning and engineering teams as part of an efficiency-driven reorganization .
- Recent key products/services: Intel launched new Xeon 6 CPUs for AI workloads (e.g. Xeon 6776P) and is preparing Panther Lake CPUs (PCs) for 2025 . It also began 18A node production in Arizona and sold part of its Mobileye stake (~$922M) to boost liquidity .
Price/sales: Intel (0.80), AMD (10.3), NVIDIA (29.6), QCOM (3.68)
Wrap-Up
Intel's last four years have been marked by a series of structural, competitive, and strategic challenges—ranging from manufacturing delays to margin erosion and intense pressure from rivals like AMD and NVIDIA. Yet, the tide may be turning. With decisive actions like major cost-cutting initiatives, new AI-focused products, and progress in advanced node production, Intel is signaling a strategic pivot. Trading at a deep discount relative to peers based on the price-to-sales ratio, the stock reflects much of the past negativity. For investors seeking a long-term turnaround play in the semiconductor sector, now could be the moment to re-evaluate Intel’s potential.
Let’s see if this chip giant can turn the corner. Cheers!
Pablin

AMD Shares Rise Above $250 Ahead of Earnings ReportAMD Shares Rise Above $250 Ahead of Earnings Report
Today, 4 November, after the close of the main trading session, Advanced Micro Devices (AMD) is set to release its quarterly earnings report and outline its plans for the near future. Market participants remain optimistic, as several key bullish developments last month strengthened confidence in AMD’s role in the AI infrastructure race:
→ AMD shares surged in early October following news of a multibillion-dollar deal with OpenAI.
→ Oracle Cloud chose AMD’s graphics processing units (GPUs) for its new AI supercomputers.
→ IBM announced a breakthrough in quantum computing made possible through the use of AMD chips.
Buoyed by this wave of positive news and high expectations, AMD’s share price climbed above the psychological $250 mark (+61% since early October), reaching a record high.
Technical Analysis of AMD Stock
Price analysis shows that since April, the market has been forming a broad upward channel (shown in blue):
→ Strong news led to the correction phase (shown in red) being replaced by a resumption of the bullish trend in an aggressive manner;
→ Today, AMD’s price is testing the upper boundary of the channel.
The thickened S/R lines indicate that the angle of ascent is becoming steeper. Much now depends on today’s earnings release. Traders are awaiting confirmation from CEO Lisa Su regarding the company’s revenue forecasts tied to new deals amid the ongoing AI boom.
If bold expectations fail to materialise, a pullback could follow:
→ towards the lower thickened support line;
→ or deeper, towards the median line of the upward channel.
Alternatively, we may see the bulls attempt to break above the upper boundary and extend the blue channel higher.
This article represents the opinion of the Companies operating under the FXOpen brand only. It is not to be construed as an offer, solicitation, or recommendation with respect to products and services provided by the Companies operating under the FXOpen brand, nor is it to be considered financial advice.

AMD Bull Flag: Breakout Above 262 Toward 286AMD on the 1D chart remains firmly bullish after its October surge, now pausing in a tight flag beneath the recent swing high at 262. Price is riding above the 20/60/120 MAs with all slopes positive, and Bollinger Bands have contracted after expanding during the rally—classic consolidation behavior. The prior ceiling at 240 has flipped to support, framing a clean structure for continuation.
Primary path: a break-and-close above 262 confirms the bull flag and opens room toward 286, where measured move projections align with the first objective. Traders wanting earlier exposure can stalk dips into the MA20 buy zone at 245–255, but confirmation still matters—strength should be reflected by a daily close reclaiming 250s and then 262. If momentum extends post-breakout, consider trimming into 285–290.
Alternative: if buyers fail to punch through 262, expect further range development between 240–262 while energy builds. The bullish thesis is invalidated on a daily close below 240, which would point to a deeper retrace toward prior October levels; risk should be sized with that line in mind.
Trigger: daily close > 262 (breakout). Targets: 286 first, then manage into 285–290. Invalidation: daily close < 240. This is a study, not financial advice. Manage risk and invalidations.

Be careful with AMD!!! Likely reason for the target increase: Rapid growth in the field of artificial intelligence and strong demand for advanced chips, especially in competition with Nvidia.
So if you pay attention to the AMD chart you can see that the price has formed a Ascending Pennant which means it is expected to price move as equal as the measured price movement.( AB=CD )
NOTE: wait for break of the FLAG .

AMD's Tsunami Hitting $10,000+ | 8-Decade Blueprint🔥 FOR OUR DEDICATED FOLLOWER: The AMD Upside Target Blueprint is HERE! 🔥
You asked for clarity on AMD's path forward. This is for you, and for every trader who wants to see the real roadmap.
We've broken down the 3-week super-chart that tells the whole story. This isn't just about the next 10%; it's about the next 1,000%.
🎯 The Upside Target Hierarchy: From Tactical to Generational
1. The Wave 3 Target (~$1,000 by 2029)
· This is the MAIN EVENT for the next 5 years.
· We are currently inside this massive third wave.
· It is being powered by AMD's undeniable dominance in the AI and high-performance computing revolution.
· This wave represents the 161.8% Fibonacci Extension of the foundational Wave 1. The math is clear.
2. The Ultimate Wave 5 Target (~$10,000+ Beyond 2050)
· This is the generational wealth target.
· It represents the 261.8% Fibonacci Extension and is the final, parabolic peak of this entire 70+ year cycle.
· This is driven by technologies that are still in their infancy: Quantum Computing, AI Singularity, and interplanetary tech stacks .
🧭 The Trader's Compass: Navigating the Now
· Current Mission: Ride Wave 3 to $1,000 .
· Key Support (The Buy Zone): Any pullback toward the $240 - $230 Fibonacci confluence is a gift within the larger uptrend.
· The Catalyst: The AI boom is not a story; it's a fundamental shift . AMD is a primary architect of this new world.
🚨 NOW, WE TURN TO THE COMMUNITY 🚨
Our follower has their blueprint. Now, we turn to you, the TradingView family , to sharpen it.
We're starting a Chart Battle to help our follower see EVERY angle.
👇 THE CHALLENGE IS LIVE: 👇
Drop YOUR AMD chart below and show us:
· Your Wave Count: Do you agree with our ~$1,000 Wave 3?
· Your Targets: What's your ultimate price and timeline?
· Your Best Chart: Post your cleanest, most convincing technical analysis.
The most insightful bull OR bear case gets pinned at the top. Let's build the most comprehensive AMD analysis on TradingView, together.
Let's get it!
#AMD #ElliottWave #SuperCycle #GenerationalTrade #1000AMD #10000AMD #TechInvesting #Stocks #TradingView #Fibonacci #Wave3 #MarketCycle #LegacyWealth

Amd - This is still not over yet!🚀Amd ( NASDAQ:AMD ) can rally another +25%:
🔎Analysis summary:
This month alone, Amd has been rallying another +50%. All of this happened because of an expected rejection at a major confluence of support. Looking at the rising channel pattern though, Amd can still rally another +25% before this rally might actually be over.
📝Levels to watch:
$300
SwingTraderPhil
SwingTrading.Simplified. | Investing.Simplified. | #LONGTERMVISION

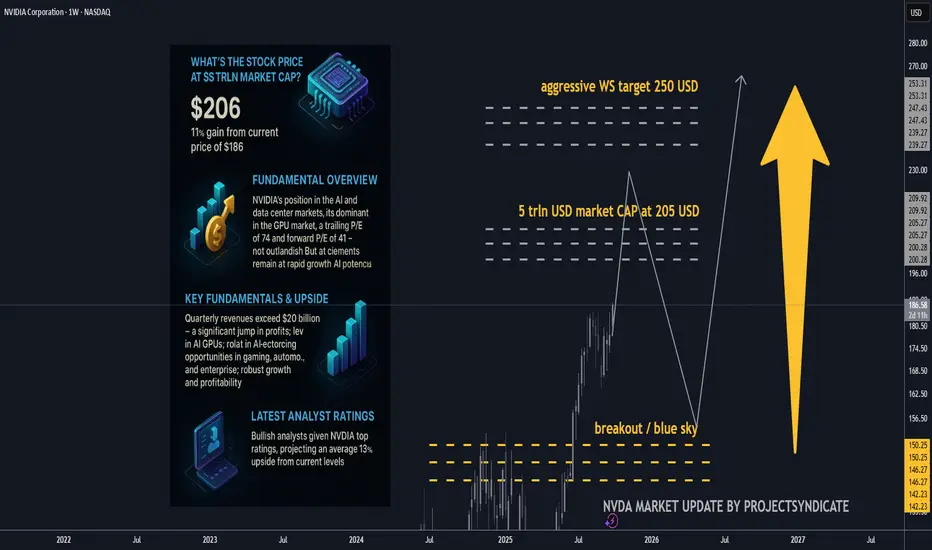
NVDA 5 trln USD market cap up next? Key fundamentals and upside.Is $5T reasonable for NVDA?
• Mechanically, yes: The market only needs ~10% near-term appreciation from today’s levels to print $5T. That’s within one strong quarter or a guidance beat.
• Fundamentally, the math works if (a) FY26–27 revenue tracks the guide/Street trajectory (TTM already $165B with Q3 guide $54B), (b) non-GAAP GMs hover low-to-mid-70s, and (c) opex discipline holds. Under those, forward EPS path supports ~35× at $5T, a premium but not outlandish for a category-defining compute platform.
• Free-cash optionality: With ~$48B net cash and massive FCF, NVDA can keep funding buybacks (already $60B fresh authorization) and capacity, smoothing cycles.
________________________________________
• Stock price at $5T market cap: ≈ $205.8 per share (on ~24.3B shares).
• Gain needed from $186.6: +$19.2 (~+10.3%).
The quick math (market cap ⇒ price)
• Shares outstanding (basic): ~24.3 B (as of Aug 22, 2025, per 10-Q).
• Stock @ $5T market cap: $5,000,000,000,000 ÷ 24.3B ≈ $205.8/share.
• From today’s price $186.6: needs +$19.2 or ~+10.3%.
That also implies P/E (TTM) at $5T of roughly ~56× (using TTM EPS ~3.68). Today’s trailing P/E is ~50–53× depending on feed.
________________________________________
Core fundamentals snapshot 🧩
Latest quarter (Q2 FY26, reported Aug 27, 2025)
• Revenue: $46.7B (+56% y/y; +6% q/q).
• Data Center revenue: $41.1B (+56% y/y).
• GAAP gross margin: 72.4%; non-GAAP 72.7%; Q3 guide ~73.3–73.5%.
• GAAP EPS: $1.08 (non-GAAP: $1.05; excl. $180M inventory release: $1.04).
TTM scale & profitability
• Revenue (TTM): ~$165.2B.
• Net income (TTM): ~$86.6B.
• Diluted EPS (TTM): ~$3.5–3.7.
• Cash & marketable securities: $56.8B; debt: ~$8.5–10.6B ⇒ net cash ≈ $48B.
Capital returns
• $24.3B returned in 1H FY26; new $60B buyback authorization (no expiration). Remaining buyback capacity ~$71B as of Aug 26.
________________________________________
Valuation read (today vs. $5T)
Using widely watched metrics:
• P/E (TTM): ~50–53× today; at $5T it rises to ~56× (assuming flat TTM EPS).
• Forward P/E: Street FY27 EPS ≈ $5.91 → ~31–33× today; ~35× at $5T — still below many AI hyper-growth narratives that trade at 40–50× forward when growth visibility is high.
• EV/EBITDA (TTM): EV ≈ market cap – net cash. Today EV ~$4.45T; EBITDA TTM ≈ $98–103B ⇒ EV/EBITDA ~43–45×; at $5T EV/EBITDA drifts to ~48–50×.
• P/S (TTM): ~27× today (at $4.5T) and ~30× at $5T on $165.2B TTM revenue.
• FCF yield: TTM FCF range $60.9–72.0B ⇒ ~1.35–1.60% today; ~1.22–1.44% at $5T.
Takeaway: $5T doesn’t require a heroic repricing — it’s ~10% above spot and implies ~35× forward earnings if consensus holds. That’s rich vs. the S&P (~22.5× forward) but arguably reasonable given NVDA’s growth, margins, and quasi-platform status in AI compute.
________________________________________
What must be true to justify $5T (and beyond) ✅
1. AI capex “supercycle” persists/expands. Citi now models $490B hyperscaler AI capex in 2026 (up from $420B) and trillions through 2029–30. A sustained 40–50% NVDA wallet share across compute+networking underwrites revenue momentum and margin sustainment.
2. Annual product cadence holds. Blackwell today → Rubin in 2026 with higher power & bandwidth, widening the perf gap vs. AMD MI450 — supports pricing power and mix.
3. Margins stay “mid-70s” non-GAAP. Company guides ~73.3–73.5% near term; sustaining 70%+ through transitions offsets any unit price compression.
4. Networking, software & systems scale. NVLink/Spectrum, NVL systems and CUDA/Enterprise subscriptions deepen the moat and smooth cyclicality; attach expands TAM (improves EV/EBITDA vs. pure-GPU lens).
5. China/export workarounds do not derail mix. Q2 had no H20 China sales; guidance and commentary frame this as manageable with non-China demand and limited H20 redirection.
________________________________________
A contrarian check (where the model could break) 🧨
• Power & grid bottlenecks. Even bulls (Citi) note AI buildouts imply tens of GW of incremental power; slippage in datacenter electrification can defer GPU racks, elongating deployments (and revenue recognition).
• Debt-funded AI spend. Rising share of AI DC capex is being levered (Oracle’s $18B bonds; neoclouds borrowing against NVDA GPUs). If credit windows tighten, orders could wobble.
• Customer consolidation & vertical ASICs. Hyperscalers iterating custom silicon could cap NVDA’s mix/price in some workloads; edge inference may fragment.
• China policy volatility. Export rules already forced product pivots; rebounds are uncertain and not fully in NVDA’s control.
• Multiple risk. At ~50× TTM and >40× EV/EBITDA, any growth decel (unit or pricing) can de-rate the multiple faster than earnings make up the gap.
Bottom line of the bear case: If AI capex normalizes faster (say +10–15% CAGR instead of +25–35%), forward EPS still grows, but the stock would likely need multiple compression (toward ~25–30× forward), making $5T less sticky near-term.
________________________________________
Street positioning (latest bullish calls) 📣
• KeyBanc: $250 (Overweight) — Rubin cycle deepens moat → ~+34% implied upside.
• Barclays: $240 (Overweight) — AI infra wave; higher multiple to 35×. ~+29% upside.
• Bank of America: $235 (Buy). ~+26% upside.
• Bernstein: $225 (Outperform). ~+21% upside.
• Citi: $210 (Buy) — reiterates annual cadence & rising AI capex.
• Morgan Stanley: $206–210 (Overweight). ~+11–13% upside; 33× CY25 EPS framework.
• Consensus: Avg 12-mo PT ~$211, ~+13% from here.
________________________________________
________________________________________
Extra color you can trade on 🎯
• Where bulls may be too conservative:
o Networking/NVLink attach could outgrow GPUs as Blackwell/Rubin systems standardize on NVIDIA fabric, defending blended margins longer.
o Software monetization (CUDA ecosystem, NIMs, enterprise inference toolchains) is still under-modeled in many sell-side DCFs.
• Where bulls may be too aggressive:
o China rebound timing & magnitude.
o Power/real-estate constraints delaying deployments into 2026.
o Credit-driven AI capex — watch for any signs of tightening in private credit / neocloud financing that uses GPUs as collateral.
________________________________________
________________________________________
Sources: NVIDIA IR & 10-Q; Yahoo Finance stats; StockAnalysis (TTM financials); company Q2 FY26 press release and CFO commentary; recent analyst notes from KeyBanc, Citi, Barclays, BofA, Morgan Stanley; financial media coverage (WSJ/FT).
AMD Bullish Breakout: Flag Resolution Toward 278–290AMD on the 1D chart is pausing after a powerful October run from ~170 to above 260, with a clear Bullish Flag forming. The prior swing high near 264.58 is the immediate ceiling. Price holds above all key MAs, with the MA20 around 222.61 acting as nearest dynamic support, while the MA60 aligns with structural support near 183.87. Bollinger Bands remain expanded, and momentum is constructive but cooling—typical of a digestion phase before the next leg.
Primary path: a break-and-daily-close above ~265 with rising volume would confirm the flag and open a push toward the upper band/prior extremes around 278 first, then 290, with a stretch objective near 300 if momentum expands. If buyers don’t get the close, a controlled pullback into 222–225 (MA20 area) could offer a higher-low retest before another attempt higher.
Invalidate the short-term bullish thesis on a daily close below 220. That would shift risk toward the 185 area (183.87) where the MA60 and prior breakout structure converge. Until confirmation, position sizing should remain moderate; if the breakout triggers, trail risk under reclaimed levels to protect gains.
This is a study, not financial advice. Manage risk and invalidations

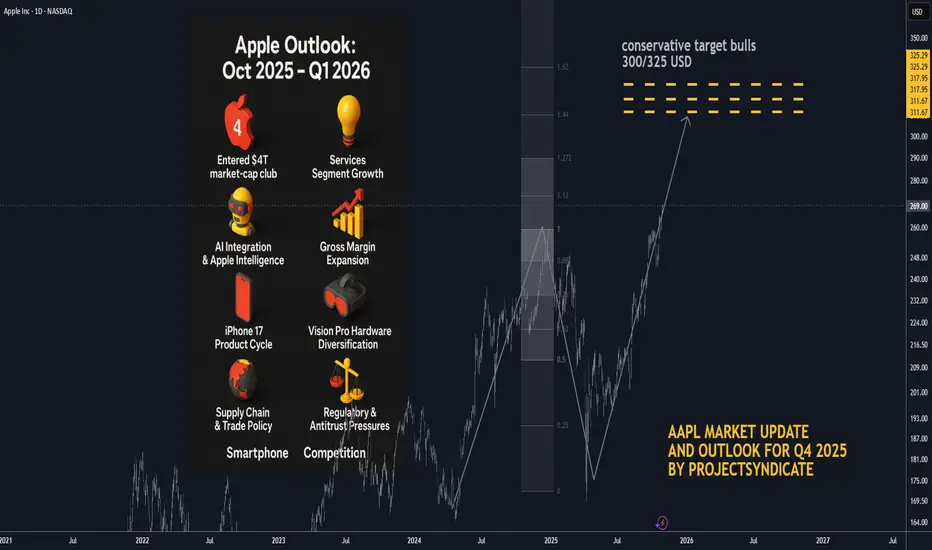
AAPL: Q1 2026 Target and Updated Outlook BULLS🍏 Apple Outlook: Oct 2025 – Q1 2026
🧠 Status and Tape Read. Apple (AAPL) has entered the $4 T market-cap club on Oct 28–29 2025, propelled by strong iPhone 17 sell-through and Services momentum. Shares pushed toward the $270 area intraday before easing, marking a powerful reversal from mid-year consolidation. Near-term, positioning is elevated into Thursday’s print; options imply ~±4% move on earnings.
📈 Path into Q1’26. Our base case shifts from a prolonged correction to a higher-low / buy-the-dip regime: dips toward the mid-$240s–$250s should attract sponsorship unless Services rolls over or China iPhone demand fades. A constructive tape through Q1’26 hinges on (1) Apple Intelligence engagement metrics, (2) iPhone 17 replacement/Android switcher rates, and (3) regulatory overhang.
📰 What’s New and recent headlines
🏆 Apple hits $4 T market value for the first time, joining Nvidia and Microsoft. Drivers: iPhone 17 traction and Services strength; stock up sharply since spring.
🗓️ Earnings set for Thu, Oct 30 (after-close); Street looking for growth in revenue/EPS; Services eyed >$100 B annual run-rate.
🔼 Loop Capital upgraded AAPL to Buy with $315 PT ahead of the move, citing iPhone cycle acceleration.
🧾 “Who Bought 8 Million Shares?”
🧺 JPMorgan Large Cap Growth Fund (SEEGX) increased its Apple position by ~8.15 million shares to ~32.9 million shares, per latest fund tracking.
⚙️ Catalysts Shaping Apple’s Stock Price in 2025–26
🤖 AI Integration & Apple Intelligence — Strength: 9/10
Rollout of on-device Apple Intelligence and upgraded Siri remains the core narrative into 2026. Look for user engagement datapoints and third-party app integrations at/after earnings. A positive read-through would validate the iPhone super-cycle argument.
💡 Services Segment Growth — Strength: 8.5/10
Consensus expects Services to push past a $100 B annual clip; durability watched versus regulatory pressure (DMA in EU, global app store scrutiny). A sustained >13% YoY growth print keeps multiple support intact.
📊 Gross Margin Expansion & Cost Efficiencies — Strength: 8/10
Management has guided 46–47% GM for FQ4 (tariff headwind embedded). Mix shift to Services + component deflation support FY26 margin resilience.
📱 iPhone 17 Product Cycle — Strength: 8/10 (↑ from 7.5)
Early sell-through outpacing prior gen in the U.S. and China within first days; the iPhone 17 (incl. “Air”) is the incremental driver restoring unit momentum.
🥽 Vision Pro & Hardware Diversification — Strength: 7/10
Next-gen devices + Apple Intelligence tie-ins create optionality; still niche near-term but adds ecosystem gravity.
💵 Capital Returns — Strength: 7/10
$110 B buyback authorization remains a floor; watch cadence vs. stock at ATHs and post-print cash deployment commentary.
🌏 Supply Chain & Trade Policy — Strength: 6.5/10
China exposure/tariffs remain a swing factor; Apple has been absorbing some costs rather than pushing through prices on key models.
⚖️ Regulatory & Antitrust Pressures — Strength: 6/10
DMA compliance and global app store cases could trim Services take-rate; monitor any remedial changes called out on the call.
📈 Macro & Rates — Strength: 5/10
“Higher for longer” limits multiple expansion; any disinflation/soft-landing upside would expand P/E support.
🥊 Smartphone Competition — Strength: 5/10
Android OEM velocity still high in EM; Apple’s cycle needs sustained switcher share to outrun.
💼 Earnings Set-Up: FQ4 reporting Thu Oct 30 2025
📅 Consensus into print:
• Revenue: ~$101–104 B (TipRanks ref: $102.2 B)
• EPS: ~$1.74–$1.82 (TipRanks ref: $1.78)
• Gross Margin guide: 46–47% (company indication)
• Services: watch for >$100 B annualized pace confirmation
• Implied move: options pricing ~±4%
🎧 Watch items on the call: Apple Intelligence activation/MAUs, iPhone 17 channel inventory, China mix, Services take-rate headwinds (EU), GM puts/takes (tariffs), cap-return cadence.
🎯 Street Positioning & Targets
🔼 Loop Capital: Buy, PT $315 (Oct 20/21 2025).
📊 General take: Many houses remain Overweight; focus turning to 2026 EPS power and AI monetization path.
🧭 Tactical View 0–3 Months
📈 Into/after print: Choppy but constructive. Chasing at ATHs is risky; prefer buy-on-weakness zones near $248–255 with stop discipline. A bullish guide/Services beat could sustain a breakout; a light AI engagement update or China wobble likely gets faded back into the mid-$250s.
⚠️ Risk-case: Regulatory headline or guide below mid-single-digit growth could quickly compress P/E and retest the $240s.
🚀 Bull-case: Clean beat/raise + AI usage KPIs → re-rate toward $290–300 into holiday.
🏁 Quick Milestone Recap
🥇 $4 Trillion Market Cap achieved on Oct 28–29 2025, making Apple the third public company (after Nvidia, Microsoft) to reach the level; iPhone 17 momentum and Services strength cited across coverage.
BUY AMD!!!!Approaching a significant level where we can expect AMD to complete this bearish cycle and begin a bullish cycle. Partial Profits at All-Time-Highs.

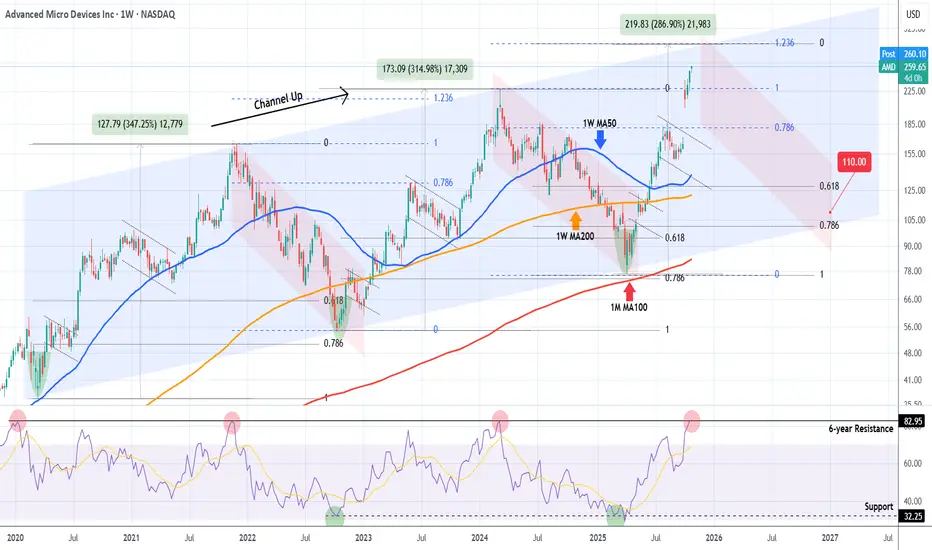
AMD Is it approaching a multi-year top and turning into a Sell ?Almost 8 months ago (March 07, see chart below) we made a bold call (for the time) on Advanced Micro Devices (AMD), expecting it to bottom on its 1M MA100 (red trend-line) and then rebound, targeting $320:
Well the Bullish Leg of its 6-year Channel Up had been even more aggressive than we expected and is already approaching its top (Higher Highs trend-line), much earlier than we expected.
This is technically the right time to book the amazing +240% profits from the April 07 bottom, as the 1W RSI just hit its 6-year Resistance, which has marked the Channel's two Tops.
Even though the Bullish Leg can technically extend as high as +287% on the 1.236 Fibonacci extension (like the previous did), the focus of a long-term investor should now be to buy (much) lower, preferably as close to the 1M MA100 as possible.
The last two Higher Lows of the Channel Up have been priced just above the 0.786 Fibonacci retracement level, so our fair long-term Target is currently at $110.00.
So do you also think AMD is approaching the end of the (long-term) road and is gradually turning into a Sell?
-------------------------------------------------------------------------------
** Please LIKE 👍, FOLLOW ✅, SHARE 🙌 and COMMENT ✍ if you enjoy this idea! Also share your ideas and charts in the comments section below! This is best way to keep it relevant, support us, keep the content here free and allow the idea to reach as many people as possible. **
-------------------------------------------------------------------------------
💸💸💸💸💸💸
👇 👇 👇 👇 👇 👇
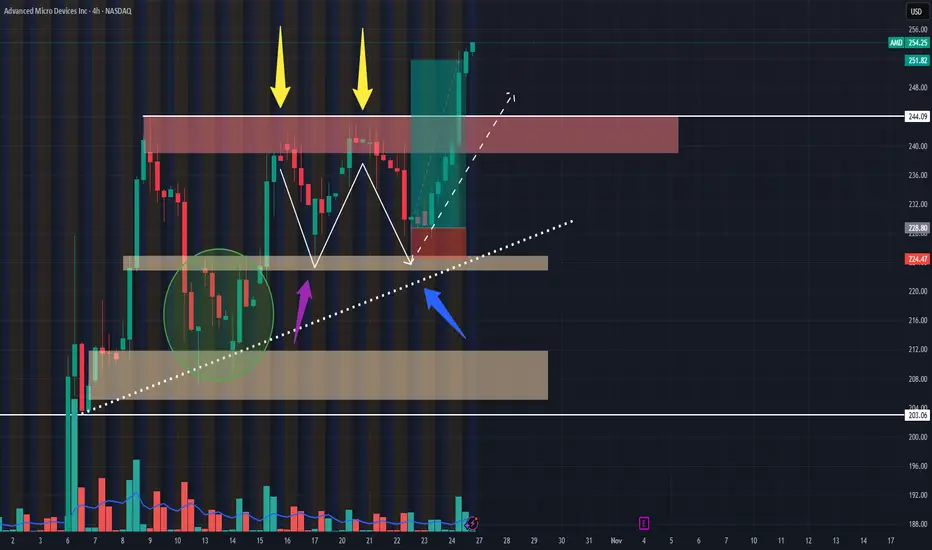
AMD Went Crazy!!! Post Trade Analysis 10/25/24Hello all,
This is my first time posting on here. So, please feel free to leave any questions, advice, or anything else in the comments!
I took this AMD swing trade on the 10/22/25 @ 2:12ish PM CST.
POSITION:
1 $300 Strike Call Exp Nov 7th 2025
Risk: $30 (price takes out low of hammer candle)
Initial PT: Previous highs (Red box) for $75 profit
Final PT: Actively managed since price moved past previous highs ($144 final profit)
WHY I TOOK THE TRADE
1. From the 7th-23rd AMD looked to be forming an ascending triangle pattern on the 1 day and 4HR timeframe.
2. AMD validated 2 support areas to me, which was an ascending support line (Blue arrow) and a demand zone from $222.92 to $225.11 (Purple arrow). In addition to this, price recently broke out from a W pattern (Green bubble) around 10/14 on the 1-4HR time frame (wish I saw it forming sooner lol), which confirmed to me that there was still momentum for the upside.
3. I saw that AMD was potentially forming another larger W pattern on the 1-4HR timeframes (Yellow arrows).
ENTRY Rules:
1. Measure Risk to Reward position, if less than 1.8 to 2.5 R/R, don't take the trade.
2. Wait for price to pull back to area of value (confirmed by multiple touch points.
3. Wait for a strong bullish candle to close 60% or above previous bearish candle (at the demand zone level), to confirm potential price reversal; then enter on the open of the very next candle.
4. Place SL where price invalidates analysis (below bullish hammer candle and demand zone), and PT at most recent highs (or actively manage if price pushes to the upside with momentum).
SUMMARY:
I am glad I took this trade, because it I am still relatively new to trading and I am improving on following my trade plan and TA more.
If anyone has any comments or feedback I would love to chat!
Thank you!
October’s top stock performers: #AMD, #Amazon, #Tesla & moreIn October, FreshForex clients most frequently traded stocks like #AMD, #Amazon, #GoDaddy, #Tesla, and #Moderna — and these very assets showed the highest share of profitable trades. Capitalize on strong demand momentum and high liquidity: with earnings season and the holiday rush ahead, the “window of opportunity” is still open.
Outlook through the end of 2025:
#AMD: Shares could rise following the $6B AI compute deal with OpenAI and Oracle’s reported order of 50,000 next-gen MI450 chips.
#Amazon: Strong earnings on October 30, solid AWS growth, advertising contributions, and the fall Prime Big Deal Days may keep the stock bullish.
#GoDaddy: Stock may face pressure if SMB ARPU/inflows slow, plus FX headwinds could dampen August’s raised full-year guidance.
#Tesla: Growth potential supported by record 497K deliveries, 12.5 GWh energy deployments in Q3, and expansion of FSD v14 (Supervised).
#Moderna: Stock remains under pressure amid limited revenue visibility, delayed UK shipments, and postponed approval of its flu+COVID combo vaccine to 2026.
According to FreshForex analysts, the outlook for these stocks remains driven by AI investments and seasonal demand. But the strongest growth impulse is likely in Q1 2026, especially if the Fed eases policy and announced tech projects go live.
