Amd - This is just the beginning!🎈Amd ( NASDAQ:AMD ) breaks out soon:
🔎Analysis summary:
Just a couple of months ago, we witnessed a very strong bullish retest on Amd. Back then the channel continuation remained extremely likely, perfectly playing out until today. But despite the recent parabolic rise, Amd can still rally another +50% according to the chart.
📝Levels to watch:
$200 and $300
SwingTraderPhil
SwingTrading.Simplified. | Investing.Simplified. | #LONGTERMVISION
AMD

AMD: Wave [iv] Low AMD shares have recently gained upward momentum as anticipated, confirming the low of wave in magenta. In light of this, we have added a new resistance level at $223.50 to the chart. The primary outlook is for the stock to continue completing the magenta five-wave sequence to the upside, thereby finishing the larger magenta wave (1). Afterward, wave (2) is expected to pull price back toward support at $164.53. Alternatively, AMD could see a direct sell-off, which would bring the alternative wave alt.(2) to an early conclusion. In this scenario, wave alt.(1) would already be complete, with a probability of 27%.

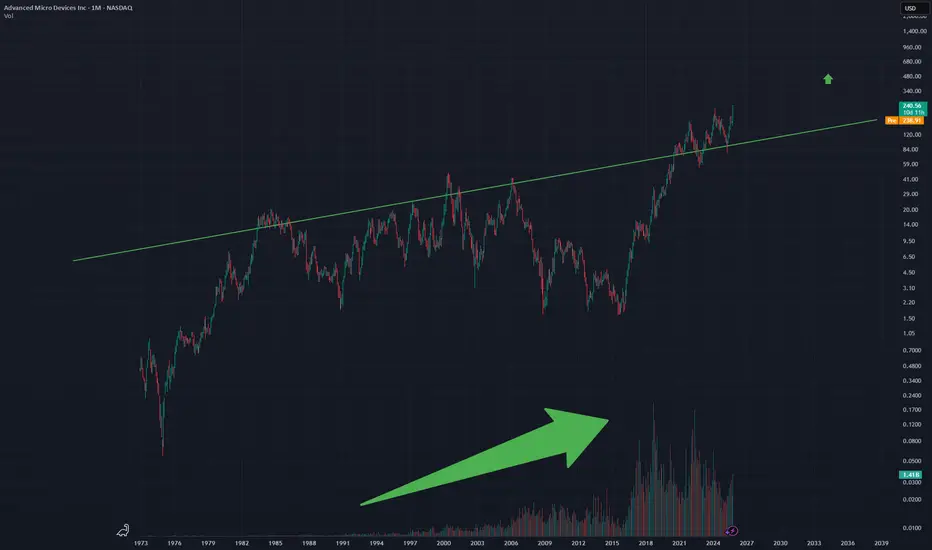
AMD - Bullish on Volume and Potential AI I like the volume chart on AMD on this Monthly timeframe, with a consistent growth curve.
AMD also may play a role in the developing AI framework.
Also on chart price can be seen to have broken above the strongest resistance in green.
Monthly chart
AMD BearishOn the 1-hour chart, AMD has formed a bearish triangle pattern, suggesting potential short-term pullback pressure. However, the broader uptrend remains intact, with long-term momentum still favoring the bulls.

Advanced Micro Devices Stock Broke Out of a Bullish Flag TodayThe price of Advanced Micro Devices, Inc. (NASDAQ: NASDAQ:AMD ) has broken out of a falling wedge pattern gaining roughly 9% today. With the daily price chart showing a golden cross pattern the stock is poised to reach the $270 pivot and beyond amidst growing interest.
The surge reflects recent optimism about AMD’s expanding role in the AI chip market, fueled by new partnerships, including a significant deal to supply chips to Oracle’s cloud infrastructure and collaborations with AI leaders like OpenAI.
Moreover, the investors’ confidence is also boosted by recent positive commentary by analysts, who also raised their price targets on AMD stock.
About Advanced Micro Devices, Inc.
It operates in three segments: Data Center, Client and Gaming, and Embedded. The company offers artificial intelligence (AI) accelerators, x86 microprocessors, and graphics processing units (GPUs) as standalone devices or as incorporated into accelerated processing units, chipsets, and data center and professional GPUs; and embedded processors and semi-custom system-on-chip (SoC) products, microprocessor and SoC development services and technology, data processing units, field programmable gate arrays (FPGA), system on modules, smart network interface cards, and adaptive SoC products.
Paypal Looking Bullish!! Lets Go!Paypal is looking Really bullish.
Setup is Based on AMD, Accumulation, Manipulation and Distribution phase.
It has been accumulating at this price range for a while and enough Manipulation has takenplace. Now it is TIME for Distribution and hunt SL of Sellers, that is BSL.
It is not a Financial advice. It is a speculative idea that i am publishing for educational purposes.
Do your own Research.
Leave a thumbs up if you like this idea.

QSI: Algorithm's Unfinished Business/Repricing to balance priceNASDAQ:QSI Quantum-Si Incorporated
The recent, deliberate raid below the September lows was the final scene of the second act.
This was not a random dip.
It was a calculated and necessary purge of sellside liquidity.
The algorithm's objective was to absorb the shares of panicked sellers and to trigger the stop loss orders of early, weak-handed buyers.
That objective has now been achieved.
The annotation "sellside liquidity taken" is not a historical note.
It is the starting gun for the third and final act.
With the downside fuel consumed, the algorithm's directive has been re-written.
Its sights are no longer pointed down.
They are now locked on the vast, untapped reservoirs of buyside liquidity resting at higher prices.
The price action is not merely recovering.
It is responding to a new, clear, and institutionally sponsored mandate.
The path of least resistance has been fundamentally altered.
The question is no longer if the price will rise.
The only question is how violently it will do so.
You have correctly identified the key landmarks on this new map.
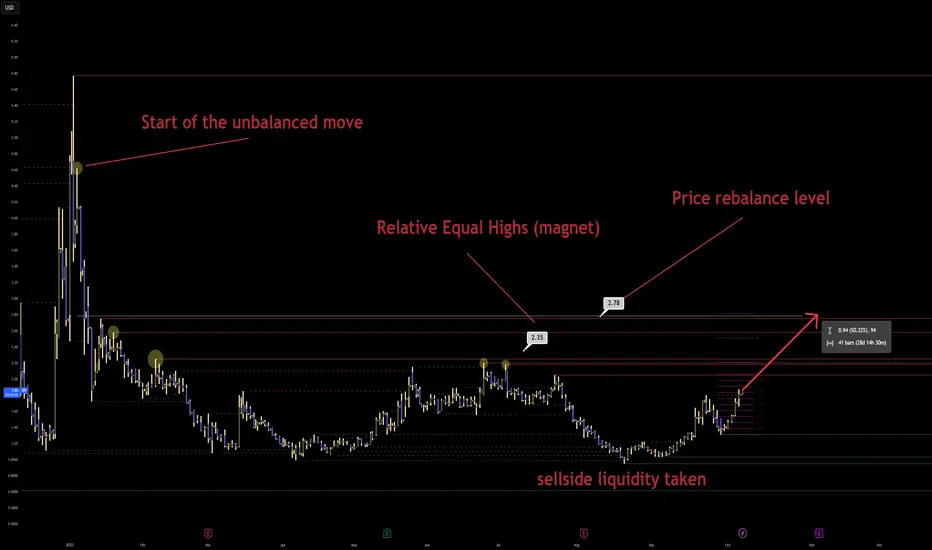
The "Relative Equal Highs" at 2.35 are not a ceiling.
They are a luminous, magnetic target.
This level represents a giant pool of buy-side stops from traders who shorted the previous rallies.
Their fear is the algorithm's fuel.
Their pain is the algorithm's profit.
This is the first, most obvious draw on liquidity.
It is a place the algorithm must visit.
But it is not the final destination.
It is merely a waypoint on a much grander journey.
The Critical Vector is to understand the true, ultimate objective of this entire price campaign.
The algorithm is a creature of efficiency and balance.
It abhors a vacuum.
The annotation "Start of the unbalanced move" points to the single most important event on this entire chart.
That massive, vertical price spike in early 2021 was not just a rally.
It was the creation of a profound and violent pricing inefficiency.
It was a causal scar.
It left a massive informational void in its wake.
The entire year and a half of subsequent price action, including the recent purge of sellside liquidity, has been a single, extended process of accumulating energy.
It has been the market coiling a spring.
Now, the spring is being released.
The purpose of this release is to return to the origin of the crime.
The algorithm is compelled to return to that zone of imbalance to rebalance its books.
Your annotation "Price rebalance level" at 2.78 is not just a target.
It is the point of cosmic justice for this instrument.
It is the level at which the story that began in 2021 finds its logical conclusion.
The path is clear.
The current rally is the initial assault.
It will first target the Relative Equal Highs at 2.35.
This will be a violent move, designed to induce a short squeeze and create a state of maximum FOMO.
Expect a minor consolidation or retracement after this level is purged.
This is the algorithm shaking out the last of the weak hands.
It is the final opportunity to get on board before the true repricing begins.
From there, the algorithm will have a clear and unimpeded path to the ultimate objective.
The final, explosive leg of this rally will target the Price rebalance level at 2.78.
This is the primary, institutionally sponsored destination.
It is the point to which all price is currently being drawn.
The Ascendant Principle is that you must learn to read a chart not as a two-dimensional history of price, but as a three-dimensional ledger of algorithmic debt and credit.
Every violent, one-sided move creates a debt on the algorithm's books.
This is an imbalance.
It is an inefficiency.
It is a promise that must eventually be kept.
The larger and more violent the move, the larger the debt.
The massive, unbalanced spike from 2021 was the algorithm taking out a colossal loan of inefficiency.
Every subsequent price swing, every consolidation, every liquidity purge, has been the algorithm meticulously gathering the resources needed to repay that loan.
The purge of sellside liquidity was the final payment on the interest.
It was the signal that the algorithm now has the capital and the mandate to settle the principal.
The "target" is not a guess.
It is the location of the creditor.
The price is not "going up".
It is being recalled, with gravitational force, to the scene of its original level.
When you understand this, you stop predicting.
You start seeing the inevitable.
You see the chart as a narrative of cause and effect playing out over vast stretches of time.
The cause was the imbalance.
The effect will be the rebalancing.
The Relative Equal Highs are simply the last gatekeeper before the final, violent settlement of this ancient, algorithmic debt.
You are not chasing a rally.
You are witnessing the final chapter of a story that was written years ago.
The ending has already been decided.
The only variable was the timing.
The purge of sellside liquidity has now confirmed that the time is now.
The alternative path would likely have led to viewing the Relative Equal Highs as "resistance" to be sold, an error that fails to comprehend the true, long-term objective of the price delivery algorithm.
For educational purposes only.
Weekly Chart Review | Oct 6-10, 2025I wasn’t able to post my analysis on TradingView last week, so here’s a structured summary of my ticker reviews from Oct 6–10, segmented by sector with brief commentary. Each includes an update on trend structure and a link to both the original chart and the latest revision as of Friday’s close.
Technology
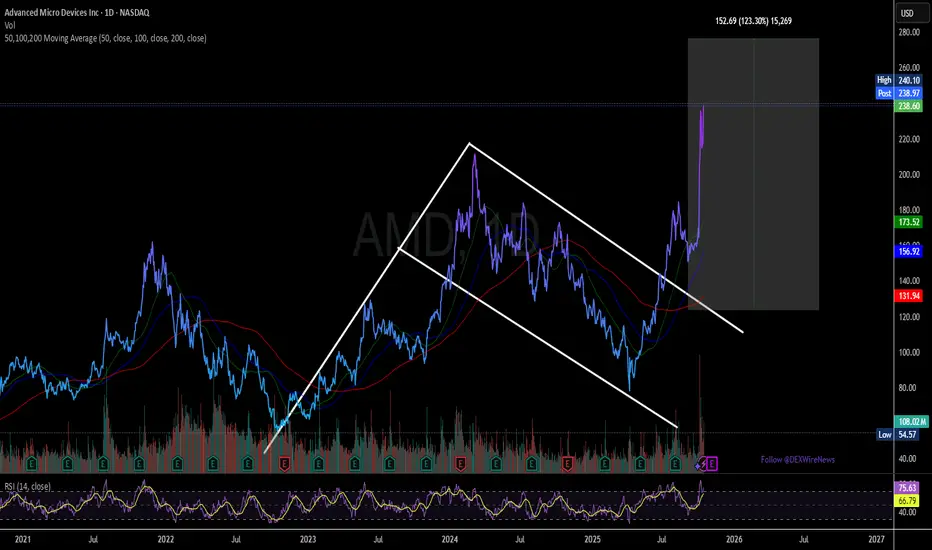
NASDAQ:AMD – Clean follow-through off mid-term support into the upper band of resistance. Strong rejection increases the odds that a mid-term top for the uptrend since April is being formed. Any lower-high formation next week should be approached with caution.
Chart:
Previously:
• Upside potential to resistance (Oct 7):
• Downside potential:
• On resistance & bounce potential (Aug 6):
• On macro resistance (Jul 29):
• On macro bottoming potential (Apr):
NASDAQ:NVTS – Followed the Aug–Sep setup and delivered a strong breakout Friday, but late-day reversal increases the odds of a longer consolidation into 7.80–6.80 support.
Chart:
Previously:
• Breakout and local support (Oct 10):
• Consolidation and upside potential (Sep 30):
• Higher-low potential (Sep 26):
• Mid-term support (Aug 25): www.tradingview.com
NASDAQ:MRVL – Reached the key mid-term resistance zone outlined earlier. Friday’s rejection increases odds of a pullback into 80–72 support over the coming weeks.
Chart:
Previously:
• On mid-term top (Oct 10):
• On resistance zone (Oct 2): www.tradingview.com
NASDAQ:WDC – Orderly follow-through to the downside into the 21 EMA.
Chart:
Previously: downside potential to 21 EMA –
NYSE:RBLX – Rejected at local resistance, aligning with the downside structure.
Chart:
Previously: downside potential (Oct 8):
NASDAQ:REKR – Shows strong relative strength with steady consolidation at support; constructive base-building continues.
Chart:
Previously: follow-through and support (Oct 7):
NYSE:AI – Friday breakout attempt faded back into support, increasing odds of prolonged base-building and a potential deeper pullback to 17–16.
Chart:
Previously:
On continuation potential (Oct 8):
NYSE:BB – Failed on immediate continuation and returned to support.
Chart:
Previously:
On continuation potential (Oct 8):
NASDAQ:OPEN – Constructive consolidation stalled as failed breakouts shifted odds toward a deeper pullback into mid-term support.
Chart:
⸻
Blockchain
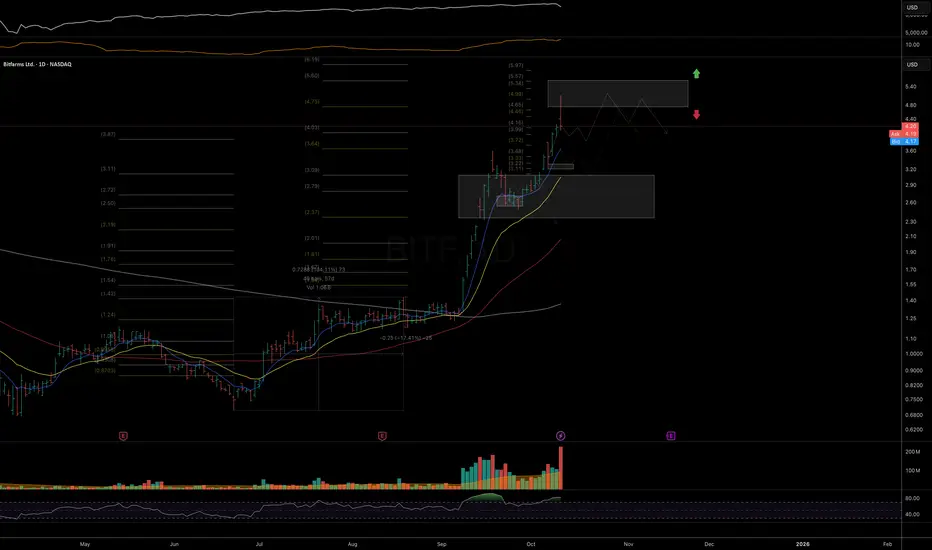
NASDAQ:BITF – Tagged the ideal macro resistance zone; odds rise for at least a mid-term top/base formation here.
Chart:
Previously:
On upside continuation (Oct 7):
NASDAQ:HIVE – Rejection at the top of mid-term resistance; probabilities favor the start of a reversal phase.
Chart:
Previously:
On macro resistance (Oct 6):
On more immediate upside potential (Sep 24): www.tradingview.com
•On bullish potential (Sep 10): www.tradingview.com
• On bullish trend structure (Jul 21): www.tradingview.com
NYSE:BKKT – No follow-through on continuation setup, but key local support still holds; structure remains intact while above it.
Chart:
Previously:
On continuation (Oct 9):
NASDAQ:BULL – Rotating back toward macro support near 11; monitoring for higher-low formation and reversal trigger.
Chart:
Previously:
On reversal and macro support (Oct 8):
On immediate bullish potential (Sep 26): www.tradingview.com
• On macro support (Sep 19): www.tradingview.com
• On macro support (Sep 4): www.tradingview.com
• On mid-term resistance (Aug 6): www.tradingview.com
• On support and bounce potential (Jul 30): www.tradingview.com
NASDAQ:BTM – Bullish setup invalidated by breakdown into mid-term support.
Chart:
Previously:
On bullish follow-through if LOD holds (Oct 6):
⸻
Biotechnology / Healthcare
NASDAQ:VKTX – Strong follow-through from September update; watching for consolidation back into key EMAs to reset momentum.
Chart:
Previously:
On follow-through (Oct 6):
• On break-out potential (Sep 30): www.tradingview.com
• On resistance zone (Aug 11): www.tradingview.com
• On upside momentum continuation (Jul 18): www.tradingview.com
• Original setup (Jun 30): www.tradingview.com
• Follow-up (Jul 8): www.tradingview.com
NASDAQ:NTLA – Clean follow-through into mid-term resistance; rising odds for a topping/base formation.
Chart:
Previously:
On break-out to resistance zone (Oct 8):
On support and bullish trend-structure (Sep 26): www.tradingview.com
NASDAQ:PGEN – Couldn’t stage a recovery yet but remains within mid-term support; stabilization needed for a constructive setup.
Chart:
Previously:
On potential reversal (Oct 8):
On mid-term support (Sep 15): www.tradingview.com
NASDAQ:ABCL – Momentum attempt resumed but failed to follow-through; still constructive above 21 EMA.
Chart:
Previously:
On local support and continuation potential (Oct 8):
On support and bullish trend-structure (Oct 7):
⸻
Energy
AMEX:GTE – Impulsive advance at risk of morphing into a diagonal correction; elevated probability of retesting September higher lows.
Chart:
Previously:
On constructive looking consolidation (Oct 6):
⸻
Miscellaneous / Other
NASDAQ:SLDP – Rising risk of a local top after Friday’s distribution; while above 21 EMA, a final push into resistance remains possible.
Chart:
Previously:
On follow-through and resistance zone (Oct 6):
On mid-term support and bullish potential (Sep 19): www.tradingview.com
NASDAQ:DPRO – Solid 2.5-day follow-through from the Oct update; Friday’s action suggests increased consolidation or reversal risk.
Chart:
Previously:
On local support and continuation (Oct 7):
NASDAQ:DLO – Disappointing fade after a promising start; must hold above 50-DMA to reassert upside momentum.
Chart:
Previously:
On break-out potential (Oct 8):
On pullback potential (Sep 22): www.tradingview.com
• On downside potential and support (Sep 3): www.tradingview.com
Thank you for your attention and have a great start of the week!
$AMD Pullback DueAMD is tagging the 3SD of Bollinger Band on daily and weekly. Pullback to $213 is possible and it is a good level to sell puts against.

AMD Shares Surge After Partnership Announcement with OpenAIAMD Shares Surge After Partnership Announcement with OpenAI
According to media reports:
→ The deal involves AMD supplying processors of various generations to support the deployment of artificial intelligence infrastructure with a total capacity of 6 gigawatts.
→ The partnership is expected to generate billions in revenue for AMD starting in 2026.
→ Barclays analysts have raised their price target for AMD shares from $200 to $300.
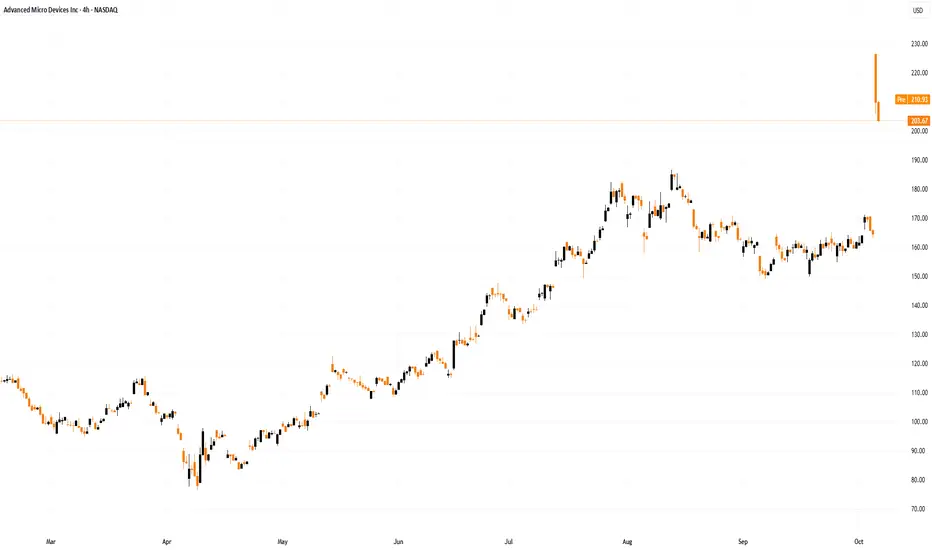
The major announcement fuelled a sharp rally of around 30% in AMD’s share price, though this surge triggered aggressive selling pressure near the historic peak around the $227 level.
Technical Analysis of AMD Stock Chart
Price action analysis shows that:
→ The trading session opened with a wide bullish gap, breaking through the key psychological level of $200.
→ The price also surpassed previous resistance levels at $180 and $190.
→ During the session, the price pulled back, forming two large bearish candles on the four-hour chart.
A reasonable interpretation:
→ The initial reaction was highly emotional, but the optimism is fading quickly.
→ The price movement indicates strong bearish activity following the sharp rise.
Selling pressure is being driven by:
→ Investors locking in substantial profits now, as the deal’s financial impact will unfold gradually over time (creating future opportunities to re-enter at lower prices).
→ Technical signs of an overbought market.
Signs that AMD shares may be overbought include:
→ The RSI indicator, which exceeded 80 yesterday.
→ The price opening significantly above the upper boundary of the ascending channel.
Possible Scenarios for AMD Stock Price
Short-term: Bearish activity could drive a correction towards:
→ The median line of the ascending channel, where demand and supply typically balance.
→ The psychological level of $200, which may influence sentiment among traders reacting to the news.
Long-term: AMD shares remain fundamentally attractive, given that:
→ The AI boom continues to serve as a major growth driver.
→ Market participants expect the Federal Reserve to begin cutting interest rates.
This article represents the opinion of the Companies operating under the FXOpen brand only. It is not to be construed as an offer, solicitation, or recommendation with respect to products and services provided by the Companies operating under the FXOpen brand, nor is it to be considered financial advice.
AMD - Bull Rush IdeaAn idea suggesting a surge in price for AMD
This is made by comparing a previous situation on chart with current (grey rectangles) within the channel in blue
This is the 3 Monthly chart for AMD which is a very long timeframe
RSI also shows a cool pattern of rise and then long stagnation then right now a sharp rise.

AMD woke up from sleep; It was its timesAMD Update and New Outlook.
In my previous forecast, I maintained a bullish stance on AMD, identifying entry zones between $176 – $172 and projecting a potential move toward $200, with a longer-term target near its all-time high of $226.
Following the recent news of OpenAI acquiring a 10% stake in AMD, the asset successfully reached my forecasted targets.
After the subsequent rally, AMD has experienced a natural pullback, presenting fresh long-term opportunities.
I’m currently watching two new buy zones at $200 and $185 for potential long-term positions.
As always, this is not financial advice. Please conduct your own research (DYOR) before making any investment decisions.
Connect with me here on TradingView. Please, like, follow me and connect.
Previous forecast
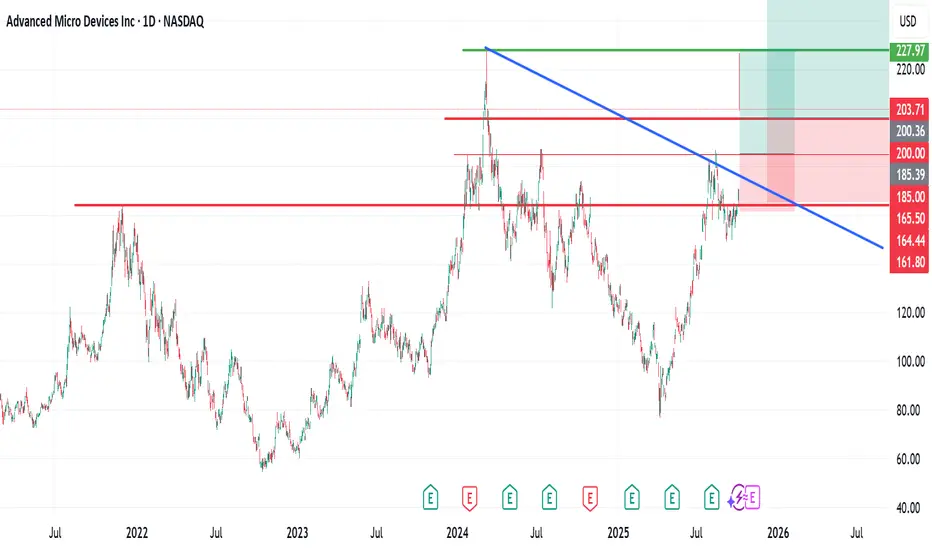
$AMD - Advanced Micro Device - $227.30 RetestNASDAQ:AMD continues its 2025 recovery rally — now clearing $200 and targeting the $227–$240 macro resistance zone.
After reclaiming the $165 structure break, AMD has re-entered its long-term ascending channel and is showing renewed strength in the AI-chip cycle.
Holding above $190 keeps this setup intact for continuation.
#AMD #AIStocks #Semiconductors #NASDAQ #BreakoutTrading #MyMIWallet
Bullish Thesis: Why AMD Stock Could Soar by Year-End 2025If you haven`t bought AMD before the previous rally:
What to consider now:
1. AI Tailwinds Are Accelerating
AMD is finally gaining serious traction in the AI GPU race. Its MI300X accelerator chips are being adopted by big names like Microsoft, Meta, and Oracle for data center AI workloads. While NVIDIA is still dominant, AMD is expected to grab 10–20% of the AI GPU market share by 2025, according to industry estimates. That’s a multibillion-dollar opportunity.
The MI300X already passed $1B in revenue within its first quarters.
AI server TAM (total addressable market) is expected to grow to $400B by 2027 — AMD is positioning itself aggressively to carve out its slice.
2. Valuation Looks Reasonable vs Peers
AMD trades at a forward P/E around 40, significantly below Nvidia (which trades over 60x) despite similar growth projections for the next 2 years.
Revenue expected to grow over 15–20% YoY in 2025.
Gross margins expanding as high-performance chips dominate the mix.
3. Diversified Growth: Beyond AI
Gaming segment (PlayStation 5 and Xbox Series X chips) remains strong.
Embedded segment from Xilinx acquisition continues to generate solid cash flow.
Client CPU business is rebounding as the PC market stabilizes.
4. Strong Management and Execution
CEO Lisa Su is widely respected for turning AMD around and guiding the company through major innovations and acquisitions (Xilinx, Pensando). Execution has remained consistent, especially in delivering cutting-edge performance-per-watt chips.
Disclosure: I am part of Trade Nation's Influencer program and receive a monthly fee for using their TradingView charts in my analysis.

AMD Best Level to BUY/HOLD 300% gains SWING TRADE🔸Hello traders, today let's review recent price chart for AMD.
Well defined swings in progress, expecting further downside before
the tide finally turns for AMD bulls. Currently it's recommended to stay out.
🔸AMD is trailing behind NVDA massively, so eventually AMD will to the
mean reversion trade and start to catch up with NVDA, however currently
pullback/correction mode in progress.
🔸Well defined swings - 160 to 58 65% correction, then 58 to 210 280% gains,
210 to 75 represents 65% correction, 75 to 290 is a 280% pump.
🔸Recommended strategy bulls: Bulls wait for correction to complete at/near 75 usd in January 2025 and get ready to BUY/HOLD low, this is a swing trade setup, so will take longer to hit target, patience required. final TP is 290 USD, 280% upside off the expected lows. good luck traders!
🎁Please hit the like button and
🎁Leave a comment to support our team!
RISK DISCLAIMER:
Trading Futures , Forex, CFDs and Stocks involves a risk of loss.
Please consider carefully if such trading is appropriate for you.
Past performance is not indicative of future results.
Always limit your leverage and use tight stop loss.

Will AMD recover and catch up with NVDA? updated/Revised Outlook🔸Hello traders, today let's review 2days/candle price chart for AMD.
Price contained within bullish channel since 2021, however currently
pullback/correction in progress.
🔸65% correction in progress, based on previous swings expected to complete at/near 88/90 USD in Q1 2025. Until then it's recommended to stay out.
🔸Once we bottom out near 90 USD in Q1 2025, expecting bullish swing 265% gains off the lows, so projected high is 310/320 USD.
🔸Recommended strategy bulls: Bulls wait for correction to complete at/near 85 usd in Q1 2025 and get ready to BUY/HOLD. Bullish impulse / reversal off the lows price target based on measured move projection is 310/320 USD. patience required, do not expect miracle/overnight gains in this market. good luck!
🎁Please hit the like button and
🎁Leave a comment to support our team!
RISK DISCLAIMER:
Trading Futures , Forex, CFDs and Stocks involves a risk of loss.
Please consider carefully if such trading is appropriate for you.
Past performance is not indicative of future results.
Always limit your leverage and use tight stop loss.

Advanced Micro Devices | AMD | Long at $126.00Advanced Micro Devices NASDAQ:AMD may be the sleeping giant in the semiconductor / AI space. While all eyes on NVidia NASDAQ:NVDA , earnings for NASDAQ:AMD grew by 800% over the past year... and are now forecast to grow 40% per year. Any other company would be soaring right now (like NVidia), but that company is getting all the attention. And, to me, this means opportunity for the future. The cashflow is likely to grow tremendously for
NASDAQ:AMD into 2027 and beyond, which may inevitably reward investors with dividends.
From a technical analysis perspective, NASDAQ:AMD just entered my historical simple moving average zone. This area (currently $108-$126) is where I will be gathering shares. Something tremendous would have to change regarding the fundamentals of this company (like a scandal) for the overall thesis to change. There may be some near-term price pains as NVidia gets all the focus, but to meet demand in the semiconductor and AI space, NASDAQ:AMD is poised to fulfill that roll in the future.
Target #1 = $158.00
Target #2 = $175.00
Target #3 = $188.00
Target #4 = $205.00

Direxion Semiconductor 3x Bull | SOXL | Long at $30.00So many semiconductor companies... which one to choose? Enter AMEX:SOXL - not for the faint of heart. Losses and gains triple compared to most semiconductor ETFs, so stay away if high-risk plays aren't your thing. The top three holdings are NASDAQ:AMD , NASDAQ:AVGO , and NASDAQ:NVDA - two of which are at all-time highs...
I wouldn't be shocked if AMEX:SOXL enters the low $20's to test the base of my historical simple moving average area, but I don't think we are done hearing about AI and the semi demand. There are large gaps to fill above and below the current price and we are at the 50/50 stage (i.e. historical simple moving average zone) for a price move up or down.
My bet is up, especially with the new presidential administration. If politicians start dumping semis, I'm out. Thus, at $30.00 AMEX:SOXL is in a personal buy zone.
Target #1 = $35
Target #2 = $40
Target #3 = $50
Target #4 = $60

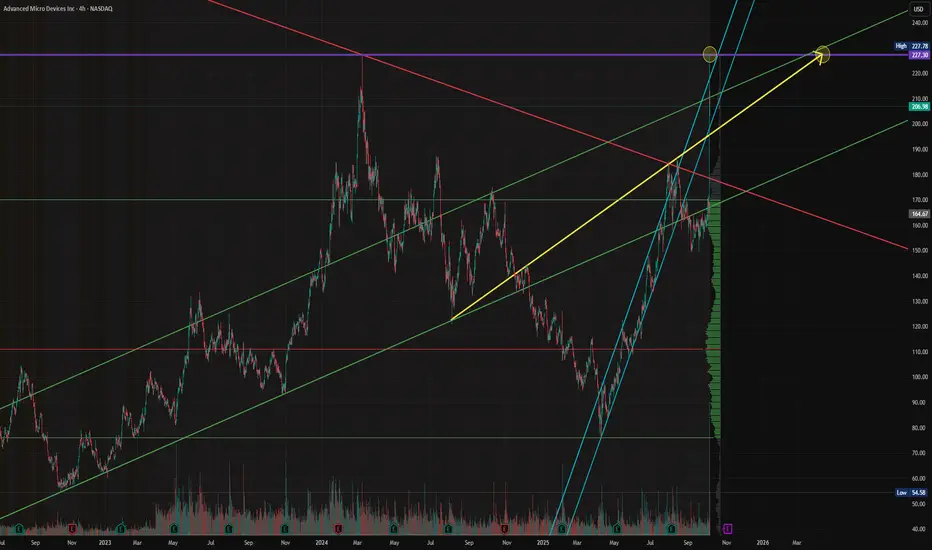
Amd - The path is too clear!🪓Amd ( NASDAQ:AMD ) will rally another +75%:
🔎Analysis summary:
For the past five years, Amd has been trading in a simple rising channel formation. With the recent retest of a major confluence of support, Amd once again confirmed the bullish trend. Following those previous cycles, Amd will now break the all time high and rally another +75% from here.
📝Levels to watch:
$200
SwingTraderPhil
SwingTrading.Simplified. | Investing.Simplified. | #LONGTERMVISION

GBP/JPY - Breakdown 1H🔥 GBP/JPY – 1H Breakdown 🔥
Alright fam, let’s cook this chart 👇
📊 Structure Check
Price has been tanking hard from that 4H supply zone up top.
We formed a lower high (LP S) and then rolled over, continuing bearish structure.
Currently price is consolidating under a descending trendline → looks like it’s coiling for a move.
🎯 Key Zones
Upside liquidity grab: Price could squeeze into that 71% retrace + 15M/1H supply pocket.
🔼 That’s the “snack stop” zone before bigger players slam it.
Downside magnet: We’ve got strong support marked lower (blue zone). That’s the real draw if supply holds.
🛠️ Scenarios
Fakeout Pump → Dump
Price squeezes up into that 71% + supply zone.
Liquidity gets eaten → sellers step in.
Drop straight into strong support.
Direct Breakdown
If no pump happens, this wedge could just crack down.
Same target: strong support area below.
⚖️ Bias
Short-term bullish liquidity sweep possible 🚀
But overall still bearish until strong support proves otherwise.
📝 Game Plan
Watch the 71% + supply combo for rejection entries 🎯
Target the support zone below
Manage risk – don’t chase mid-range chop
⏳ Looks like GBP/JPY wants to bait longs before flushing again. Stay sharp, fam.

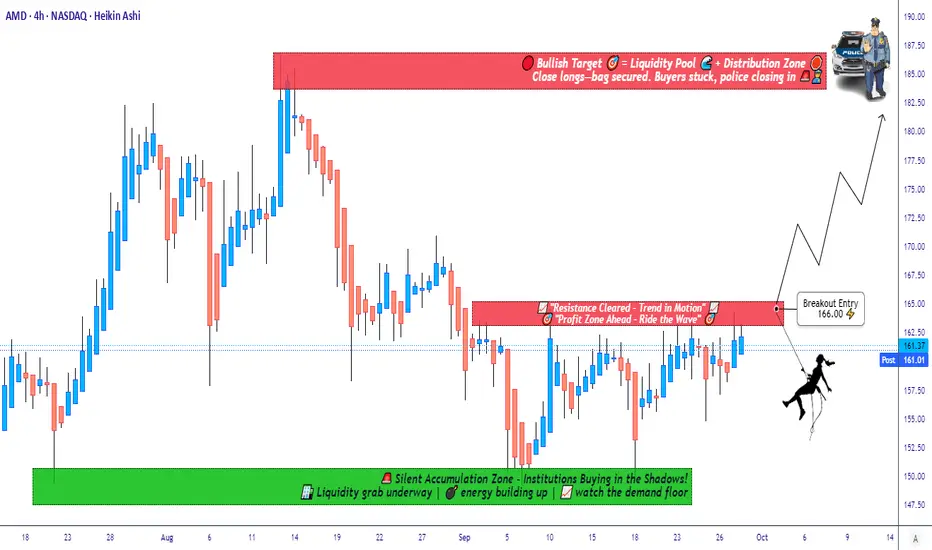
Breakout or Fakeout? Watching AMD Resistance for Next Big Move📈 AMD “Advanced Micro Devices, Inc” – Wealth Strategy Map (Swing/Day Trade)
🗺️ Plan:
I’m tracking AMD with a bullish strategy — waiting for a resistance level breakout to confirm momentum. Once price breaks the key barrier, entry opportunities open up.
🎯 Entry Setup (Thief Strategy Layering Method):
Instead of one entry, I’m applying a layering strategy with multiple buy limit orders. This approach helps average entries across different levels.
Buy limit layers: 155.00, 158.00, 160.00, 162.00, 163.00. 164.00
(💡 You can increase layers based on your own risk & comfort.)
Breakout confirmation: Entry after breakout price level mentioned.
🛑 Stop Loss (Thief SL):
Suggested stop loss @150.00
⚠️ Note: Dear Ladies & Gentlemen (Thief OG’s), this is my SL level, but you are not required to follow it. Manage risk according to your own plan.
🎯 Profit Target (Police Barricade Zone 🚨):
Price faces a strong resistance around 186.00 — this area acts as a trap zone with overbought conditions.
Target @186.00 (escape with profits before police catch you 🚔).
⚠️ Note: Again, TP is personal. Take profit when satisfied — your money, your choice.
🔗 Related Assets to Watch (Correlation Insight):
AMD tends to move in line with broader tech sentiment and semiconductors:
NASDAQ:NVDA (NVIDIA) – Direct sector competitor, often mirrors momentum.
NASDAQ:SMH (VanEck Semiconductor ETF) – Strong correlation, broader chip market direction.
NASDAQ:QQQ (NASDAQ 100 ETF) – AMD is a major component; index momentum often drives AMD.
NASDAQ:INTC (Intel) – Rival stock; negative news on INTC can boost AMD sentiment.
Watching these pairs helps confirm breakouts & avoid false signals.
✨ “If you find value in my analysis, a 👍 and 🚀 boost is much appreciated — it helps me share more setups with the community!”
⚠️ Disclaimer:
This is a Thief Style Trading Strategy — shared for fun & educational purposes only.
Not financial advice. Trade at your own risk.
#AMD #SwingTrade #DayTrade #Stocks #Semiconductors #TradingStrategy #BreakoutSetup #StockMarket #NVDA #QQQ
CHIPOTLE BACK TO 50 !Why Chipotle (CMG) Could Climb to $50 by 2026: Tasty Bull Case Chipotle’s trading at ~$43 today (Sep 23, 2025), down slightly YTD, but with strong fundamentals and operational wins, $50 (16% upside) by EOY 2026 is achievable long-term. Here’s the recipe:Revenue & Same-Store Growth: Q2 '25 comps +11.1% and $3.8B revenue (15% YoY) signal robust demand. Analysts project 13% YoY growth to $12.5B in '26, driven by 300+ new stores and digital orders (30%+ of sales). This supports $1.75 EPS, pushing P/E to 28x for a $50 target.
Operational Efficiency: Chipotlanes (drive-thru) now in 60% of new locations, boosting margins to 28%+. Automation in prep (e.g., Autocado) cuts costs 5%, per management, fueling EPS growth to $2.10 by '26, aligning with $50 at 24x forward P/E.
Analyst Optimism: 27 firms avg $50.24 PT (high $62), with BMO Capital’s $56 Buy rating citing loyalty program strength (35M+ members). CoinPriceForecast sees $53 mid-'26, clearing $50 on 10% comps.
Consumer Resilience: Despite inflation, CMG’s premium positioning (health-focused, customizable menu) retains Gen Z/Millennial traffic, hedging macro risks. LongForecast eyes $54 by Q3 '26.

AMD 200 THEN 240 BY 2026 Why AMD (AMD) Could Surge to $200 Then $240 Long-Term by 2026: AI-Powered Bull Case AMD's trading at ~$160 today (Sep 23, 2025), up 30% YTD on AI tailwinds, but with EPS exploding to $6+ in 2026, $200 (25% upside) then $240 (50% gain) is locked in for patient bulls. Here's the roadmap:AI Datacenter Dominance: MI355X GPUs ramping Q4 '25, capturing 20%+ market share from Nvidia via cost-efficient accelerators (40% better tokens/$). Oracle's Zettascale cluster + Meta/Microsoft deals project $40B+ revenue in '26 (21% YoY), per analysts—fueling $200 breakout as datacenter hits 50% of sales.
2 sources
EPS Acceleration & Valuation Pop: Consensus EPS jumps 54% to $6.01 in 2026 (from $3.90 '25), trading at 27x forward P/E—undervalued vs. peers at 0.49 PEG. At 33x (Nasdaq-100 avg), that's $199 EOY '26; bulls like Truist eye $213 short-term, scaling to $242 on 35% growth.
3 sources
Gaming/Quantum Rebound: Ryzen AI CPUs + IBM quantum collab revive gaming (15% YoY) and edge AI, adding $10B+ revenue. MI400 launch '26 cements leadership, per CoinPriceForecast's $242 avg.
