AMD Targeting $95.00Advanced Micro Devices (AMD) are trading within a Channel Up pattern since the October 13 Low and is about to form a 1D Golden Cross. The 0.5 Fibonacci retracement level is exactly on the 1W MA100 (red trend-line) and we set a medium-term term target on it at $95.00. We expect every closing above each Fibonacci to target the next above it. The 1D RSI is on Higher Lows and at the moment it is exactly on the trend-line.
-------------------------------------------------------------------------------
** Please LIKE 👍, FOLLOW ✅, SHARE 🙌 and COMMENT ✍ if you enjoy this idea! Also share your ideas and charts in the comments section below! **
-------------------------------------------------------------------------------
💸💸💸💸💸💸
👇 👇 👇 👇 👇 👇
AMD

AMD -> Preparing The Rally?Hello Traders,
welcome to this free and educational multi-timeframe technical analysis .
On the weekly timeframe AMD stock is currently retesting the neckline of the very obvious weekly double bottom as predicted in my last video analysis which is linked below.
Since we are now retesting previous weekly resistance which is now turned support and we are also having a bullish ema crossover, I do expect at least a short term rally towards the upside from here.
On the daily timeframe, market structure is still overall bearish so I am now just waiting for a deeper retest of the zone and some bullish confirmation before AMD stock will then start the next pump towards the upside.
Thank you for watching and I will see you tomorrow!
You can also check out my previous analysis of this asset:

Intel Corporation - Buy the Raid, Ride the WaveSemiconductors were supposed to be the "21st century oil," but they aren't. Whoever believed that was really not rational. Because oil is for heating stuff, making plastic, and fueling vehicles, while computers are just computers are just computers are just computers.
Intel has not been bullish, only trading within a $6 range since October. A lot of other tech/Nasdaq stuff has been a lot more interesting to trade, but I personally like these companies that are in the low double digits and usually don't do insane things in one day, because the premium and spread for the options market is usually much more sane, and risk management is really the most important thing.
Plus, once these kinds of equities go, they tend to surprise well and are a lot better than gambling on if you can catch the latest 10% day on Tesla (you won't. Mastodon's socialists told you ELON MUSK BAD).
Anyways, I am expecting that markets at large will bear trap in and around the beginning of February and FOMC. The next FOMC is 6 weeks away in the third week of March, which gives a lot of time to head fake and take traders in the direction they like seeing the least right now (up).
Thus, based on Intel's price action post-earnings after missing EPS estimates by 50% and yet only dumping $1.50, that the market makers' intention is to gun the October low.
I believe you can buy $23.50-$25 in anticipation of a marketwide pump that will ultimately prove to be an exit pump designed to unload bags, fill banks' "big short" strategy, and totally destroy the existing short sellers in the market, heading into roughly May and July of this year.
Intel's long term price action is prime for this, as we have a large volume gap spanning 7 years in the $42 to $37 range, most evident on the monthly.
You may not see another run below the $24.87 low, since it was taken months ago.
But since Intel has yet to bounce, but has also proven to not actually be very bearish, a raid below the lows seems more likely than not.
The problem from a risk perspective is that a raid may not really be a raid. Intel can just be on its way to $0, but at the same time, the company really is the biggest processor manufacture for all the computers normal people use, and is "only" market capped at present at $116 billion.
Rival Taiwan Semiconductor TSM has a similar breadth pattern, but never took a previous low, and has bounced vigorously into a volume gap of its own from 2021.
Right now, the world is not okay. The pandemic situation in China with Wuhan Pneumonia is countless times more dire than mainstream media and social media are leading you to believe. It's really serious, as many individuals, corporations, and governments are tightly wed to China.
But unfortunately, many of those weddings weren't with "China" but the heinous and unforgivable "Chinese Communist Party."
The situation in this world can change overnight and all long trades have significant risk of total liquidation, no matter the appearance.
Make sure you take good care of yourselves and your families. Remember, money is a thing that you can't take with you.

AMD Potential for Bullish Continuation | 27th February 2023Looking at the H4 chart, my overall bias for AMD is bullish due to the current price being above the Ichimoku cloud , indicating a bullish market.
Looking for a buy entry at 77.08, where the overlap support and 38.2% Fibonacci line is. Stop loss will be at 60.06, where the previous swing low is.
Take profit will be at 104.56, where the previous swing high is.
It's worth noting that there is an intermediate resistance at 94.29, where the 78.6% Fibonacci line is. Price might struggle to break through this area.
Any opinions, news, research, analyses, prices, other information, or links to third-party sites contained on this website are provided on an "as-is" basis, as general market commentary, and do not constitute investment advice. The market commentary has not been prepared in accordance with legal requirements designed to promote the independence of investment research, and it is therefore not subject to any prohibition on dealing ahead of dissemination. Although this commentary is not produced by an independent source, FXCM takes all sufficient steps to eliminate or prevent any conflicts of interest arising out of the production and dissemination of this communication. The employees of FXCM commit to acting in the clients' best interests and represent their views without misleading, deceiving, or otherwise impairing the clients' ability to make informed investment decisions. For more information about the FXCM's internal organizational and administrative arrangements for the prevention of conflicts, please refer to the Firms' Managing Conflicts Policy. Please ensure that you read and understand our Full Disclaimer and Liability provision concerning the foregoing Information, which can be accessed on the website.

AMD Potential for Bullish Continuation | 22nd February 2023Looking at the H4 chart, my overall bias for AMD is bullish due to the current price being above the Ichimoku cloud , indicating a bullish market.
Looking for a buy entry at 77.26, where the overlap support and 38.2% Fibonacci line is. Stop loss will be at 60.06, where the previous swing low is.
Take profit will be at 104.56, where the previous swing high is.
Any opinions, news, research, analyses, prices, other information, or links to third-party sites contained on this website are provided on an "as-is" basis, as general market commentary, and do not constitute investment advice. The market commentary has not been prepared in accordance with legal requirements designed to promote the independence of investment research, and it is therefore not subject to any prohibition on dealing ahead of dissemination. Although this commentary is not produced by an independent source, FXCM takes all sufficient steps to eliminate or prevent any conflicts of interest arising out of the production and dissemination of this communication. The employees of FXCM commit to acting in the clients' best interests and represent their views without misleading, deceiving, or otherwise impairing the clients' ability to make informed investment decisions. For more information about the FXCM's internal organizational and administrative arrangements for the prevention of conflicts, please refer to the Firms' Managing Conflicts Policy. Please ensure that you read and understand our Full Disclaimer and Liability provision concerning the foregoing Information, which can be accessed on the website.

AMD, weeklyLast week, the semiconductor space flourished. AMD rose 14%, surpassing Nvidia's gains. With a painful 2022 behind them, AMD stocks are rebounding on signs that the Federal Reserve will ease its rate hikes and inflation numbers will give the company a boost later this year.
With the much-awaited and cheaper AMD AM5 motherboard about to hit the shelves, sales are expected to rise. No cost-cutting announcements targeting the 15,000+ AMD workforce—yet.
So AMD looks like it could maintain the bullish trend in 2023 if sales rise, at least, for a while.

$AMD: buy at earnings supportLow risk buy in $AMD here if it holds support at $78.76 and shoots up from here, the weekly trend signal that is active now will take over and send the stock up towards $96.12 within 5 weeks or less.
Best of luck!
Cheers,
Ivan Labrie.

AMD -> Patience And Then BoomHello Traders,
welcome to this free and educational multi-timeframe technical analysis .
From a weekly perspective, AMD stock is looking extremely bullish. We just had a bullish ema crossover, a double bottom and also a trendline breakout, everything indicating that we will actually see the continuation towards the upside.
I am now just waiting for a retest of the neckline of the double bottom, before I do expect the next push higher.
On the daily timeframe, same scenario, just waiting for a retest of the previous resistance which is now turned support and then the continuation towards the upside.
Thank you for watching and I will see you tomorrow!
You can also check out my previous analysis of this asset:

Hot Air Balloons Bull Flag China Aliens Chemical Explosion QQQWorlds got a glut of high volatility events happening all at once, yet the market continues to rally.
Good CPI = Moon
Bad CPI = Nuke
Very few paths for neutral, flat, non-volatile price reaction to this week's Valentine's Day

AMD: SUPPLY & DEMAND / MARKET MOVER / FORTY-FIVE MADESCRIPTION: In the chart above I have provided a MACRO to SEMI-MICRO analysis of AMD's price action. With a large amount of history backing AMD's price action and overall impact on economic factor I would personally consider AMD to be a MARKET MOVER.
POINTS:
1. MACRO Deviation: 13.75, SEMI-MICRO Deviation: 6.8
2. Current Uptrend Channel
3. WATCH 45 MA SINCE THE START OF BEAR MARKET THIS IS THE SECOND TIME THE 45 MA RISES ABOVE THE 200 MA.
4. WIDER UPTREND CHANNEL has developed.
IMPORTANT: IF PRICE ACTION FALLS BELOW 82.50 FURTHER DOWNWARD MOMENTUM CAN THEN BE ON THE WAY.
SCENARIO BEARISH: Current RSI & MACD levels falls in tandem with overbought territory being shown where current price action stands in NEW CHANNEL. Watch for loss of 82.50 if this is the case it is crucial 68.75 does not break because this can signify an opening for a new downtrend channel.
SCENARIO BULLISH: IF 82.50 is lost watch for strong bounce on 75.63 to PRESERVE BULLISH MOMENTUM OF MA's.
FULL CHART LINK: www.tradingview.com
NASDAQ:AMD

Stay Away And Come Back To Tesla?At crazy valuations I have to think this way. Two possible price movement with both pointing downward first. Might be good to stay away and watch the price action before blindly going all in. Especially when demand is coming down for products in the US. Thanks for the view...

Biggest Mean Revert You Have Never SeenThis goes for all the companies that are trading well above 30 PE ratio. Fundamentals doesn't matter until they mean revert violently. History is always right...

AMD TRADE IDEASI'm loving how AMD looks across the board! On the Daily, we have the 200 holding as support at 79, and the 10ma holding it as resistance around 82.56. MACD is starting to show weakness on the D with the histogram fading and losing momentum and it looks as if the MACD line is about to cross below he signal line.
I will look to enter towards the downside if we break below 80, with a target of 78, and a break below there to fill the gap down to 75.
if we see strength with AMD, I will look to enter above 82.80, with targets of 84.20, 86, and 88.20

$NVDA is this it ???? Does NVDA have more to offer, or is this all it has? If you weren't aware of the Inverted Head and Shoulders pattern that is unfolding on the weekly chart, then let me fill you in. As this week comes to an end, we have reached the halfway mark of the measured move. The question now is, will it play out fully or will this be the end of it?

Thoughts on $AMD moving like this?Any thoughts on $AMD following this bars pattern? Seems to fit too perfectly with my trend lines. Of course the timing could be off slightly but I have $AMD trading sideways/sideways down for a day or two before moving up to a PT1 of $83.16 and a PT2 of $85.55 then moving back down to potentially test ~$75.

Forensic StudiesHello Traders!
Just doing some further backtesting.
AMD setups are golden opportunities.
I can only assume they occur more frequently on a specific day and when liquidity is taken from the PDL or PDH.
As of right now, I am studying just Thursday for the AMD setup.

Bullish Case For Nvidia...Bullish cash for Nvidia. Corrective ABC wave with a strong C wave up. Which match up with bullish case for S&P500 with price target of 4365.

AMAT -ter of Time for this Value Industrial Blue ChipAMAT is a strong company, clean financials, legacy business entrenchment (moat) and plenty of upside potential. However buying today is not favorable risk-reward, wait a few months to see if 2023 gives another ideal buying opportunity
Sector: Producer Manufacturing
Industry: Industrial Machinery
Applied Materials, Inc. provides manufacturing equipment, services and software to the semiconductor, display and related industries. It operates through the following segments: Semiconductor Systems, Applied Global Services, and Display & Adjacent Markets. The Semiconductor Systems segment includes semiconductor capital equipment for etch, rapid thermal processing, deposition, chemical mechanical planarization, metrology and inspection, wafer packaging, and ion implantation. The Applied Global Services segment provides solutions to optimize equipment, performance, and productivity. The Display & Adjacent Markets segment offers products for manufacturing liquid crystal displays, organic light-emitting diodes, equipment upgrades, and other display technologies for TVs, monitors, laptops, personal computers, smart phones, and other consumer-oriented devices. The company was founded on November 10, 1967 and is headquartered in Santa Clara, CA.
www.reddit.com

$NQ did the #NQ find support??Did the NQ find support or is it come down side to come if $12,273.00 holds i can see a pull back to the zone around $12,376.50 but if we break support to the dirt we go to the zone around $12,171.00

AMD Potential for Bullish Continuation | 10th February 2023Looking at the H4 chart, my overall bias for AMD is bullish due to the current price being above the Ichimoku cloud, indicating a bullish market.
Looking for a buy entry at 77.08, where the 38.2% Fibonacci line and overlap support is. Stop loss will be at 60.06, where the previous swing low is. Take profit will be at 104.56, where the previous swing high is.
Any opinions, news, research, analyses, prices, other information, or links to third-party sites contained on this website are provided on an "as-is" basis, as general market commentary, and do not constitute investment advice. The market commentary has not been prepared in accordance with legal requirements designed to promote the independence of investment research, and it is therefore not subject to any prohibition on dealing ahead of dissemination. Although this commentary is not produced by an independent source, FXCM takes all sufficient steps to eliminate or prevent any conflicts of interest arising out of the production and dissemination of this communication. The employees of FXCM commit to acting in the clients' best interests and represent their views without misleading, deceiving, or otherwise impairing the clients' ability to make informed investment decisions. For more information about the FXCM's internal organizational and administrative arrangements for the prevention of conflicts, please refer to the Firms' Managing Conflicts Policy. Please ensure that you read and understand our Full Disclaimer and Liability provision concerning the foregoing Information, which can be accessed on the website.

Week of 2/6: SPY due for Thursday sell off? Inside daily candle is not something you want to see if you're thinking upside. I'm expecting a potential bounce at demand around $406, but I think we could go as low as $400 before the end of this week or sometime next week.
Not entirely sure how to play these but I think consider entering puts under $409.70

Significantly Over Valued Nvidia.. Nvidia along with many other stocks were pumped up over 100% from the recent October low. I believe this is a bull trap and a bear market rally in a really big down trend. I am not biased but I just believe stocks are running up towards a cliff. Right now there are on the edge IMO.

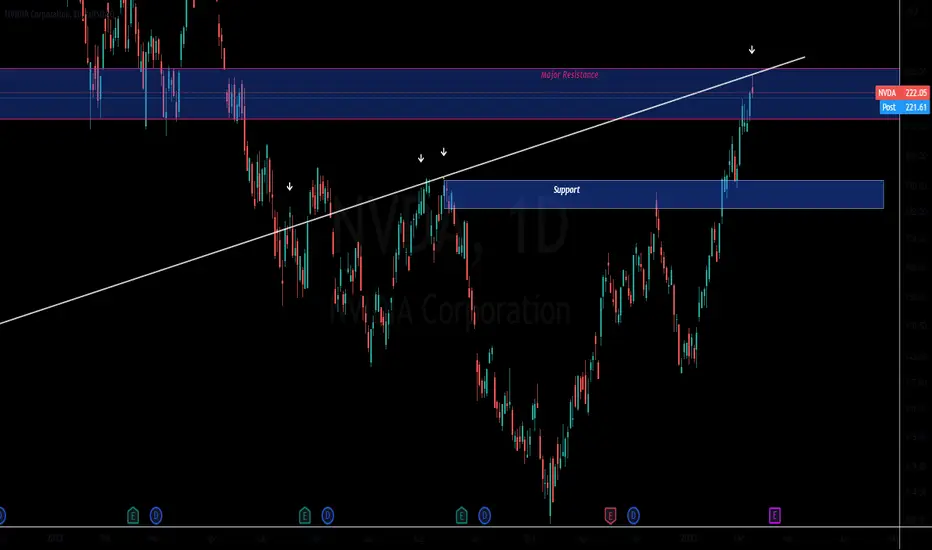
Nvidia Sell SignalNvidia just put in a reversal signal on the Daily chart as it hit major resistance.
This semiconductor has been a powerhouse mover and has single handily been lifting the Semis sector higher.
Now that this stock may show some near term sell pressure we could see the sector as a whole pullback.
The only thing that Im being mindful of when it comes to NVDA is that it has yet to report earnings.
As a technical analyst I'm a bit dissatisfied that Nvidia came so close to filling the technical daily gap at 230.46 but never managed to fill it which leads me to think there may be a possibility it has 1 more gasp at a rally to fill the gap before rolling over.
None the less distribution is being observed in a time when yields and dollar may be spiking again.