Amd - This stock is just crashing!🎯Amd ( NASDAQ:AMD ) is clearly heading lower:
🔎Analysis summary:
After we witnessed a major bullish break and retest in April of 2025, Amd rallied about +150%. But with the recent rejection at the major resistance trendline, Amd is now reversing. Following this bearish market structure, Amd can still correct about -25%.
📝Levels to watch:
$150
SwingTraderPhil
SwingTrading.Simplified. | Investing.Simplified. | #LONGTERMVISION
Amdforecast

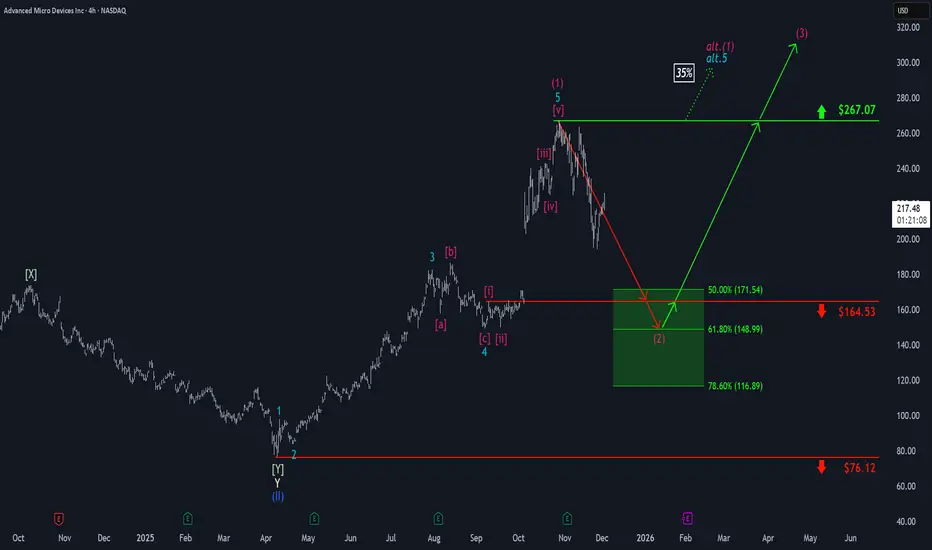
AMD: Short-Term Rebound Before Pullback?At AMD, a rebound has been taking shape recently. If this upward momentum continues in the near term and pushes price decisively above the $267.07 resistance level, we may have to expect a new high for the magenta wave alt.(1) (probability: 35%). However, our primary expectation is for the stock to soon turn lower and to move into our green Long Target Zone between $171.54 and $116.89. Following the low of the magenta wave (2) within this zone, the ongoing upward move should eventually break through the $267.07 resistance.
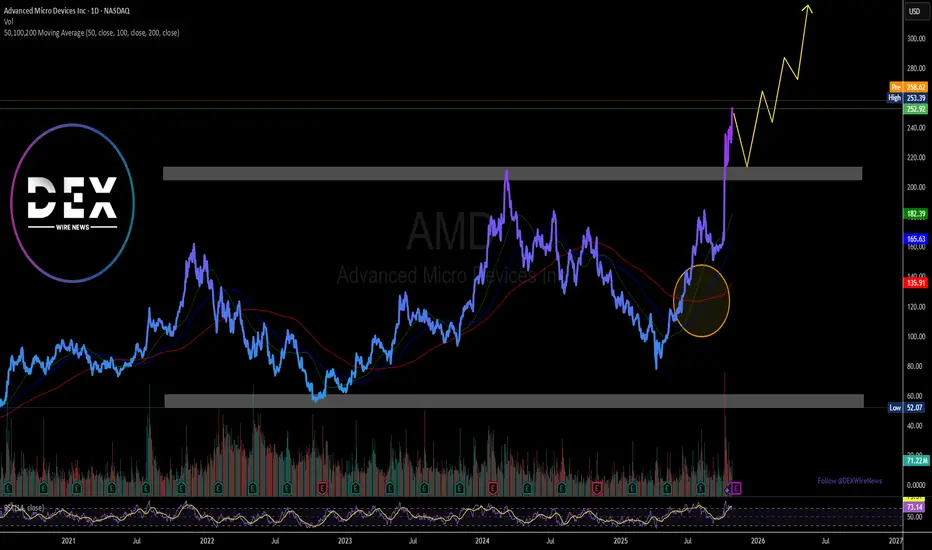
Advanced Micro Devices, Inc. (AMD) Gearing For A BreakoutThe share price of Advanced Micro Devices, Inc. (NASDAQ: NASDAQ:AMD ) is setting sail for a 50% breakout albeit market condition is overbought.
Sitting with an RSI of 73, Advance Micro Devices (AMD) shows continuous bullish momentum with the daily price chart indicating a golden cross pattern- this is an interception between the 50day-MA and the 200-day MA indicating bullish momentum building.
In another news, - Advance Micro Devices (NASDAQ: AMD) today announced the completion of the agreement to divest the ZT Systems U.S.-headquartered data center infrastructure manufacturing business to Sanmina (NASDAQ: SANM).
About AMD
Advanced Micro Devices, Inc. operates as a semiconductor company worldwide. It operates in three segments: Data Center, Client and Gaming, and Embedded. The company offers artificial intelligence (AI) accelerators, x86 microprocessors, and graphics processing units (GPUs) as standalone devices or as incorporated into accelerated processing units, chipsets, and data center and professional GPUs; and embedded processors and semi-custom system-on-chip (SoC) products, microprocessor and SoC development services and technology.
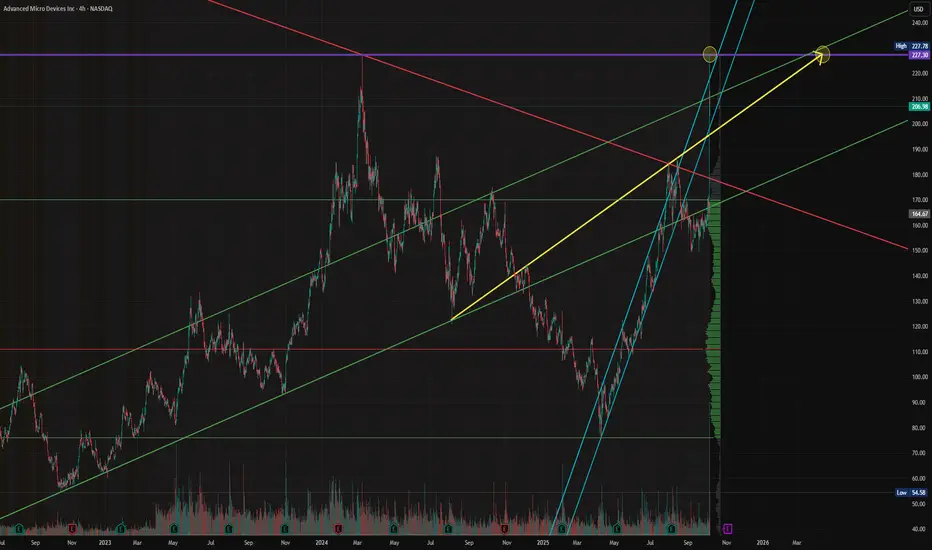
$AMD - Advanced Micro Device - $227.30 RetestNASDAQ:AMD continues its 2025 recovery rally — now clearing $200 and targeting the $227–$240 macro resistance zone.
After reclaiming the $165 structure break, AMD has re-entered its long-term ascending channel and is showing renewed strength in the AI-chip cycle.
Holding above $190 keeps this setup intact for continuation.
#AMD #AIStocks #Semiconductors #NASDAQ #BreakoutTrading #MyMIWallet
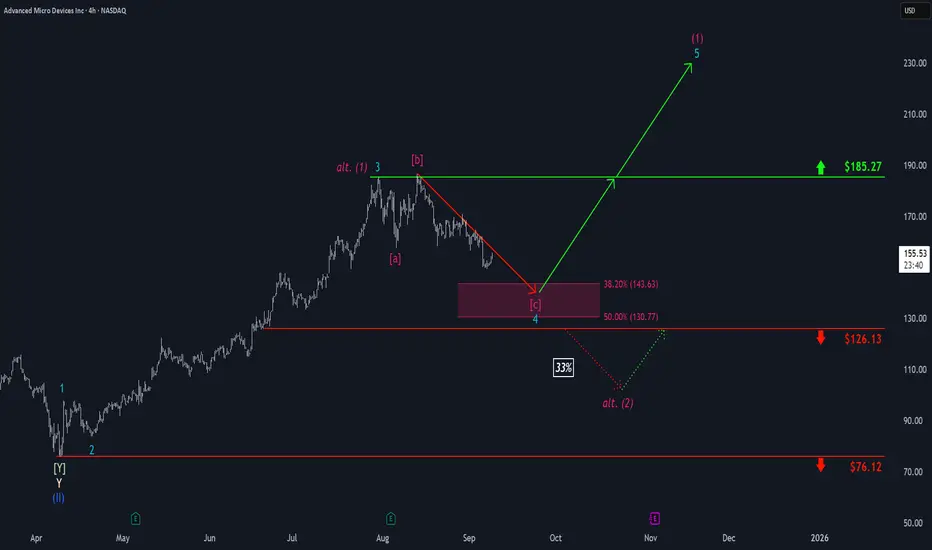
AMD: Drawing Closer...Step by step, AMD has been drawing closer to our magenta Target Zone between $143.63 and $130.77, which remains a favorable range for long entries. Prices should establish the low of turquoise wave 4 within this zone before reversing higher to resume the ongoing upward impulse—initially breaking above resistance at $185.27 and targeting the peak of magenta wave (1). However, we see a 33% chance that magenta wave alt. (1) has already completed, with a quicker low for wave alt. (2) likely to form below support at $126.13. Due to this alternative scenario, potential long trades within the magenta zone could be protected with a stop either 1% below the lower boundary of the zone or at the $126.13 level.
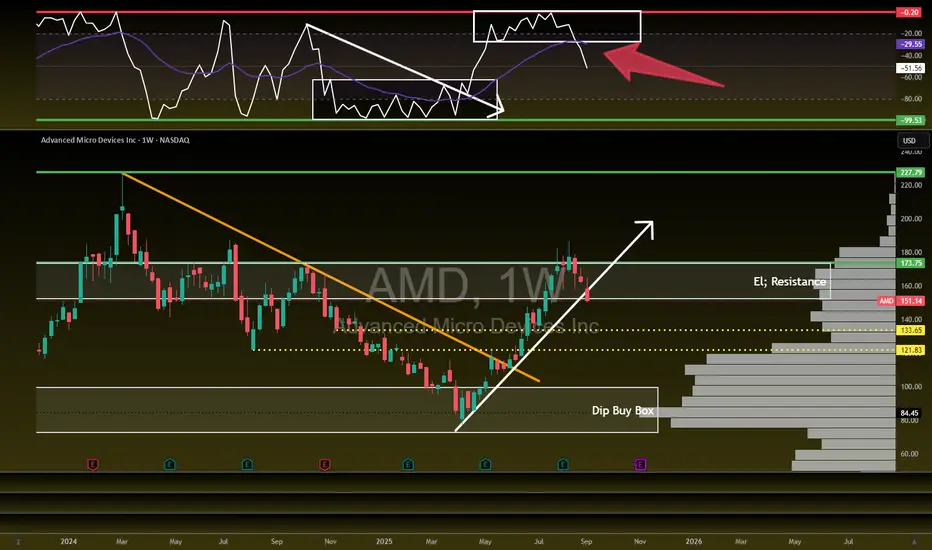
AMD - Free Fall TimeNASDAQ:AMD - Free Fall Time
Hit El' Resistance and collapsed. Uptrend broken.
WCB broken down and looking at $134 or $122 for a bottom from here.
Can't wait to get back into this trade once we flip again.
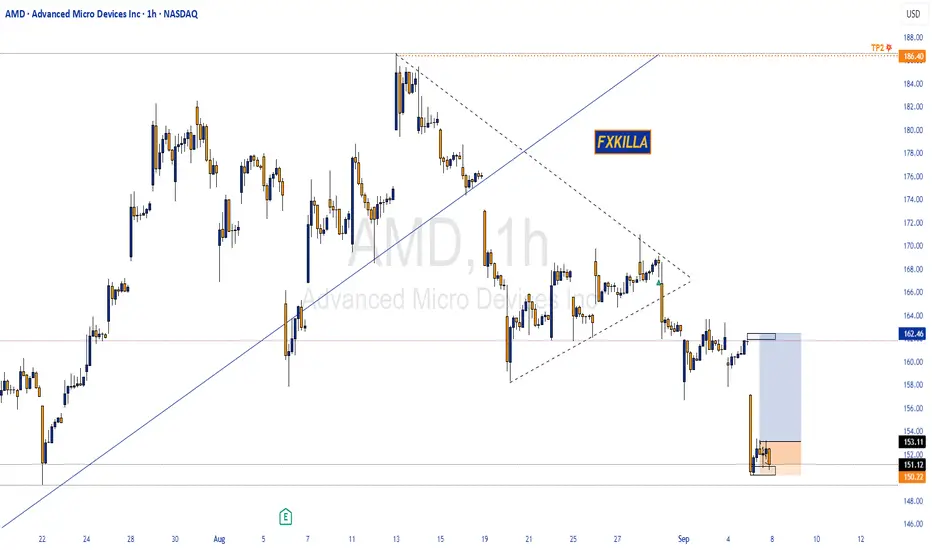
AMD HIGH PROBABILTY SETUP SOON !!!🚨 AMD HIGH PROBABILITY BUY SETUP 🚨
* Here We Can See Clearly The Next Potential Move For AMD Coming Hours/Days.
* Keep Your Eyes Close On Your Trading Positions.
* Happy PIP Hunting Traders.
FXKILLA
Amd - New all time highs will follow!🪠Amd ( NASDAQ:AMD ) rallies even much further:
🔎Analysis summary:
After Amd perfectly retested a major confluence of support a couple of months ago, we saw a textbook reversal. This retest was followed by a rally of more than +100% in a short period of time. But considering all the bullish momentum, Amd is far from creating a top formation.
📝Levels to watch:
$200
SwingTraderPhil
SwingTrading.Simplified. | Investing.Simplified. | #LONGTERMVISION

AMD Gamma Squeeze Potential?### 🚀 AMD Bulls or Trap? | \$175C Trade Setup Before Expiry!
**⚠️ High Gamma, Mixed Sentiment – Time-Sensitive Play**
📉 **Weekly RSI**: 70.4 (falling)
📈 **C/P Ratio**: 2.07 (bullish bias)
🔁 **Volume**: 1.2x weekly avg
📊 **Model Sentiment**:
* **Grok/xAI**: Bullish (Call accumulation 📈)
* **Claude/DeepSeek**: Bearish (Institutional selling 🚨)
* **Gemini**: Cautious Bearish
* **Llama**: Neutral / Wait & See
📌 **Suggested Trade**
🔵 **Call**: AMD \$175C (Aug 8 Exp.)
🎯 **Entry**: \$0.66
🛑 **Stop**: \$0.33
💰 **Target**: \$1.25
📆 **DTE**: 1
🔥 **Gamma Risk**: High – requires fast execution
🧠 **Confidence**: 65%
🧠 Watch for sharp moves. Mixed model sentiment = **great volatility** = **great opportunity** (with tight risk mgmt).
💬 *Would you take this trade?*
👇 Drop your thoughts in the comments!

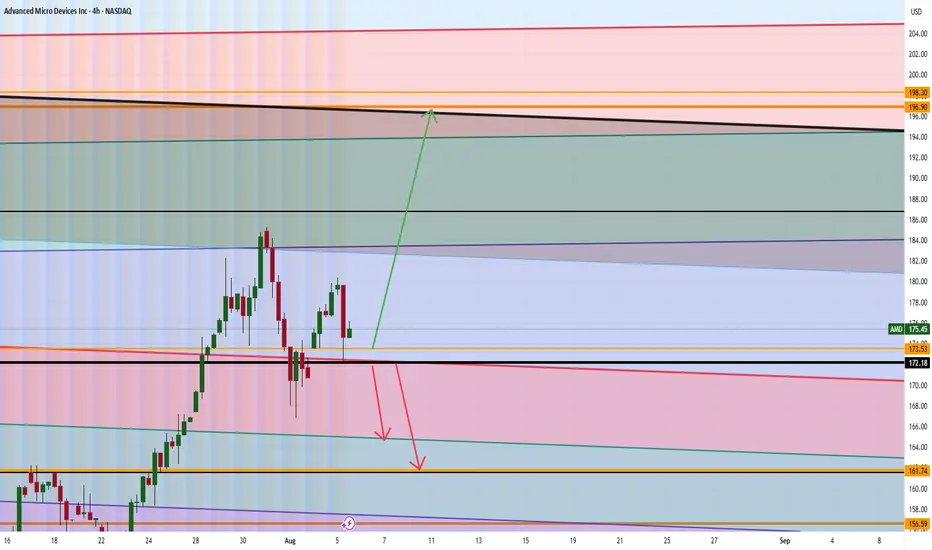
AMD Analysis Are WE GOING TO $199? Good morning trading fam
Currently we a strong bull run for AMD on the Monthly time frame.
Currently if we can hold above 172 then we will see a nice run up to 196-199 territory or higher.
If we break below the 172 we can a quick short down to the orange level we marked out.
Happy Trading
Trade Smarter Live Better
Kris
The AMD Long Heist – Ready to Rob the Bulls?!🚨 AMD Stock Vault Heist: Bullish Breakout Plan with Thief Trading Style! 📈💰
🌟 Greetings, Wealth Raiders & Market Mavericks! 🌟
Hello, Ciao, Salaam, Bonjour, and Hola to all you savvy traders! Ready to crack the AMD Stock Vault (Advanced Micro Devices Inc.) with our 🔥 Thief Trading Style 🔥? This high-energy strategy blends technical precision with fundamental firepower to execute the ultimate market heist. Let’s dive into the plan, lock in profits, and escape the high-risk resistance zone like pros! 🏆💸
📝 The Heist Plan: AMD Bullish Breakout Strategy
Our chart lays out a long-entry blueprint designed to capitalize on AMD’s bullish momentum. The goal? Swipe the profits and exit before the bears take control at the resistance zone. This is a high-reward, high-risk setup, so stay sharp! ⚠️
📈 Entry: Crack the Vault!
Timing: Strike when the vault is open! Place buy limit orders on pullbacks within a 15 or 30-minute timeframe targeting the most recent swing low or high.
Tactic: Use a Dollar Cost Averaging (DCA) or layering strategy to stack multiple entries for optimal positioning.
Pro Tip: Look for bullish confirmation (e.g., candlestick patterns or volume spikes) to ensure you’re entering with momentum. 🚀
🛑 Stop Loss: Secure the Getaway!
Place your stop loss below the nearest swing low on the 3-hour timeframe (around $148.00 for day/swing trades).
Adjust based on your risk tolerance, lot size, and number of layered entries.
Why? This protects your capital from sudden reversals while giving the trade room to breathe. 🛡️
🎯 Target: Cash Out Big!
Aim for $179.00, a key resistance zone where bears may counterattack.
Watch for signs of overbought conditions or consolidation near this level—be ready to take profits and treat yourself! 💪🎉
💡 Why AMD? The Fundamental Fuel ⛽
AMD’s bullish surge is powered by:
Tech Sector Momentum: Strong demand for semiconductors and AI-driven chips.
COT Report Insights: Institutional buying pressure (check latest Friday COT data, UTC+1). 📅
Macro Tailwinds: Favorable economic conditions and positive sentiment in tech indices.
Geopolitical Stability: No major disruptions impacting tech supply chains.
Intermarket Edge: Monitor NASDAQ 100 and semiconductor ETFs for correlated moves. 📊
For a deeper dive, review:
Macroeconomic trends
Sentiment analysis
Index-specific correlations
Future price projections (overall outlook score: Bullish). 🌎
⚠️ Trading Alert: Navigate News & Volatility 📰
News releases can shake up the market like a rogue alarm system! To stay safe:
Avoid new trades during major news events (e.g., earnings or Fed announcements).
Use trailing stop-loss orders to lock in profits and protect open positions.
Stay agile—monitor real-time updates to adjust your strategy. 🚨
📌 Risk Disclaimer
This analysis is for educational purposes only and not personalized investment advice. Always conduct your own research, assess your risk tolerance, and align your trades with your financial goals. Markets move fast—stay informed and adaptable! 📚
💥 Boost the Heist! 💥
Love this Thief Trading Style? Smash the Boost Button to supercharge our robbery squad! 💪 Every like and share fuels our mission to conquer the markets with ease. Join the team, steal the profits, and let’s make money rain! 🌧️💰
Stay tuned for the next heist plan, you legendary traders! 🤑🐱👤🚀

AMD Clears Resistance, Eyes $147.8 on Bullish ReboundAMD broke above $139.8, making the primary trend bullish. A pullback to this level can provide a discount to join the bull market, with a target at $147.8.

AMD – The AI Underdog Setting Up for a Major MoveAMD is quietly building momentum as a major AI contender, rivaling NASDAQ:NVDA with its upcoming MI400 GPU series and strong Q2 guidance potential.
I'm watching this carefully for a medium-term swing with high reward potential based on both fundamental catalysts and technical structure.
🔍 Entry Points I'm Watching:
✅ $143 → Aggressive breakout entry if it clears $147.50 with strong volume
✅ $125 → Previous support + gap-fill zone from May
✅ $115 → Deep value zone near 200-day MA (if macro weakens)
🎯 Profit Targets:
• TP1: $160 – Key resistance & post-earnings reaction zone
• TP2: $176 – Melius Research target
• TP3: $200+ – ATH breakout potential if AI narrative extends into Q3
⚡ Catalysts to Watch:
• MI400 GPU launch in progress
• Q2 earnings (late July) – data center revenue in focus
• Sector momentum from NASDAQ:MU and NASDAQ:NVDA
⚠️ Disclaimer: This is not financial advice. I am sharing my personal trading plan and analysis for educational and discussion purposes only. Always do your own research and consult with a financial advisor before making investment decisions

AMD: Short-term Upward PotentialAMD has continued to face downward pressure, preventing further progress in green wave . While this wave still has room to rise, its top should form below resistance at $141.16. Once wave completes, wave should follow—finishing the larger green impulse to the downside and completing the corrective structure of blue wave (II). This move is expected to conclude in our blue Long Target Zone between $62.82 and $35.19. That said, we continue to monitor a 30% alternative scenario: it suggests that wave alt.(II) has already bottomed at $76.12. In that case, AMD wouldn’t visit the blue zone but instead break out directly above the resistances at $141.16 and $174.98—marking the beginning of wave alt.(III).
📈 Over 190 precise analyses, clear entry points, and defined Target Zones - that's what we do.

AMD: Looks like bottom, finally!NASDAQ:AMD : Looks like bottom, finally!
Weekly Chart Analysis:
- 200D MA
- Volume Shelf
- Bottom of Falling wedge
- S/R Zone
- Divergence on the Wr%
$135 ▶️ $165 Incoming 🎯
Not financial advice

AMD'S Short sell volume is screaming for a trough BUT downgradedMost analyst following AMD are downgrading its fundamentally because of the
AI new software coming from small company in China. Well, technically we are completely
going into the other direction which is we are having a major trough in coming weeks/months
in 2025 with + 50% move.
- The big question is when and where ?
WARNING: Some Elliottions are calling for a 1929 bear mkts !!!!!!!!!!

AMD: Wave (3) of [3]As anticipated, AMD has realized strong sell-offs, breaking below the support at $121.82. We primarily expect the magenta wave (3) to conclude further south, followed by a corrective rise in the subsequent wave (4). Below $121.82, however, the stock should resume the magenta downward impulse and, thus, start wave (5).

AMD's Epic Surge or Plunge: Unveiling Key Levels for 2025!Good morning, trading family! Let's talk about AMD today. If the stock price goes above $130, it could go up to $142, then $157, and maybe even $169. But if it goes below $114.12, it might drop down to between $93 and $97.
If you want to learn more about sustainable trading, feel free to join my webinar this Sunday. Send me details to learn more.
Kris/Mindbloome Exchange
Trade What You See

AMD = The Trader Slayer!NASDAQ:AMD
We got a lot going on here with AMD!
- In the volume gap and could fall down to the shelf at $108 or we could have just hit a double bottom with a breakout spot at $174ish.
-H5 Indicator is RED and they are in a downtrend while also forming a Bull Flag (barely).
-Sitting on the bottom of the Wr% and could form a downtrend box or start running to the upside.
It all makes sense to me. This name is an extremely difficult name to trade and has eaten the best traders whole, myself included.
One thing is clear to me! trying to trade this name right now with all of these mixed signals is risky-business! I'm steering clear until we get some certainty!
No price targets because who knows whats gonna happen. 🤣
Not financial advice.

AMD Stock Price Rebounds from Yearly Low. 2025 ForecastAMD Stock Price Rebounds from Yearly Low. 2025 Forecast
As the chart indicates, Advanced Micro Devices (AMD) reached its yearly low on 20th December, dropping below $120.
However, on Monday, AMD emerged as one of the top-performing stocks in the market. The trading session opened with a bullish gap, and by the close, the stock had gained approximately 4.5% compared to Friday's close. Meanwhile, the S&P 500 (US SPX 500 mini on FXOpen) rose by 0.7% on the same day.
According to technical analysis of the AMD stock chart, in 2024, the price formed a descending price channel (highlighted in red), characterised by the following:
- Bears broke below three trendlines, forming a structure reminiscent of Gann fans.
- The fourth (lowest) trendline could serve as a strong support level, preventing the price from reaching the bottom of the channel. The sharp upward reversal from the $120 level may be considered a sign supporting this scenario.
Price action suggests increasing demand, and analysts (as outlined below) believe buyers may play a more active role in 2025.
AMD Stock Price Forecast for 2025
In 2024, AMD underperformed the market. Amid the AI boom, Nvidia (NVDA) and Broadcom (AVGO) stocks reached all-time highs, while AMD's stock price dropped by about 12% since the beginning of 2024.
According to Yahoo Finance, the company’s strategic approach provides a rationale for investors to hold or buy AMD shares heading into 2025.
AMD has historically avoided introducing revolutionary products. Instead, the company enters established markets with alternative products that offer specific advantages.
This strategy could apply to the AI boom:
- 2024: AMD’s stock declines as the company adopts a wait-and-see approach, assessing the AI market's needs.
- 2025: AMD could benefit from the AI race, possibly through new processors in its EPYC series.
According to TipRanks:
- 22 out of 30 surveyed analysts recommend buying AMD shares.
- The average price target for AMD is $182 by the end of 2025, representing a 46% increase from current levels.
This article represents the opinion of the Companies operating under the FXOpen brand only. It is not to be construed as an offer, solicitation, or recommendation with respect to products and services provided by the Companies operating under the FXOpen brand, nor is it to be considered financial advice.

Will AMD ever break out? Let's see!Will AMD ever break out? Let's see!
We have a massive one year bull flag on the charts.
We are still sitting on the bottom of a volume shelf in which we need to hold if we want to keep this name on the watchlist.
To enter, all we need is a flip to green on our H5 Indicator and a breakout of the bull flag pattern.
Measure Move is: $300 (2x)
Measured Time: FEB2026
NFA

AMD’s Earnings Stumble | A Golden Opportunity for Investors?Post Earnings Dip, Is AMD ready for a 2025 Comeback?
Shares of Advanced Micro Devices dropped over 10% after releasing its third quarter FY2024 earnings report, which fell short of investors’ expectations. Although the results were not poor, the market had high hopes given AMD's premium stock valuation. The company did surpass revenue projections, but its non GAAP EPS matched market expectations plus the midpoint of its fourth-quarter revenue forecast slightly missed estimates.
In my prior analysis, I upgraded AMD from a sell to a buy after a 20% dip, which realigned market expectations. Since that upgrade, the stock has climbed 15%, outperforming the S&P 500 Index by 9%. The recent earnings-driven decline has brought AMD's stock price close to my previously mentioned level.
While the gaming segment saw a sharper decline in revenue in 3Q, the Data Center GPU division continued to exhibit strong growth, boosting overall revenue growth and improving margins. I believe AMD is still in a strong position to further accelerate revenue growth and margin expansion in the fourth quarter and beyond. As a result, I see the post-earnings dip as a buying opportunity and maintain my buy rating on the stock, supported by its anticipated growth phase justifying its premium valuation.
For 4Q FY2024, AMD projects 21.6% YoY revenue growth at the midpoint of its guidance, with a $300 million potential variance. This growth is expected to be driven by continued expansion in Data Center GPUs. Although the midpoint guidance is slightly below market consensus, I believe AMD could exceed this number, given its track record. My estimate suggests a 24% YoY revenue increase, or $150 million above the midpoint.
3Q EPS Analysis Shows Margin Pressure
AMD has shown consistent margin improvement since 4Q FY2023, though the pace in 3Q didn't meet expectations. EPS aligned with estimates despite revenue exceeding forecasts, indicating margin challenges. Non-GAAP gross margin rose by 50 bps sequentially, while non-GAAP EBIT margin showed strong improvement, rising by 350 bps QoQ.
AMD forecasts a 4Q non-GAAP gross margin of 54% and operating expenses of $2.05 billion, driven by a favorable mix from its Data Center segment, which now represents 52% of total revenue. Management noted that gross margins in the Data Center segment are below the company average, focusing on customer needs and market growth for future gains. This contrasts with NVIDIA (NVDA), which reportedly has higher Data Center margins, though specific figures are not disclosed.
With a 4Q revenue consensus at $7.65 billion, AMD projects a non-GAAP EBIT margin of 27.2%, suggesting an additional 200 bps sequential increase. The company appears well-positioned for both revenue growth and margin improvement, despite its valuation declining after the recent stock pullback.
4Q EPS Outlook Signals Continued Growth
Although 3Q non-GAAP EPS met expectations, AMD’s growth accelerated from 18.1% YoY in 2Q to 32% in 3Q. However, the selloff post-earnings implies that investors anticipated even higher growth. Based on 4Q guidance, I estimate AMD’s non-GAAP EPS at $1.10, marking a 44% YoY increase.
AMD's FCF profile also improved, generating $496 million in 3Q, a 13% QoQ increase despite a one-time acquisition-related expense of $123 million. Higher capital expenditures are expected in FY2025 to support MI300 growth and maintain momentum.
Market Expectations and Valuation Impacts
Before the 10% post 3Q selloff, AMD’s EV/EBITDA TTM was higher than NVIDIA’s, but they are now on par, despite AMD’s margins and growth trailing NVIDIA's. AMD’s non-GAAP EV/EBITDA forward multiple is 46.3x, compared to NVIDIA’s 42.6x, and its forward P/E ratio is 50.4x, 17% above its 5-year average and higher than NVIDIA’s 49.7x.
While AMD's premium valuation can be justified given its growth acceleration, NVIDIA’s triple-digit EPS growth is not expected to continue. Moreover, NVIDIA’s gross margin recently declined, reinforcing the case for AMD’s valuation as it expands its growth in FY2025.
AMD’s stock has retraced to a 0% YTD return due to margin concerns and underperformance in Gaming and Embedded segments, though the latter is gradually recovering. However, the company’s strong Data Center gains and continued margin expansion indicate a solid growth phase. The recent selloff has recalibrated market expectations, and with ongoing AI-driven demand, AMD’s growth is likely to extend into FY2025, making the pullback an attractive buying opportunity.
What you think, Are you Moonish on AMD?

Earning report Today! Can $AMD breakout the downtrend line?
Technically, AMD is closing to the downtrend line again. There was a FAKEOUT three weeks before.So will NASDAQ:AMD truly breakout the downtrend line this time?
It will depends on the earnings report today!
Here are 3 Things I'm Watching in NASDAQ:AMD 's Earnings on Tuesday
1. MI300 Series: Flagship AI GPU
• Their new Instinct MI300 series GPUs are built to compete directly with NASDAQ:NVDA H100 chips, supporting both training and inference for large-scale AI models. The MI300 offers high memory capacity and multi-chip module (MCM) architecture, making it suitable for AI workloads that require massive data processing. Early deployments include partnerships with key cloud providers like NASDAQ:MSFT Azure -- which is leveraging AMD’s GPUs for its AI infrastructure.
2. AI-Powered Accelerated Processing Units (APUs)
• Their APUs, which combine CPU and GPU capabilities on a single chip, are designed to handle AI tasks efficiently in edge computing and consumer applications. For instance, AMD’s latest Ryzen AI-powered APUs provide AI acceleration directly in laptops -- aiming to improve tasks like image processing and natural language interactions.
3. Capturing AI Market Share
• Their approach is centered around capturing a larger share of the rapidly growing AI semiconductor market, which is projected to surpass $400B by 2030. As AI models become more sophisticated, they require increased computational resources. AMD’s focus on energy efficiency and competitive pricing allows it to offer alternatives to Nvidia, making it more appealing to enterprises managing rising energy costs and budget constraints. Unlike Nvidia, which has historically focused on high-end GPUs, AMD’s diverse product mix, including CPUs, APUs, and data center GPUs, enables it to serve a broader range of AI use cases. This could lead to more consistent revenue growth as AI applications proliferate beyond just data centers -- spreading into edge devices and personal computing.
