compra en el par EURCADExcelente oportunidad con buen riesgo beneficio en el par eurcad, stop loss en línea roja, y take profit en la azul, toda la zona marcada son compras.
Analisis

Ethereum's (ETH) price will retrace - Short ($140)Ethereum's (ETH) price tested the Weekly Candle Close in range of ($189 and $196). The Colored zone is playing the role of a strong resistance level that will stop the price growth and forced to retrace in a downward direction to find support to hold on.
Fundamentally last two weeks Ethereum's (ETH) price dropped more than 25% for a short time. BTC had a drop of more than 17%, those kinds of numbers are speaking of a new bearish trend coming. As I said in the last Ethereum's (ETH) prediction a bearish trend is coming. Historically diversification towards smaller assets indicates a future drop. The last few days altcoins had a growth of 10% shortly. To me, this is can be read as a signal for future drop and manipulation for the masses. ETH will retrace one way or another probably making new lows. Negotiations between the USA and China are taking place in those days. If a consensus isn't reached the stock market will drop 6 to 7%. The snowball effect will affect the crypto market as well. This will give more bearish momentum to the situation we are in right now.
In my opinion, there will be no deal between the USA and China at that current moment.
Technically Ethereum finished Five Impulsive Waves, calculated by Elliot Waves Theory on 29 of August. Price retraced more than 35% forming a 2nd wave up to $223. That means by Elliot Waves Theory that most likely we are in 3rd wave. An aggressive drop should take place. Last few days we had a retracment to $194. The retracement formed an ABC corrective movement which is a bearish sign. Ethereum's (ETH) price tested the Weekly Candle Close in range of ($189 and $196). The Colored zone is playing the role of a strong resistance level that will stop the price growth and forced to retrace in a downward direction to find support to hold on. On the other hand, on a 4H time frame, an Over Sold - Relative Strength Index (RSI) can be spotted. It means that the drastic movement has to retrace cause Over Sold condition is a bearish indicator. Ethereum's price is testing a 200-candle exponential moving average (EMA) on a 6H time frame. If the price can't reach above $198 at that moment a retracement is inevitable.
Conclusion
Ethereum's (ETH) price will retrace to find a solid support level. Strong support zones are price levels at $140, $137 and $125.
Good luck!
"If everyone is thinking alike, then somebody isn't thinking."

My prediction for the next few hoursLet´s see if my time management is better this time :P
Save trades guys !

USD/CAD LongAfter the big white day candle from 02.10.2019,
we expect to continue the upward movement.
A correction to 38.2 Fibo is possible, where there are
support levels from previous peaks.

Posible escenario alcista en BitcoinEncontramos al precio en una zona de posible correccion alcista, donde hace varios dias a sido regresado, dandonos posible patron de compras a la ruptura de ese pequeño high y retest, esperaremos


#BTC just thinking out loud is in a bullish trend, respectively, the longer the price consolidates and does not decrease, the more likely it is that this correction will be completed as high and faster as possible.
For example, with a bullish trend at 1W Time Frame, according to statistics, the price never fixed below the moving average MA-21 (false breakdowns are possible), and tomorrow this MA-21 will be oriented at the level of 9270. Associated factors for growth: bullish divergence also at 1w Time frame and declining volumes during the entire corrective movement
Most likely there will be a false breakdown of this moving one, an additional large number of traders will confirm their assumptions in the movement of BTC to $ 7000-8000 and begin to enter Short, and after that their positions will be knocked out by a serious upward movement ...

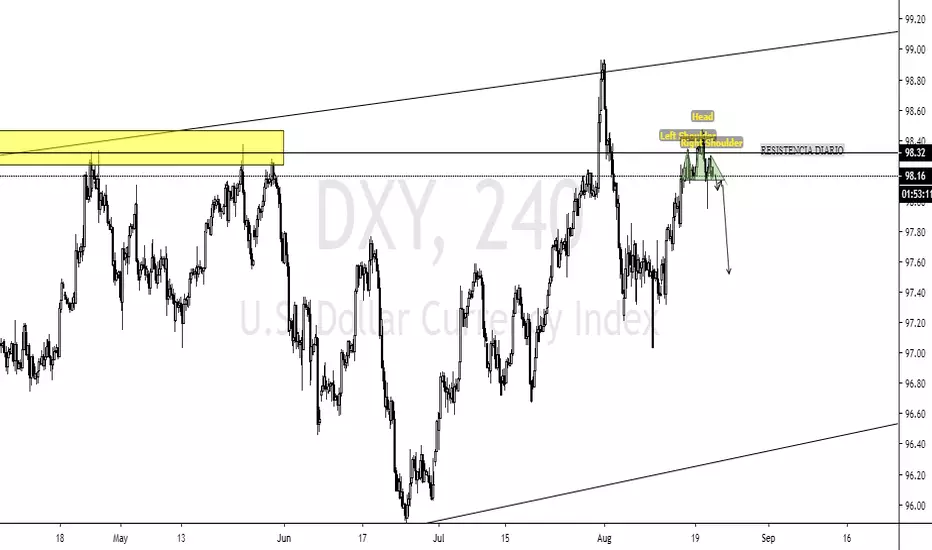
ANALISIS DXYEl precio esta poniendo a prueba de nuevo, una resistencia de TF DIARIO. podemos ver como nos esta formando un HCH, un posible patron de caida, esto nos sirve para buscar entradas en largo en los pares del USD, Y Hoy con la noticia de la FOMC.
GBPAUD BUY 1. Tendencia alcista
2. Toco techo, esperando retroceso
3. Piso con nivel fibbonacci
A la espera de el retroceso para seguir en compras


NZDUSD short 4HEn W hay gran potencial de movimiento bajista por mucho más tiempo, pero primero debemos aprovechar movimientos cortos.

EURUSD short 4HDespués de tanto esperar llegó la ruptura de la tendencia principal alcista, una gran oportunidad.
@yeisonmendez.fx

Btc descontando el mercadoTeniamos una proyeccion anterior donde el nivel fue superado y validado. Por alguna razon fue el precio a buscar su base. En temporalidades mas bajas el mercado parece no estar reaccionando, en caso de ceder iremos al super nivel de 10600, en la grafica pueden observar la fortaleza de esta zona.

GBPAUD short W - SwingInteresante panorama, con varias confluencias como la ruptura de la linea principal de tendencia alcista, donde anteriormente habíamos tenido un fake out, y según nuestra teoría, el precio siempre va a reaccionar a la nueva linea formada por ese suceso, por lo cual será intersante ver que pasa cuando llegue el precio a nuestro TP1 para luego ir por nuestro objetivo principal en el TP2. Hay muy buen panorama para ventas.

EURUSD short 4hNo alcanzamos a tomar el momento exacto de entrada, pero aun podemos aprovechar la ruptura fijando estos dos T.P.

USDCAD short / swing Interesante confluencia en la estructura para entrada en corto para mantener por un buen tiempo.

GBPAUD short 4hPosible movimiento, teniendo en cuenta nuestra estrategia de rompimiento de linea de tendencia, RSI y estructura con un alto más bajo.

BNB / US DólarHola, bueno continuando con el análisis del BNB / US dólar. Ha llegado el punto en donde un máximo acaba de tocar la resistencia que había puesto en una de las gráficas que subí hace unos días. Lo que presiento que sigue es una caída debido a que hay una convergencia que me indica que el mercado esta perdiendo energia.... yyyyy pues llega un tiempo en que todo lo que sube tiene que bajar. Espero que esté en lo correcto, como ven mis análisis son simples, debido a que apenas le estoy agarrando la onda jajaja.
Buen día amigos!!! espero no equivocarme....


Thats why we have to wait the Daily closure.....#ETHEREUM Today we had kind a volatile day starting going higher early in the morning breaking the $268 zone (in 4H chart) reaching the price $288, and then the price fall around 15% reaching $240 (wick) So. what can expect for #ethereum?. The daily closure shows us the fake breakout of $268 thats why we have to wait a daily closure upside $268 to have a confirmation of a bull momentum. Anyway the price can consolidate around the $250 or even fall to the $230 zone wich is a good price for a bull entry if the market give us any sign. Now we have to wait for structure in 4H for the next movement and remember "Trade what you see not what you want to see"

Clear sell on CHFJPY lets go short! Right now the price of FOREXCOM: CHFJPY is at a good sales level, 109.133 this level started to form with a strong rejection on May 6th, the price has had its ups and downs, and is consolidating in H1, right now as we have a loss of bullish momentum with three touches in the sales level, indicating the rejection of the rise, we see a good posible sell.
We expect a bearish rally at least until our next level 108.415 we validate that with the fact that it is most likely that the price will look for the level of the moving average in 200 periods. We put our stop loss at 109.212, which I see difficult to touch, since we have a good rejection to the rise, and a trend line that is also rejected, marked in H4.
Stay tuned to the movements of the price of this pair, since we are in minimum levels of the price in weekly chart.
Happy profits, use risk management!
