GBP/USD OVERVIEW H1 CHART I 12/19Market Context
Price Structure: The pair is moving within a Symmetrical Triangle or a converging wedge pattern, formed by a descending trendline above and an ascending trendline below.
Current State: The price is trading at 1.33693, sitting almost exactly on the POC (Point of Control) line. The market is in a tight squeeze, preparing for a potential breakout.
Key Volume Zones (Volume Profile) Based on the Volume Profile tool on the right side of the chart:
VAH zone (Value Area High) - 1.34130: A major resistance zone. This is the upper boundary of the value area where sellers previously stopped upward momentum.
POC zone (Point of Control) - 1.33677: This is the core value area representing the highest traded volume. The current price is struggling at this level, showing a temporary balance between buyers and sellers.
VAL zone (Value Area Low) - 1.33501: A strong support zone below. If the price drops to this level, buying demand typically emerges.
Price Action Analysis
Range Contraction: Lower highs and higher lows are forming. This indicates that both buyers and sellers are cautious, waiting for new catalysts or momentum.
Support Reaction: The ascending trendline (lower diagonal) is providing excellent support. Every time the price touches this line, it tends to bounce back up.
Potential Scenarios
Scenario 1: Bullish Breakout
If the price stays above the POC (1.33677) and breaks through the upper descending trendline, the first target will be the VAH zone (1.34130).
Clearing 1.34130 would re-establish a longer-term uptrend.
Scenario 2: Bearish Breakdown
If the price loses support at the ascending trendline and falls below the VAL zone (1.33501), selling pressure will likely increase significantly.
The target for a downward move would be the previous lows around the 1.33200 area.
Summary and Advice The market is currently in a "wait and see" phase.
Closely monitor the 1.33677 (POC) level. If the 1-hour candle closes stably above this, priority goes to short-term buy orders toward the VAH.
A safe Stop Loss should be placed below the VAL zone (1.33501).
Since the price is at the apex of the triangle, the upcoming volatility is expected to be strong and fast.
Analyse

GBP/USD Outlook I 12/181. Trend Structure & Price Patterns
Current Trend: The pair is in a short-term bearish structure after forming a peak around the 1.3440 area.
Triangle Pattern: Price is compressing toward the apex of a triangle pattern, formed by a descending trendline (connecting lower highs) and an ascending trendline (connecting higher lows).
Status: The market is in a stage of extreme accumulation, preparing for a breakout to determine the next directional move.
Intersection: The intersection of these two trendlines is sitting almost exactly at the current price level around 1.3366.
2. Volume Profile Analysis
The chart clearly displays three key Value Areas:
POC (Point of Control - 1.3367): This is the level with the highest traded volume and where the price is currently "anchored." Continuous fluctuation around the POC indicates a balance between buyers and sellers at this moment.
VAH (Value Area High - 1.3401): The upper red line acts as a hard resistance. Previously, price attempted to test this zone but was strongly rejected, leaving behind a long upper wick.
VAL (Value Area Low - 1.3322): The lower yellow line is the crucial support floor. This is where buyers stepped in aggressively during the most recent dip on December 17.
3. Specific Price Levels
Immediate Resistance: Just above the current price lies the descending trendline and the VAH zone (1.3401). Only a clean break above this area would return the trend to bullish with a target of 1.3440.
Immediate Support: The recent low of the candle cluster is around 1.3360. If an hourly candle closes below this level, price will likely seek the VAL zone (1.3322).
Other Technical Signs: The blue/red dots (likely Parabolic SAR or a trend filter) are currently sitting just above the price, adding slight downward pressure on GBP/USD.
4. General Outlook
GBP/USD is currently in a "coiled spring" state. The upcoming price movement depends entirely on which side gains enough momentum to push the price out of the triangle pattern and the POC zone. Since the price is at the convergence point of major trendlines, high volatility usually follows such a sideways period.

Ethereum Is Absorbing Supply — The Break Comes After PatienceEthereum on H1 is holding inside a well-defined sideways range following the sharp impulsive sell-off, with price now rotating between a defended support zone and a capped resistance band around the 3,000–3,020 area. This type of tight consolidation after an aggressive move lower signals absorption rather than continuation, as sellers fail to push price into acceptance below support while buyers are not yet strong enough to reclaim resistance. The structure suggests balance and compression, not trend resolution, with liquidity building on both sides of the range.
From a macro perspective, this behavior aligns with the broader crypto environment. Risk sentiment has stabilized, and while liquidity conditions are not expanding aggressively, there is no fresh macro shock to justify another impulsive leg down. Expectations around U.S. monetary policy remain relatively steady, limiting USD strength and allowing crypto assets like ETH to consolidate instead of breaking down. However, the lack of strong liquidity inflows also explains why upside remains capped and corrective for now.
As long as ETH continues to hold the support zone, downside is likely limited to range rotation rather than trend continuation. A clean acceptance above the resistance zone would signal alignment between technical structure and macro conditions, opening the path toward a stronger recovery move. Until that breakout occurs, this is a patience phase the edge appears only when price leaves the range with clear intent.

BTC Is Quiet… That’s When Explosions Begin.BITCOIN (BTC/USD) – 1H MARKET ANALYSIS
1. Current Market Structure
Bitcoin has completed a sharp bearish impulse, followed by a clear range based consolidation inside a defined demand zone. Price is no longer making lower lows aggressively, indicating selling pressure has been absorbed. The market is transitioning from distribution into accumulation on the 1H timeframe.
Key observation:
- Strong impulsive drop → liquidity grab
- Sideways compression → energy building phase
This is not random ranging it is structured consolidation after a sell-off.
2. Key Zones & Liquidity Mapping
Demand / Accumulation Zone: ~85,200 – 86,300
→ Area where buyers are actively defending and absorbing sell orders.
Mid Resistance: ~87,700 – 88,000
→ First reaction zone once price breaks the range.
Major Resistance / Target: ~89,800 – 90,000
→ Prior supply + liquidity resting above equal highs.
As long as price remains above the demand zone, downside risk is limited.
3. Market Psychology
This is the phase where:
- Retail traders lose patience due to slow movement.
- Weak hands exit positions inside the range.
- Smart money accumulates quietly at discounted prices.
The repeated up–down movement inside the green box is liquidity engineering, not indecision.
4. Primary Scenarios
Main Scenario (Preferred):
Continued consolidation inside the demand zone.
Formation of higher lows within the range.
Break above range high → momentum expansion.
Target progression:
TP1: ~87,800
TP2: ~89,000
TP3: ~89,800–90,000
Invalidation Scenario:
Clean 1H close below ~85,200.
Would open downside continuation currently low probability based on structure.
5. Summary & Trading Insight
Bitcoin is behaving exactly as expected after a strong sell-off:
✔ Liquidity taken
✔ Accumulation confirmed
✔ Breakout preparation in progress
This is a patience market. Those who wait for structure confirmation will be positioned ahead of momentum traders.
The market rewards discipline, not urgency. Stay aligned with structure not emotions.

A Pause After the Rally, Base Forming Around 2.8k–3.2kHello everyone, this is Domic.
Looking back at ETH on the weekly timeframe, the broader picture is quite clear. After a strong rally that pushed price into the 4,800–5,000 zone, the market entered a necessary corrective phase. This pullback brought ETH down toward the 2.8k–3.0k area, right around the midpoint of the prior impulse leg. The way price has reacted suggests this is more of a pullback into a base for “rest and re-accumulation,” rather than the beginning of a new bearish cycle.
From an EMA perspective, ETH is currently trading below the EMA34 near 3,385 but has only pulled back modestly and continues to hover close to the EMA89 around 3,060. What stands out is that both EMA34 and EMA89 are starting to flatten, no longer sloping sharply lower. This often signals a transition from a fast corrective phase into a more balanced state, where supply and demand are temporarily finding equilibrium. Price consolidating around the EMA89 after a major advance typically reflects a pause to rebuild momentum, not a breakdown that leads to successive lower lows.
On the medium-term structure, the most recent low around 2.5k–2.6k remains clearly higher than the lows formed before ETH’s strong breakout, meaning the weekly higher-low structure is still intact. Recent weekly candles have relatively small bodies with balanced upper and lower wicks, while volume has been gradually declining. This is a familiar signature of a healthy correction, where profit-taking pressure has largely been absorbed and sellers no longer have enough conviction to push price significantly lower.
With this type of price behavior, the most appropriate view at this stage is that ETH is entering an accumulation phase around the 2.8k–3.2k range, while the broader trend still leans mildly bullish.
Wishing you successful trading!

ETH Is Compressing — The Next Move Won’t Be RandomMARKET BRIEFING – ETH/USD (30M)
Market State:
Ethereum just completed a sharp impulsive sell-off and is now transitioning into a consolidation phase, not continuation. Momentum has cooled, signaling balance between buyers and sellers after liquidation.
Key Levels:
– Resistance Zone: 2,960 – 2,980
– Support Zone: 2,890 – 2,900
– Current Range: Tight compression inside these boundaries
Price Action:
– The strong bearish impulse was followed by range acceptance, a classic sign of post-distribution absorption.
– Price is rotating inside the box, suggesting liquidity building, not trend acceleration.
Next Expected Behavior:
– Short-term: continued range trading between support and resistance.
– Upside scenario: clean acceptance above 2,980 opens room for a corrective push higher.
– Downside scenario: loss of 2,890 exposes deeper continuation toward lower demand.
Bias:
Neutral → reactive.
Trade the edges, not the middle.
ETH is not trending it’s compressing.
Direction will be revealed only after range resolution, not before.

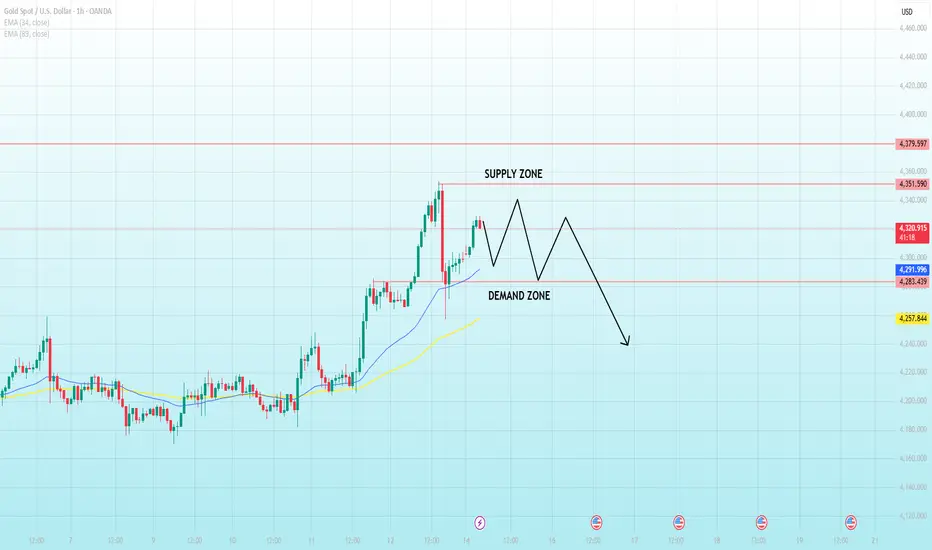
Gold Is Tricking Everyone Right Now-The Real Move Hasn’t StartedGOLD MARKET ANALYSIS – XAUUSD (H1)
1. Market Structure Overview
- Gold is currently in a short-term corrective phase after failing to immediately break above the 4350 Resistance Zone.
- The market has transitioned from impulsive bullish expansion into a controlled pullback, forming a range-bound structure between resistance and support.
- Despite the pullback, the overall structure remains bullish, as price is still holding above the last major breakout base.
This move is corrective, not distributive.
2. Key Support & Resistance Zones
Major Resistance Zone:
🔴 4350 – 4355
→ Previous rejection zone + supply absorption area.
Highest High / Target:
⚫ 4381
→ Liquidity magnet above range highs.
Major Support Zone:
🟢 4255 – 4260
→ Strong demand zone and reaction base.
This range defines the current battlefield between buyers and sellers.
3. Market Scenarios
Primary Scenario – Support Hold → Bullish Continuation (High Probability)
Price continues to pull back into the 4255 support zone.
Sellers lose momentum inside support.
Buyers step in, forming a higher low.
Gold rotates back toward resistance.
🎯 Targets: 4350 – 4355
Extension toward 4381 (Highest High / Liquidity Target)
This matches the classic sequence:
Pullback → Support reaction → Trend continuation
Alternative Scenario – Range Expansion Failure (Low Probability)
Only valid if 4255 breaks with strong momentum.
This would trigger a deeper correction toward 4200 – 4220.
No structural evidence currently supports this scenario.
4. Market Psychology & Liquidity Behavior
- Late buyers are getting shaken out during the pullback.
- Smart money is not selling aggressively volume is decreasing into support.
- Price behavior shows liquidity recycling, not panic selling.
- This is a textbook cooling phase before continuation.
The market is pausing to reset momentum, not reversing.
5. Trading Bias & Execution Insight
Bias: Bullish after correction
No chasing price in the middle of the range.
Best opportunities:
✔ Buy reaction from 4255 – 4260
✔ Buy breakout & hold above 4355
Patience is required the expansion comes after compression.
Gold is respecting its structure perfectly:
Correct → Hold support → Reload → Break higher.

Gold Is Not Stopping — This Is a Breakout Preparation, Not a TopGOLD (XAUUSD) — 4H MARKET ANALYSIS
1. Market Structure Overview
- Gold is maintaining a strong bullish market structure on the H4 timeframe. The sequence of higher lows remains intact, confirming that buyers are firmly in control.
- Price has already completed a strong impulsive leg and is now pausing just below the previous all-time high (ATH) a classic continuation setup rather than exhaustion.
2. Key Technical Zone
- Previous ATH / Resistance: ~4380
- Price is consolidating directly beneath resistance, not rejecting from it.
- The consolidation range is tight and orderly → a sign of strength.
This behavior shows acceptance near highs, which typically precedes breakout continuation.
3. Bullish Consolidation Logic
Inside the highlighted resistance box:
- Higher lows continue to form
- Pullbacks are shallow
- Sellers fail to push price meaningfully lower
This is bullish compression, where supply is absorbed while demand stays active.
In strong trends, the market does not drop it moves sideways before expanding higher.
4. Scenario Outlook
Primary Scenario (High Probability):
- Continued consolidation just below 4380
- Minor intraday pullbacks holding higher lows
- Break and acceptance above previous ATH
- Expansion into price discovery → New ATH
Projected flow:
Consolidation → Breakout → Retest (optional) → Strong continuation
Invalidation:
Only a decisive H4 close back below the consolidation base would weaken this bullish outlook. Currently, there is no such signal.
5. Market Psychology & Conclusion
This phase is designed to:
- Shake out early buyers
- Trap late sellers
- Reward disciplined trend followers
Conclusion:
Gold is structurally strong, technically aligned, and preparing for a new all-time high. Sideways movement here is not weakness it is fuel being built for the next impulsive leg.
When price refuses to fall at resistance, the breakout is already loading.

This Pullback Is Not a Reversal — It’s Fuel for the Next Leg UpGOLD (XAUUSD) — 4H MARKET ANALYSIS
1. Market Structure Overview
Gold remains in a clear bullish trend on the H4 timeframe. The market continues to respect a well-defined ascending trendline, forming consistent higher highs and higher lows.
The recent decline is a technical pullback, not a trend shift. Price is correcting within structure, which is a necessary condition for trend continuation.
2. Pullback Behavior & Trend Logic
Every major impulsive leg has been followed by a controlled pullback, marked on the chart.
These pullbacks consistently respect dynamic support and the rising trendline.
The current retracement shows loss of bearish momentum, indicating sellers are corrective, not dominant.
This confirms a bullish market rhythm:
Impulse → Pullback → Expansion
3. Key Support & Resistance Zones
Primary Support Zone:
The highlighted green support area acts as a demand zone where buyers previously stepped in aggressively.
Trendline Support:
The rising trendline remains intact as long as price holds above it, bullish structure is preserved.
Immediate Resistance:
The prior high zone above the current range. Acceptance above this level opens space for continuation.
4. Forward Scenarios
Primary Scenario — Trend Continuation (High Probability):
- Price holds within the support zone
- Forms a higher low
- Breaks above short-term resistance
- Expands upward following the dominant trend
Projected behavior:
➡ Shallow dip → base formation → impulsive breakout
➡ Continuation toward new highs
Invalidation Scenario:
Only if price breaks and closes below the trendline with momentum would this bullish setup weaken. At present, there is no structural confirmation of that outcome.
5. Market Psychology & Conclusion
This is where impatient traders exit, while smart money accumulates.
Pullbacks inside an uptrend are opportunities, not warnings.
The market is compressing energy inside structure, preparing for the next expansion.
Conclusion:
Gold is not topping it is resetting momentum within an uptrend. As long as the support zone and trendline hold, the path of least resistance remains upward.
Strong trends reward patience — not prediction. Trade the structure, and let the trend do the work.

Bitcoin Is Pausing at Demand — The Market Needs TimeMARKET BRIEFING – BTC/USD (1H)
Market State:
– Bitcoin has completed a sharp impulsive drop into a well-defined demand zone, followed by immediate stabilization.
– Price is now transitioning into a sideways consolidation phase, signaling absorption rather than continuation lower.
Key Levels:
– Demand Zone: 85,100 – 85,300
– Range Mid / Balance: ~85,800 – 86,000
– Upper Range Resistance: 87,000 – 87,200
– Major Resistance / Breakdown Point: ~87,700 – 88,000
Price Action Read:
– The sell-off flushed liquidity below prior structure, then stalled a classic sell-side exhaustion signal.
– Short-term candles show compression and failed downside follow-through, consistent with range-building behavior.
Next Move:
– Expect continued sideways rotation inside the demand zone.
– A clean reclaim of 87,000 opens room for a recovery push toward 87,700–88,000.
– Failure to hold 85,100 would invalidate the base and reopen downside risk.
Bottom Line:
Bitcoin is not breaking it’s digesting the move.
Until price exits the range with acceptance, patience beats prediction in this phase.
What do you think about BITCOIN at this level?

ElDoradoFx – GOLD ANALYSIS (17/12/2025, ASIA SESSION)
1️⃣ Market Overview
Gold is trading around $4,300–$4,304, consolidating after the sharp US rebound from the $4,270–$4,285 demand zone.
The market is currently in a compression phase, balancing between descending short-term resistance and rising higher-timeframe support.
With multiple high-impact USD events scheduled today (UK time), current price action reflects positioning and liquidity building, not true directional commitment. Expansion is expected later.
⸻
2️⃣ Technical Breakdown
🔹 Daily (D1)
• Macro structure remains bullish.
• Recent rejection from $4,381 weekly high triggered a corrective pullback.
• Price is holding above:
• Rising daily trendline
• HTF demand zone: $4,000–$4,086
• No daily structure break as long as $4,270 holds.
➡️ Daily Bias: Bullish continuation after correction.
⸻
🔹 H1
• Structure is neutral-to-bullish.
• Price compressing between:
• Descending resistance: $4,315–$4,325
• Rising support from $4,270
• EMAs flattening → classic pre-news behaviour.
• Liquidity pools:
• Above: $4,315 → $4,335
• Below: $4,290 → $4,270
➡️ H1 Bias: Awaiting expansion.
⸻
🔹 15M – 5M
• Short-term structure shows higher lows from the $4,275 sweep.
• Momentum is slowing → Asia/London manipulation risk.
• Multiple shallow BOS attempts → liquidity grab environment.
• Best entries expected after a sweep, not at current mid-range price.
⸻
3️⃣ Fibonacci Analysis (Golden Zones)
📈 BUY Swing: $4,271 → $4,315
• 38.2% → $4,298
• 50.0% → $4,293
• 61.8% → $4,287
🟩 Primary BUY Golden Zone: $4,298–$4,287
⸻
📉 SELL Swing: $4,335 → $4,300
• 38.2% → $4,313
• 50.0% → $4,318
• 61.8% → $4,323
🟥 Primary SELL Golden Zone: $4,313–$4,323
⸻
4️⃣ High-Probability Trade Scenarios
✅ BUY Scenario (Main Bias)
• Entry Zone: $4,298–$4,287
• Targets: $4,315 → $4,335
• Invalidation: Below $4,270
• Confirmation:
• 5M BOS
• Strong bullish reaction from fib discount
• Hold above rising trendline
⸻
🚀 BUY Breakout Scenario
• Trigger: Clean break & hold above $4,325
• Retest Zone: $4,315–$4,325
• Targets: $4,345 → $4,381
• Invalidation: Below $4,300
⸻
⚠️ SELL Scenario (Countertrend Only)
• Entry Zone: $4,313–$4,323
• Targets: $4,300 → $4,287
• Invalidation: Above $4,335
• Condition: Clear rejection + lower-TF structure failure
⸻
🔻 SELL Breakdown Scenario
• Trigger: Break & close below $4,270
• Retest: $4,275–$4,280 failure
• Targets: $4,255 → $4,240
• Invalidation: Above $4,298
⸻
5️⃣ Fundamental Watch (UK Time)
⚠️ HIGH-IMPACT USD DAY
• Multiple high-impact USD releases & events today.
• Expect:
• False London moves
• Stop hunts around $4,300
• Real expansion during US session windows
• Risk management is critical:
• Reduced lot size
• Wait for post-news confirmation
⸻
6️⃣ Key Technical Levels
Resistance:
• 4,313
• 4,323
• 4,335
• 4,381
Support:
• 4,298
• 4,287
• 4,270
• 4,255
Breakout Levels:
• Bullish → Above $4,325
• Bearish → Below $4,270
⸻
7️⃣ Analyst Summary
Gold is not trending right now — it is positioning.
The structure strongly suggests liquidity accumulation before a decisive move driven by fundamentals.
Chasing entries in the middle of the range is low-probability.
Patience around key fib zones + news timing will offer the highest edge.
⸻
8️⃣ Final Bias Summary
🟢 Bullish bias above $4,270
🔴 Bearish only on confirmed breakdown below $4,270
⏳ Expect expansion after high-impact USD news
⸻
🥇 ElDoradoFx PREMIUM 3.0 – PERFORMANCE 16/12/2025 🥇
⚡ Controlled risk. Explosive reward.
📉 BUY -30 PIPS ❌
📉 SELL -40 PIPS ❌
📉 SELL +60 PIPS
📈 BUY +590 PIPS
📉 SELL -40 PIPS ❌
📉 SELL +20 PIPS
📈 BUY +120 PIPS
📈 BUY +230 PIPS
━━━━━━━━━━━━━━━
🎥 LIVE TRADING SESSION
📈 BUY +50 PIPS
📈 BUY +350 PIPS
━━━━━━━━━━━━━━━
💎 SWING TRADES – STILL RUNNING
🔵 BUY → +3,810 PIPS
🟣 BUY → +3,400 PIPS
🟢 BUY → +2,140 PIPS
━━━━━━━━━━━━━━━
💰 TOTAL PIPS GAIN: +1,310 PIPS
🎯 10 Signals → 7 Wins | 3 SL
📊 Accuracy: 70%
━━━━━━━━━━━━━━━
🔥 Big swing delivery + live-session precision = strong net-positive day.
Risk controlled. Profits scaled.
— ElDoradoFx PREMIUM 3.0 Team 🚀📈

OVERVIEW GOLD (PRICE ACTION) M30 I 12/16📌 Market Context
After failing to hold higher price levels, XAUUSD has clearly reversed to the downside, shifting from balance into a short-term bearish trend. The current structure shows that sellers are in control.
📉 Market Structure & Price Action
Price is forming consecutive lower highs and lower lows, confirming a downtrend on M30.
The descending trendline is being respected well → every pullback is met with selling pressure.
Bearish candles have strong bodies with weak retracements → selling momentum dominates, buying pressure remains limited.
📊 Key Price Zones
Resistance / Supply zone: ~4305 – 4310
→ Price has attempted to recover multiple times but failed to break above, confirming this as a strong sell zone.
Support / Demand zone below: ~4270 – 4280
→ The next area where a technical reaction or short-term bounce may occur.
🎯 Potential Scenarios
1️⃣ Primary scenario – continuation lower:
Price pulls back toward 4305 – 4310 but fails to break the descending trendline
Bearish rejection appears → continuation to the downside, targeting the lower demand zone
2️⃣ Short-term corrective bounce:
If price breaks the descending trendline and reclaims above 4310
A deeper pullback may occur, but this alone is not enough to confirm a trend reversal
⚠️ BUY positions remain high risk unless:
Bearish structure is clearly broken
Market shifts to higher highs and higher lows on M30
🧠 Summary
Short-term trend: BEARISH
Preferred strategy: Sell on rallies, avoid bottom-fishing
Focus on price reactions around the trendline and supply zones
In this environment, waiting for pullbacks to sell is far safer than trying to predict the bottom.

Ethereum Set for a Rally: Can It Break Key Resistance?Ethereum (ETH/USD) – 1-Day Chart
Current Market Structure:
Ethereum is in a clear ascending channel with higher lows and higher highs, indicating a potential bullish trend. The price is currently consolidating within this channel and preparing for a potential breakout to the upside.
Key Levels:
Support Zone: $2,633.61 - The price has consistently bounced off this zone, showing strength.
Resistance Zones: $4,716.90
Take Profit 1: $3,612.44
Take Profit 2: $4,188.23
Take Profit 3: $4,716.90
Most Probable Scenarios:
1. Bounce from Support: Ethereum is likely to continue its upward movement, testing the first take-profit target at $3,612.44.
2. Consolidation: Price may continue to consolidate within the channel before making a final move higher.
3. Breakout to the Upside: If Ethereum successfully breaks above the upper boundary of the channel, a move toward the next resistance levels (Take Profit 2 and Take Profit 3) is expected.
Actionable Advice:
Buy near the lower boundary of the channel, aiming for Take Profit 1 at $3,612.44.
Hold if price reaches the higher resistance levels ($4,188.23 and $4,716.90).
Risk Management:
Place stop-loss orders below the support zone around $2,633.61 to protect against unexpected price action.

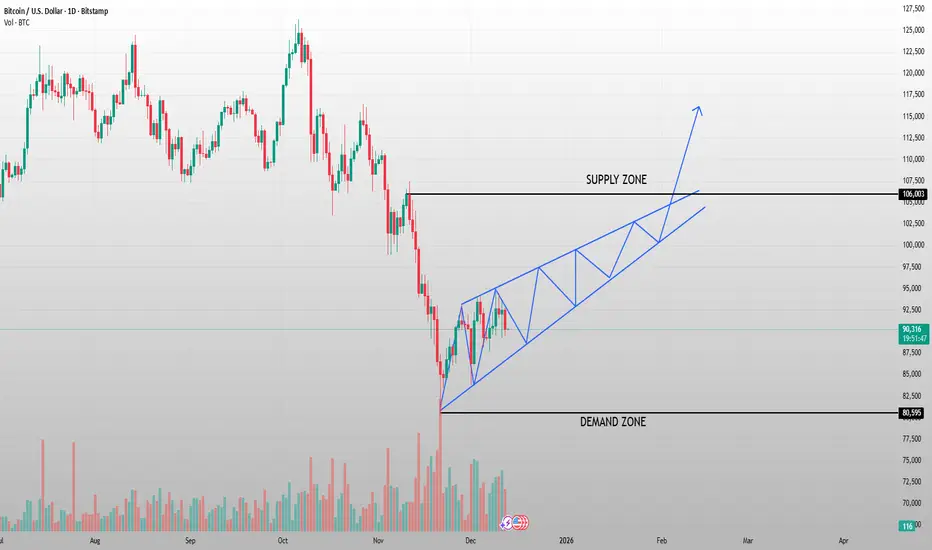
Bitcoin's Critical Test:Will Upcoming News Drive It Beyond $106KHELLO TRADERS....
Bitcoin (BTC/USD) – 1-Day Chart
Current Market Structure:
Bitcoin is currently forming an ascending triangle pattern, with higher lows establishing a clear demand zone at $80,595 and a supply zone at $106,003. This structure suggests a potential continuation to the upside if price breaks the resistance zone.
Key Levels:
Demand Zone: $80,595
Supply Zone: $106,003
Target Zone: If the resistance is broken, the next possible target is above the supply zone, indicated by the blue trendline.
Most Probable Scenarios:
1. Breakout to the Upside: Bitcoin may break above the supply zone and move towards new highs, targeting the upper trendline as shown in the chart.
2. Consolidation: Price could continue to consolidate within the ascending triangle pattern before a final breakout.
3. Rejection at Supply Zone: If Bitcoin fails to break the resistance, it might experience a pullback toward the demand zone.
Actionable Advice:
Buy if Bitcoin breaks above the supply zone with strong volume, targeting the next resistance at higher levels.
Sell if price rejects the supply zone, waiting for a retest of the demand zone for potential re-entry.
Patience: As Bitcoin is consolidating in a defined range, waiting for confirmation at key levels is crucial to avoid false breakouts.
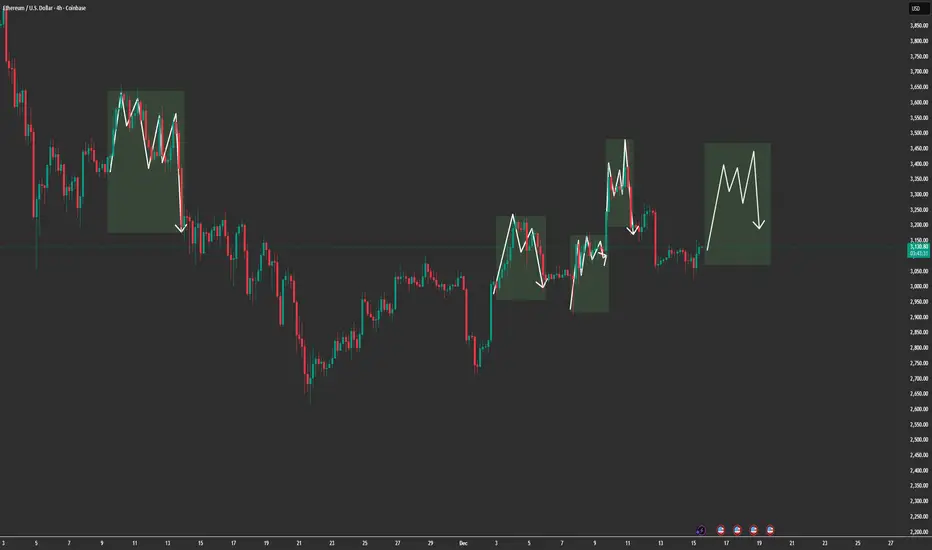
“ETH Is Repeating the Same Trap — Range First, Direction LaterMARKET BRIEFING – ETH/USD (4H)
Market State:
– Ethereum remains in a range-bound structure, repeatedly forming distribution-like consolidations after short impulsive moves.
– Each highlighted box shows the same behavior: push up → choppy consolidation → downside rotation. Current price action is aligning with that same rhythm.
Key Levels:
– Range Mid / Balance: ~3,120 – 3,150
– Upper Supply Reaction Zone: ~3,300 – 3,450
– Lower Demand / Rotation Target: ~3,000 – 3,050
– Breakout Invalidation: Clean acceptance above ~3,450
Price Action Read:
– The market is not trending it is cycling liquidity inside a broad range.
– Failed follow-through after bullish pushes signals seller absorption at higher prices.
– Current consolidation suggests another rotation phase, not immediate continuation.
Next Move:
– Sideways to slightly bearish rotation remains favored while below the upper supply zone.
– A sweep toward the lower range (~3,000–3,050) is a high-probability magnet.
– Only a strong break and acceptance above 3,450 would invalidate the range-play and shift bias bullish.
ETH is not breaking out it’s repeating structure.
Until price escapes the range with acceptance, rotation beats prediction.
Gold Is Pulling Back Before the Next ExpansionMARKET BRIEFING – XAUUSD (H1)
Gold remains in a clean bullish structure on H1. The recent pullback is corrective, not a reversal. The sharp bearish candle was a liquidity sweep, immediately absorbed by strong buying confirming buyers are still in control and structure stays HH–HL.
Key Levels:
– Main Support (Demand): 4260 – 4270
– Current Range: 4270 – 4350
– Upside Targets:
• TP1: 4350 – 4360
• TP2: 4380 – 4390
Price Action Read:
Sell-side liquidity has been absorbed inside the support zone. Long lower wicks show aggressive demand. Price is consolidating above support a re-accumulation phase within the uptrend, building energy for the next expansion.
Scenario:
➡️ Bullish Continuation (Primary):
Hold above 4260 → consolidate → push higher → break toward TP1, then TP2.
Pullbacks into support = continuation setups, not weakness.
❌ Invalidation:
A decisive H1 close below 4260 would delay the bullish expansion and open room for a deeper correction.
Bias: Buy pullbacks. Don’t chase highs.
Gold is not distributing it’s loading the next impulsive leg.

Strong impulse, now hesitation - is gold pausing....Market context
Gold printed a strong impulsive leg from the 4,240–4,260 base, accelerating into the 4,350–4,360 supply area before facing a sharp rejection. Since then, price has transitioned into consolidation, holding above the prior breakout region rather than unwinding the entire move.
This behavior suggests short-term balance after expansion, not immediate trend failure.
Current structure
- Supply zone: ~4,350–4,360, where the impulsive leg was capped
- Range mid / current price: ~4,320–4,330
- Demand zone: ~4,280–4,290, aligned with the last breakout and rising EMA support
Price remains above the rising EMA 34 (~4,292) and EMA 89 (~4,258), keeping the intraday structure constructive despite the loss of momentum. Candles are overlapping, reflecting indecision and rotational flow rather than directional commitment.
Scenarios
➡️ Primary scenario:
If buyers continue to defend the 4,280–4,290 demand area, price may remain rotational before attempting another push toward the 4,350–4,360 supply zone.
⚠️ Risk scenario:
A sustained break below 4,280, followed by acceptance under the EMA structure, would weaken the bullish bias and expose a deeper pullback toward the 4,240–4,250 liquidity area.
Gold Just Paused at a Strange Level What is Coming Nex🔹 MARKET BRIEFING – XAU/USD (1H)
Market State:
– Price has broken out of the short-term consolidation, followed by a clean retest structure forming right at the breakout zone a classic continuation signal.
Key Levels from Chart:
– Entry Zone: around the retest area just above 4280–4286
– Stop Loss: 4262 – 4264
– Take Profit 1: 4317
– Take Profit 2: 4381
Next Move:
– As long as price holds above the SL zone and respects the breakout retest structure, XAU/USD is positioned for a continuation leg toward 4317, with potential extension toward 4381.

Ethereum 1H: Holds Its Bullish Channel 🔹 MARKET BRIEFINGMarket State:
– Price is pulling back from the channel’s upper resistance and is now stabilizing around mid-range, while still respecting the ascending channel structure.
Key Levels:
– Support: 3,160
– Resistance: 3,440
– Breakout Zone: 3,440 – 3,520
Next Move:
– Bullish bias remains intact as long as ETH continues to hold above the channel’s support; reclaiming 3,440 would open momentum toward 3,520 and potentially the upper boundary.
The bullish structure on XAUUSD has now been fully established and this is a valid buy signal at the current price.
Momentum, structure, and demand alignment are all pointing in the same direction, confirming that buyers are in control and the market is ready for the next upward leg.
Why ETH Dropped After the Fed Rate Cut
1. Macro Overview – Why ETH Pulled Back Even After the Fed Cut
Despite the Fed cutting interest rates a move typically supportive for risk assets ETH corrected sharply due to short-term “sell the news” positioning, profit-taking from the recent rally, and liquidity reshuffling as markets reassessed the pace of future cuts. However, the broader macro environment still favors long-term bullish continuation: lower borrowing costs, easing financial conditions, and improving risk appetite all support capital rotation back into crypto once volatility cools. In other words, yesterday’s drop was a tactical shakeout, not a structural trend reversal, and the market is now forming a sideways accumulation phase consistent with a bullish continuation setup.
2. Market State
ETH is pulling back from the ascending channel’s upper resistance and is now stabilizing around the mid-range. The price is still respecting the channel structure, indicating that buyers are absorbing supply and forming a consolidation base rather than breaking trend. This aligns with a sideways phase before the next expansion leg upward.
3. Key Levels
Support: 3,160
Resistance: 3,440
Breakout Zone: 3,440 – 3,520
4. Next Move
The bullish bias remains intact as long as ETH trades above the channel’s support. Reclaiming 3,440 would signal renewed buyer strength and open a clean path toward 3,520, with potential continuation into the channel’s upper boundary. Until then, ETH is likely to move sideways within the range as the market digests the macro shift and prepares for the next bullish leg.

XAUUSD, Expecting sell from 4220XAUUSD, I am Expecting sell from 4220 with targets of 4208 & 4187 area.
good luck

Gold Just Flipped Structure.....The market just transitioned from a bearish sequence into early bullish structure. Most traders will miss this shift but if you understand BOS, ChoCH, and liquidity behaviour, this is where smart money prepares for the next leg up.
1. Market Structure Overview
Your chart shows a full bearish sequence (LH–LL) that has recently transitioned:
-Multiple Lower Highs (LH) and Lower Lows (LL) → clear bearish structure.
-A Change of Character (ChoCH) occurs at the key zone → first signal of reversal.
-A clean Break of Structure (BOS) to the upside confirms buyers stepping in.
-Price then creates a Higher Low (HL) followed by Higher Highs (HH) → early bullish trend established.
This is a textbook reversal from bearish → bullish.
2. Key Zones Identified
Support Zone (Demand)
Located around 4195 – 4174
→ This is where the ChoCH and HL formed, confirming buyer strength.
Resistance Zone (Supply)
Located around 4219 – 4229
→ Price is currently approaching this zone. If it breaks, bullish continuation is expected.
3. Price Behaviour & Expectation
Your yellow projection is correct:
- Price may pull back into the minor support (near current level).
- After that, a bullish leg toward 4219 zone is expected.
- If BOS occurs above 4229, price has room to expand toward new highs around 4238–4244.
This aligns perfectly with the HH → HL structure forming now.
4. Trading Logic
Why bullish?
- Clear BOS on bullish side
- Higher Low forming above support
- Liquidity taken from previous LL
- Price respecting the new bullish structure
Invalidation
If price breaks below 4174, bullish structure is invalidated.
5. Trade Signal
This follows your trading style — structure-based, clean, and logical.
📌 BUY ENTRY: 4203 – 4207
(Retesting minor support + inside new bullish structure)
📌 STOP LOSS: 4178
(Below HL and below ChoCH zone — strong invalidation)
📌 TAKE PROFIT 1: 4219
(Retest of resistance zone)
📌 TAKE PROFIT 2 (Main Target): 4229 – 4233
📌 TAKE PROFIT 3 (Extended Target): 4242 – 4244
Risk–Reward:
1 : 2.5 up to 1 : 4 depending on TP

ETH Is Reloading — The Next Expansion Will Shock the Market.ETHEREUM 4H MARKET ANALYSIS
1. Current Price Structure
- ETH previously completed a strong impulsive wave up, breaking through multiple resistance levels until it reached the major resistance zone at 4,800–5,000.
- From that zone, price entered a clear distribution phase, followed by a large corrective decline, shown by the descending dotted trendline on your chart.
- Recently, ETH formed a large accumulation range (marked in green), similar to the accumulation phases earlier in the chart where massive trends began.
- Price is currently respecting the bottom of this range, showing signs of building higher lows inside the zone.
2. Liquidity Zones
- Major resistance zone: 4,800–5,000 (the next big target once the accumulation completes).
- Accumulation zone: 2,750–3,150 (where the current building structure is taking place).
- This zone is identical in behavior to the previous accumulation block that preceded the massive ETH rally in mid-year.
- Liquidity has been swept multiple times inside this green zone, indicating smart money absorption.
3. Today’s Market Scenario
This matches the green projection you drew:
🔹 Main Scenario – Bullish Breakout After Accumulation
ETH is likely to:
- Continue ranging inside the accumulation block → building a complex structure of higher lows and equal highs.
- Break the descending trendline with a bullish structure shift.
- Retest the breakout zone creating the final HL inside the range.
- Expand upward, targeting the mid-resistance area around 3,600 – 3,800.
- Continue the larger expansion toward the large resistance zone at 4,800 – 5,000.
This scenario aligns perfectly with your chart’s projected movement.
4. Market Psychology
- Big players are clearly absorbing positions in this wide range.
- Retail traders are getting shaken out by constant spikes up and down.
- This sideways accumulation is typical before a major bullish run.
- Same behavior occurred in earlier zones of your chart → accumulation → breakout → expansion.
- Market is preparing energy for a strong uptrend once liquidity collection is complete.
5. Intraday Strategy Guidance
- No aggressive selling inside the accumulation range — smart money is buying here.
- Look for false breakdowns, wick sweeps, liquidity grabs at the bottom of the green zone.
Best setups:
+ Buy the bottom of the range
+ Buy retest after trendline breakout
+ Targets: 3,600 → 4,000 → 4,500+
This zone is where big investors position themselves before the trend reversal.

Gold: consolidation and the search for directionGold has been trading in a range in recent days, maintaining a balance between buyers and sellers. The movement remains restrained: upward impulses are followed by pullbacks, while the price holds within the consolidation zone.
The chart shows the formation of a structure that does not give a clear advantage to either side. On one hand, interest in safe-haven assets supports demand for gold; on the other, dollar strength limits growth.
The current situation points to a waiting phase: the market is accumulating energy, and the next breakout of key levels will determine the further direction. For now, gold remains in a neutral zone, where both continued growth and the development of a correction are possible.
