Gold Respects EMA 50 — Short-Term Bullish Continuation in FocusGold (XAUUSD) on the 30-minute timeframe is showing early signs of bullish continuation after completing a healthy pullback within a broader recovery structure. Following the prior impulsive leg higher, price corrected in a controlled manner and has now reacted cleanly from the EMA 50, confirming it as dynamic support.
The recent higher low formed along the ascending trendline indicates that buyers are still in control of the short-term structure. This pullback appears corrective rather than impulsive, suggesting the market is reloading for the next expansion phase instead of reversing.
Price is currently trading back above the EMA 50 and holding above the 4,458–4,460 intraday support area, which acts as a key pivot zone. As long as this level holds, bullish continuation remains the preferred scenario.
On the upside, the next liquidity objectives are clearly defined. The 4,495–4,500 zone marks the first resistance and reaction area, followed by the higher-timeframe target near 4,545–4,550, where previous highs and resting liquidity sit.
Trading Plan:
Bullish scenario: Holding above the EMA 50 and the 4,458 support opens the door for continuation toward 4,495, with extension toward 4,545–4,550 if momentum accelerates.
Bearish scenario: A loss of the EMA 50 followed by acceptance below 4,440 would invalidate the short-term bullish setup and expose a deeper pullback toward 4,420–4,400.
Overall, Gold is behaving technically clean on M30. As long as price respects dynamic support, the bias remains buy-the-dip, with confirmation favored over anticipation.
Analysis

EURUSD Stays Under Pressure — Bearish Continuation Still in PlayEURUSD on the H1 timeframe continues to trade within a clear bearish trend, with price respecting a descending structure and printing consistent lower highs and lower lows. The overall market context remains firmly bearish, with sellers maintaining control.
Price is currently trading below the EMA, which is acting as dynamic resistance. The recent pullback into the EMA area was met with rejection, confirming classic sell-the-rally behavior rather than any meaningful bullish recovery. This reaction reinforces the idea that the move up was corrective, not impulsive.
Structurally, the market has now pushed back toward the 1.1640 area, and downside pressure remains active. As long as price stays capped below the EMA and the descending trendline, the path of least resistance continues to favor further downside.
Below current price, the next key liquidity objectives sit around 1.1590 and 1.1555, where resting demand and prior reaction lows are located. These levels are natural downside magnets if bearish momentum persists.
Bearish scenario (preferred): As long as price remains below the EMA and the descending trendline, continuation toward 1.1590 is favored, with extension toward 1.1555 if selling pressure accelerates.
Bullish invalidation: Only a strong reclaim and acceptance above 1.1670–1.1680, followed by a clear structure break, would invalidate the bearish continuation bias.
At this stage, EURUSD remains in a controlled bearish environment. Patience is key — the highest-probability opportunities continue to come from selling pullbacks into resistance, not from attempting to catch bottoms in a trending market.

EURUSD Breaks Support — Sellers Target Deeper LiquidityPrice has cleanly broken and closed below the 1.1645 support, confirming a continuation of the bearish market structure with lower highs and lower lows firmly in place. Selling pressure remains dominant, and recent pullbacks are being sold aggressively.
As long as price stays below 1.1650, any short-term bounce is likely corrective and vulnerable to renewed downside pressure.
A sustained move lower opens the path toward 1.1620, followed by the major liquidity target near 1.1590. Only a strong reclaim back above 1.1680 would invalidate the bearish continuation scenario and signal a potential shift in short-term momentum.

Ethereum Breaks Descending Structure — Is a Fresh Bullish Leg UnEthereum (ETHUSD) on the H1 timeframe is showing a notable shift in short-term structure after breaking cleanly above a well-defined descending trendline. This trendline had capped price throughout the recent corrective phase, so the breakout signals that bearish momentum is fading and buyers are beginning to regain control.
The prior move down now appears corrective within a broader bullish context rather than the start of a trend reversal. Price has formed a higher low after the breakout and is stabilizing above the 3,080–3,100 support zone, confirming this area as a key demand base and structural pivot.
With the trendline broken, the market is transitioning from sell-the-rally behavior into a potential buy-the-dip environment, provided price continues to hold above the breakout area.
Overhead, ETH faces a sequence of clear resistance levels that will define the strength of any continuation:
- 3,180 – first reaction and intraday structure resistance
- 3,260 – prior consolidation high and liquidity magnet
- 3,300–3,320 – major resistance and key upside objective
Bullish: As long as price holds above 3,080–3,100 and respects the broken trendline, continuation toward 3,180, then 3,260, becomes likely. Acceptance above these levels opens the path toward 3,300+.
Bearish: A failure to hold above the breakout zone and a sustained move back below 3,080 would invalidate the bullish shift and suggest a return to range or deeper correction.
At this stage, Ethereum is at a post-breakout validation phase. Patience is key the highest-probability opportunities come from holding above the broken trendline or clean continuation through resistance, not from chasing price mid-structure.

Gold at Resistance While Riding the EMAHello traders! Here’s a clear technical breakdown of XAUUSD (4H) based on the current chart structure.
Gold remains within a broader bullish trend, established by a strong sequence of higher highs and higher lows. After an impulsive rally into the upper range, price is now stalling beneath a key resistance zone, signaling a pause in bullish momentum rather than an immediate reversal.
The recent candles show compression and reduced follow-through, suggesting buyers are becoming cautious as price trades near premium levels. At the same time, sellers have not yet delivered a decisive bearish impulse, keeping the structure technically bullish but vulnerable to a corrective move.
🟦 SUPPLY & DEMAND – KEY ZONES
Major Resistance / Supply Zone:
The 4,520–4,550 area is a well-defined resistance zone, where prior rallies were rejected. This zone represents strong overhead supply and is the main barrier for bullish continuation.
Dynamic Support (EMA Confluence):
Price is currently hovering near the EMA 34 and EMA 89, a critical dynamic support cluster. The EMA 89, in particular, has acted as a reliable trend support during previous pullbacks.
Key Support Zone:
Below current price, the 4,270–4,300 region stands out as a major demand zone. A move into this area would represent a deeper but still healthy correction within the broader uptrend.
🎯 CURRENT MARKET POSITION
Currently, Gold is trading just below resistance while sitting on dynamic EMA support, placing price at a high-impact decision area. This positioning often precedes either a continuation breakout or a corrective rotation lower to rebalance liquidity.
The market is no longer impulsive; it is waiting for confirmation.
🧠 MY SCENARIO
As long as Gold fails to break and hold above the 4,520–4,550 resistance zone, the probability favors a corrective pullback toward the EMA 89, and potentially into the 4,270–4,300 support zone, before buyers attempt another push higher.
If price can accept above resistance with strong bullish momentum, that would invalidate the pullback scenario and open the door for trend continuation toward new highs.
For now, this remains a bullish market in correction mode, not a trend reversal.
⚠️ RISK NOTE
Price is trading at a premium decision level. Wait for confirmation at resistance or support, avoid chasing breakouts, and always manage your risk.

Gold Analysis Using Smart Money Concepts & IctGold has already taken major ssl liquidity, & show strong bullish move, so we can expect bullish move until it take 5000 important lv.
Market give strong bos + Gap up, now we have 2 important area scoob & poi , from which we can expect next bullish move. POi is the 1hr order flow.
which we are going on buy side?
1] Market give bullish bos.
2] Major ssl alreday tajen/
3] Respecting bullish poi

EURUSD Possible False Break ScenarioQuick Summary
EURUSD broke the bearish price channel without sweeping the previous low, This increases the probability of a return lower to take liquidity.
The strong bullish weekly open left a liquidity void behind thats mean the Price may drop again to rebalance the FVG or the channel break could be a false break to collect more liquidity.
Full Analysis
After EURUSD broke the bearish price channel, without performing a liquidity sweep of the previous low
This is an important detail because uncollected liquidity often attracts price back before any sustained continuation
The weekly open was strongly bullish which created a clear liquidity void below.
Such impulsive moves without proper rebalancing usually leave unfinished orders in the market
Because of this there is a strong possibility that price returns lower to rebalance the fair value gap and sweep the previous low.
Another scenario to consider is that the break of the bearish channel may be a false break
In this case price could be using the upside move only to attract additional liquidity before reversing back to the downside.

Fundamental Market Analysis for January 12, 2026 USDJPYOn January 12, USD/JPY is holding near 158.100, pulling back from recent highs amid a softer dollar and increased demand for safe-haven assets. The catalyst was news of political pressure surrounding the Fed, prompting some market participants to cut long-dollar exposure ahead of key US inflation data.
Near-term prospects for the pair largely depend on US yields: a sustained rise in consumer inflation could keep expectations of higher rates in place and support the dollar, thereby maintaining pressure on the yen. However, any repricing of the Fed’s rate path toward lower levels — as well as a drop in yields amid heightened uncertainty — typically supports a stronger JPY.
In Japan, the situation is mixed: the Bank of Japan has raised the policy rate to 0.75%, but cautious guidance on further steps has not yet given the market confidence in rapid additional tightening. Still, solid wage growth and inflation expectations support the discussion of another hike in Q1 2026. If US yields fall while expectations for a firmer BoJ stance grow, the balance of factors shifts in favor of yen strength.
Trading recommendation: SELL 158.100, SL 158.700, TP 156.300

EURUSD Bearish Continuation After PullbackQuick Summary
EURUSD broke below 1.16824, A corrective move toward the orderblock at 1.17143 is possible
This pullback is expected to act as a continuation zone for further downside and The main objective remains which is filling the liquidity void after the bullish trendline break
Full Analysis
After EURUSD successfully broke below the 1.16824 level the bearish structure remains valid
This break confirms that sellers are still in control following the loss of the previous bullish trendline
From here price may attempt a corrective move higher toward the orderblock around 1.17143
This area is viewed as a potential mitigation zone rather than a reversal point
If price reacts from this orderblock the expectation is continuation to the downside
The overall objective of this move is to continue filling the liquidity void that was left behind during the previous impulsive bullish move
As long as price remains below the broken structure this pullback is considered corrective
The bearish bias remains intact and the focus stays on downside continuation.

XAUUSD: Descending After Fake Breakout - Bears in ControlHello everyone, here is my breakdown of the current XAUUSD setup.
Market Analysis
XAUUSD initially spent a prolonged period trading inside a well-defined range, where price respected clear support and resistance boundaries. This range reflected market indecision, with neither buyers nor sellers able to gain sustained control. Eventually, price broke out to the upside, confirming bullish intent and triggering a strong impulsive rally.
Currently, after the rejection, price broke back below short-term structure and started forming a descending triangular structure, defined by a clearly respected descending resistance line. Each bullish attempt toward this trendline has been rejected, signaling that sellers remain in control. At the same time, price is gradually rotating lower toward the 4,350 Support Zone, which previously acted as a key demand and breakout area.
My Scenario & Strategy
My primary scenario: as long as XAUUSD remains below the 4,490 Resistance Zone and continues to respect the descending resistance line, the bearish bias remains valid. Rejections from this trendline favor further downside continuation toward the 4,350 Support Zone, which is the first major downside target. If price breaks and accepts below the 4,350 Support Zone, this would confirm bearish continuation and open the door for a deeper corrective move toward lower support levels.
However, if buyers manage to reclaim the descending resistance line and achieve a clean breakout and acceptance above the 4,500 resistance area, the short bias would be invalidated and the market could transition back into bullish continuation. For now, structure favors sellers, momentum is weakening near resistance, and price remains capped below key supply.
That's the setup I'm tracking. Thank you for your attention, and always manage your risk.

BTCUSD Holds Buyer Zone - Bulls Target 91,500 ResistanceHello traders! Here’s my technical outlook of BTCUSD (2H) based on the current chart structure. BTC previously traded inside a well-defined range, where price moved sideways for an extended period, showing balance between buyers and sellers. This consolidation acted as an accumulation phase. A strong breakout to the upside from the range confirmed renewed bullish interest and initiated an impulsive move higher. Following the breakout, price respected a rising Support Line, forming a sequence of higher highs and higher lows, which confirms a bullish market structure. As BTC pushed higher, it reached the Seller Zone / Resistance Level around 91,500, where selling pressure emerged. Price reacted from this level and pulled back, indicating that sellers are actively defending this resistance. The pullback, however, remained controlled and corrective, with price returning toward the Buyer Zone, which aligns with a key Support Level around 89,200–90,000 and the rising support trend line. Currently, BTC is holding above the Buyer Zone and the ascending support line, showing that buyers are still defending structure. The recent price action suggests consolidation rather than a breakdown, keeping the bullish scenario valid as long as support holds. My scenario: as long as BTCUSD remains above the Buyer Zone and respects the rising Support Line, the bullish bias remains intact. I expect buyers to defend this area and attempt another push toward the 91,500 Resistance Level (TP1). A clean breakout and acceptance above resistance would confirm bullish continuation and open the door for further upside. However, a decisive breakdown below the Buyer Zone would weaken the structure and increase the probability of a deeper corrective move. For now, price is at a key decision area, and patience with proper risk management is essential. Please share this idea with your friends and click Boost 🚀

XAUUSD Rising Support Holds - Next Target 4,500 ResistanceHello traders! Here’s a clear technical breakdown of XAUUSD (4H) based on the current chart structure. After a prolonged consolidation phase, Gold was trading inside a well-defined range, indicating balance between buyers and sellers. This range acted as an accumulation zone before price initiated a bullish expansion. Following the breakout from the range, XAUUSD entered an ascending channel, confirming a shift toward buyer control with a sequence of higher highs and higher lows. During this phase, price respected both the channel support and resistance lines, using them as dynamic structure levels. As price approached the upper boundary of the channel and the Resistance / Seller Zone around 4,500–4,510, bullish momentum started to weaken. Multiple fake breakouts above resistance signaled strong selling pressure at the highs. This led to a sharp corrective move lower, where price broke below short-term structure before finding support. Currently, XAUUSD is holding above the Buyer Zone around 4,400, which aligns with a key Support Level and a prior breakout area. Price has already shown a reaction from this zone and is now forming higher lows along a newly respected rising support line, suggesting buyers are attempting to regain control. The recent breakout back above local resistance reinforces the idea of a corrective pullback rather than a full trend reversal. My scenario: as long as XAUUSD holds above the 4,400 Buyer Zone and respects the rising support line, the bullish bias remains valid. I expect buyers to defend this area and attempt another push toward the 4,500 Resistance / Seller Zone (TP1). A clean breakout and acceptance above this level would confirm bullish continuation and open the path for further upside. However, a decisive breakdown below the buyer zone would weaken the structure and increase the risk of a deeper correction back toward lower support levels. Please share this idea with your friends and click Boost 🚀

Commodities vs SP500Comparing commodities index vs SP500, it's at its lowest level since 1980.
It's time for a strong rebound ?

XRP (1D): Price Consolidation with On-Chain ActivityXRP has moved into a consolidation phase following a large expansion move. Price is currently trading well above the prior base, but below the cycle high, with volatility compressing on the daily timeframe.
At the same time, several on-chain metrics have continued to trend higher.
Observations from the chart
Price remains elevated relative to the long consolidation period prior to the breakout
The 1-year active supply percentage has increased, indicating more coins are moving on-chain compared to earlier periods
Active addresses have shown multiple spikes during and after the expansion, followed by normalization rather than collapse
New funded addresses increased sharply during the breakout phase and remain higher than pre-breakout levels
Total value locked rose materially during the advance and has retraced modestly while remaining above earlier levels
These metrics suggest broader participation compared to the pre-breakout period, even as price consolidates.
Interpretation
The current structure shows price stabilizing after a rapid repricing, while on-chain activity remains elevated relative to historical baselines. This points to redistribution and network usage rather than complete disengagement.
Price is no longer moving with the same momentum as during the expansion phase, but participation metrics have not reverted to prior lows.
What to monitor
Whether active supply and address activity remain elevated during consolidation
Whether price holds above the prior breakout area
Any renewed expansion in on-chain activity accompanying directional price movement
A decline in both price and on-chain participation would weaken this structure.
Summary
XRP is consolidating after a large move higher. On-chain metrics indicate higher engagement than during the prior base, while price trades within a defined range. Further direction likely depends on whether participation expands again or continues to level off.

Rising Wedge Pattern S&P 500There is clear a Rising Wedge Pattern formed on S&P 500 4h chart .
There was even a retracement from all-time highs of 6979 back inside the wedge before the weekend.
My suggested SL is 7030-7050 and TP 6500-6550 for the short-to-mid term.
On a larger scale, there is also a huge channel that we are testing the top of right now:
Going all the way back to 2008..
It could easily end up like this:
So for longer term I can see 6100, 5500, 5000 and if recession hits than even 3500.
There has never been such a major Fed hiking and cutting cycle that did not eventually cause a recession. Also, the labor market is weaker than the headline numbers make it seem. Lots of massive downward revisions on NFP. Even the unemployment number is growing slowly, mostly because Labor Force Participation is dropping. If we account for that, then the real unemployment rate is more like 5.5%.
Here are some more examples of rising wedges going back to the pandemic:

Bitcoin Is Building a Base — Accumulation Before the Next PushPrice is consolidating above the key support zone around 89,800–90,000, showing clear signs of selling pressure absorption after the recent sell-off. Volume behavior suggests potential accumulation rather than aggressive distribution.
As long as price holds above 89,800, the bullish scenario remains favored. A clean break and acceptance above 91,200–91,500 would confirm upside momentum, opening the path toward 93,000, followed by the major target near 94,700–95,000.
Only a decisive breakdown below 89,800 would invalidate the bullish setup. For now, buyers appear to be positioning for the next expansion leg to the upside.

Ethereum at Key Demand — Smart Money Accumulation Price is holding firmly inside a well-defined demand zone around 3,050–3,080, where sell-side liquidity has already been swept and downside momentum is clearly slowing. The current consolidation suggests accumulation rather than continuation lower.
A strong hold above the demand zone favors a bullish recovery toward the 3,150–3,180 liquidity range, which acts as the first upside checkpoint.
If price reclaims and holds above 3,200, bullish momentum could accelerate toward the supply zone at 3,280–3,320, with a potential extension toward 3,350+. As long as price remains above 3,050, the upside scenario remains the primary focus.

Bitcoin Is Holding Demand — Bulls May Be Setting Up the Next Price is reacting positively from a well-defined demand zone around 89,700–90,000, where selling pressure has been absorbed after the recent pullback. Despite the prior correction, the broader structure remains constructive as buyers defend this key area.
A sustained hold above the demand zone opens the door for a bullish recovery toward 91,400–92,300, where price may pause near the EMA and prior intraday resistance.
If bullish momentum strengthens and price breaks and closes above 92,300, the upside continuation scenario comes into play, targeting 93,200–93,700 as the next expansion zone. As long as price holds above 89,700, the upside scenario remains the primary focus.

BTCUSDT Long: Holding Above Demand, Eyes on 91,800 RetestHello traders! Here’s a clear technical breakdown of BTCUSDT (3H) based on the current chart structure. BTCUSDT initially traded within a well-defined descending channel, where price consistently respected the lower highs and lower lows, confirming strong bearish pressure. This bearish structure eventually reached a key pivot point, from which price reversed and broke out of the descending channel to the upside. This breakout marked a structural shift and initiated a new ascending channel, signaling a transition from bearish to bullish control. Following this rejection, BTCUSDT moved into a range, highlighting temporary equilibrium between buyers and sellers. From this range, price attempted another push higher, once again testing the supply zone. The most recent price action shows rejection from the same area, reinforcing the importance of this resistance.
Currently, BTCUSDT is consolidating between clearly defined Demand (~89,600) and Supply (~91,800) zones after transitioning from a descending channel into an ascending structure. Despite the recent rejection from the supply zone, the overall market structure remains bullish as long as price holds above the key demand area.
My primary scenario: long bias remains valid as long as BTCUSDT holds above the 89,600 Demand Zone and no strong bearish acceptance occurs below this level. I expect buyers to continue defending the demand area, forming a higher low or showing a clear bullish reaction (long lower wicks, impulsive bounce, or an internal break of structure). Once buyer strength is confirmed, a move toward: TP1: a retest of the 91,800 Supply Zone. TP2: in case of a clean breakout and acceptance above 91,800, continuation toward new local highs. Manage your risk!

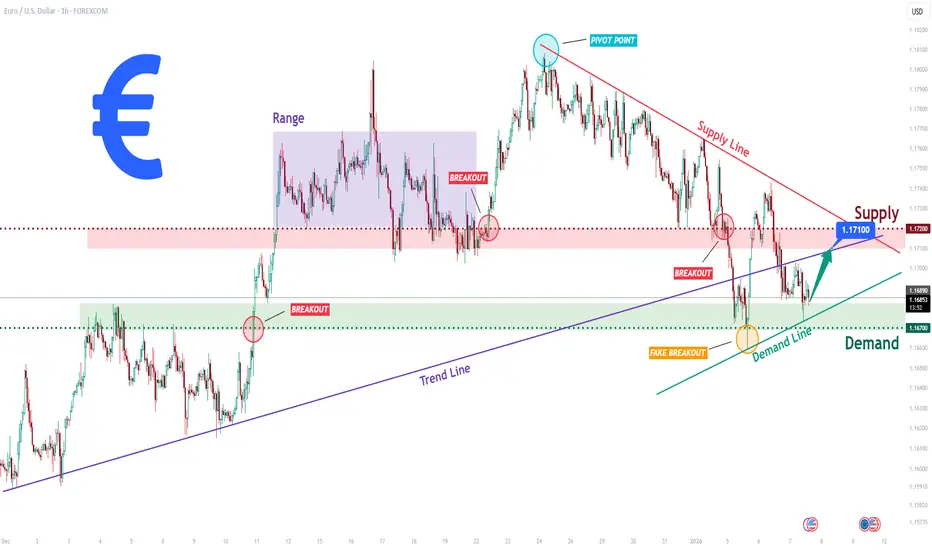
EURUSD Long: Compression Near Key Zones Signals Upcoming MoveHello traders! Here’s a clear technical breakdown of EURUSD (1H) based on the current chart structure. EURUSD previously traded within a well-defined ascending structure, respecting a rising trend line that acted as dynamic support during multiple pullbacks. This bullish phase showed consistent higher lows, confirming buyer control. After the impulsive upside move, price entered a consolidation range, highlighted on the chart, where buyers and sellers temporarily reached equilibrium. From this range, EURUSD executed a bullish breakout, confirming continuation and pushing price toward the upper structure. However, as price approached the Supply Zone around 1.1720–1.1750, bullish momentum started to fade. Multiple reactions, including fake breakouts and rejections near the pivot point, clearly signal strong selling pressure in this area. A descending Supply Line now caps price, reinforcing bearish pressure from above.
Currently, on the downside, price recently swept below short-term support, forming a fake breakout into the Demand Zone around 1.1670, which aligns with an ascending Demand Line. The quick recovery from this area suggests active buyers defending demand and preventing deeper downside for now. Currently, EURUSD is compressing between demand support and descending supply resistance, indicating a tightening structure and an upcoming directional move.
My scenario: as long as EURUSD holds above the 1.1670 Demand Zone and respects the rising demand line, a corrective bounce toward the 1.1710–1.1720 Supply Zone is possible. This area remains a key decision point. A strong rejection there would favor renewed bearish continuation, while a clean breakout and acceptance above supply would invalidate the bearish pressure and open the door for bullish continuation. Manage your risk!
BTCUSDT: Bullish Structure Intact - Targeting 93K ResistanceHello everyone, here is my breakdown of the current BTCUSDT setup.
Market Analysis
BTCUSDT previously traded inside a well-defined consolidation range, where price moved sideways and volatility was compressed, showing balance between buyers and sellers. During this phase, multiple internal swings failed to establish a clear trend direction. Before the range, price experienced several fake breakouts near the upper highs, highlighting strong selling pressure inside the 93,000 Resistance Zone, where buyers repeatedly failed to gain acceptance.
Currently, price is trading above the support zone and consolidating below the key 93,000 Resistance, where selling pressure previously emerged. The structure remains constructive, with higher highs and higher lows still intact, suggesting the move is corrective rather than a full reversal.
My Scenario & Strategy
My primary scenario: as long as BTCUSDT holds above the 90,800 Support Zone and respects the rising trend line, the bullish bias remains valid. I expect price to consolidate and potentially push higher toward the 93,000 Resistance, which acts as the next major upside objective (TP1). A clean breakout and acceptance above the resistance zone would confirm bullish continuation and open the door for further upside expansion.
However, a decisive breakdown below support and the trend line would invalidate the long setup and signal a return to range behavior or deeper correction. For now, buyers remain in control while support holds.
That's the setup I'm tracking. Thank you for your attention, and always manage your risk.

Gap Filled, Momentum Flips — Buyers Take ControlOANDA:XAUUSD has rebounded strongly from the gap support zone, reclaiming the short-term EMA cluster and shifting momentum back to the upside. The impulsive recovery suggests buyers are stepping in decisively after the corrective sell-off, turning the recent drop into a higher-low formation rather than trend failure.
As long as price holds above the 4,400 support zone, the structure favors continuation toward higher resistance levels.
Resistance: 4,495 → 4,525 → 4,550
Support: 4,400 – 4,410
Key demand (gap): 4,330 – 4,350
➡️ Primary: hold above 4,400 → pullback buys → continuation toward 4,495, then 4,525–4,550.
⚠️ Risk: loss of 4,400 → revisit the gap support at 4,330–4,350 before reassessment.

EURUSD Defends Demand — Is a Bullish Reversal Setting Up?EURUSD on H1 has been trading under sustained bearish pressure, forming a clear descending trendline that has capped price action over the past sessions. Lower highs remain intact, confirming that sellers are still in control of the broader short-term structure.
However, the recent sell-off has now pushed price into a well-defined support zone around 1.1665–1.1680, where downside momentum has started to slow. The sharp reaction from this area suggests active buyer participation and hints at a potential short-term corrective rebound rather than immediate continuation lower.
At the moment, price is consolidating just above this support zone, while still trading below the descending trendline. This creates a compression scenario: buyers are defending demand from below, while sellers remain positioned at trendline resistance.
This is a key decision area. As long as the support zone holds, the market has room to attempt a recovery toward the upper structure. A failure here, however, would reopen downside risk.
Bullish scenario: If price holds above the 1.1665–1.1680 support zone and breaks above the descending trendline with acceptance, a corrective move toward 1.1720, followed by 1.1760–1.1770, becomes likely.
Bearish scenario: A confirmed breakdown and close below the support zone would invalidate the bullish recovery idea and expose further downside toward 1.1630 and potentially 1.1600.
For now, patience is essential. The market is sitting at a high-impact support level, and the next high-probability trade will come from confirmation, not anticipation.
