Gold is still showing us it's bearish intent on the macroEasy peasy reading on the week so far. Let me know if I missed anything. I'm here for the sharing of info 💎
Analysis

USDT dominance is back at a strong rejection zone!USDT dominance is back at a strong rejection zone.
If it drops from here, altcoins can start moving up again.
Watching for a fall toward 5.5% → 5.0%. 👀

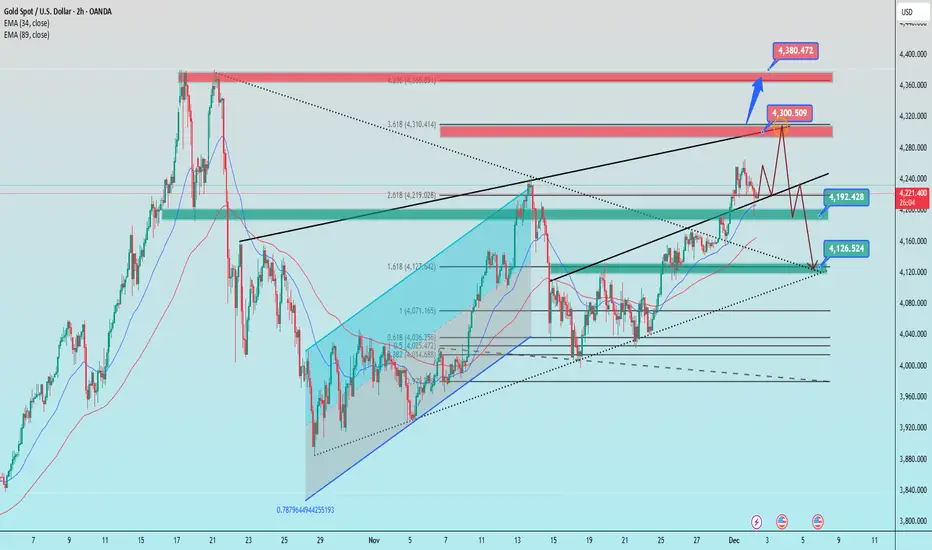
Scenario after the speech of the FED chairman on December 21️⃣ Trendline
Ascending trendline (lower black line)
This is the main dynamic support of the current trend.
Price is retesting the trendline after a strong bounce → holding above it keeps the bullish structure intact.
Descending trendline (upper black line)
A strong dynamic resistance from the higher timeframe, aligning with the 2.618 Fibonacci extension.
Price reacted and weakened when touching it → indicating selling pressure emerging.
2️⃣ Key Support & Resistance Zones
Resistance
4,300 – 4,315: Confluence of
✔ 3.618 Fibonacci extension
✔ Descending trendline
✔ Previous supply zone
→ This is the strongest reversal area.
Upside target if broken:
→ 4,375 – 4,380 (Fibo 4.236 + higher-timeframe supply zone).
Support
4,192 – 4,200:
✔ Demand zone
✔ Confluence with EMA + retest of ascending trendline
→ This is the short-term support.
4,125 – 4,130:
✔ Confluence with major ascending trendline
✔ 1.618 Fibonacci extension
→ This is the strong support – target if breakdown occurs.
3️⃣ Fibonacci Structure
The previous bullish wave completed a classic Fib extension pattern:
✔ 1.618 → 4,127
✔ 2.618 → 4,219
✔ 3.618 → 4,310
→ This reflects a fully extended wave, increasing the probability of a correction.
4️⃣ Price Scenarios
Scenario 1 (primary – correction expected)
Price rejects strongly at 4,300 →
🔻 Drops to 4,192 → if broken → moves toward 4,125 (major bounce zone).
Scenario 2 (bullish breakout)
If an H4 candle closes above 4,310, the move may extend toward 4,375 – 4,380.
Trade Ideas
BUY GOLD : 4193 – 4191
Stoploss: 4183
Take Profit: 100 – 300 – 500 pips
SELL GOLD : 4300 – 4303
Stoploss: 4313
Take Profit: 100 – 300 – 500 pips
Fundamental Market Analysis for December 2, 2025 USDJPYThe yen receives targeted support on expectations that the Bank of Japan may discuss the possibility of a rate increase at an upcoming meeting, while in the U.S. the case for a December Fed rate cut strengthens due to weak manufacturing dynamics. This shift in monetary-policy balances narrows the yield differential in favor of the yen and limits USDJPY’s upside potential despite ongoing volatility in global bonds.
An additional factor comes from Japan’s government-bond market: rising JGB yields to multi-year highs point to normalization in the price backdrop and the regulator’s readiness for a more flexible approach. On the U.S. side, weak survey data for manufacturing and a higher probability of a rate cut weigh on the dollar, while lower real yields diminish interest in dollar safe-haven assets.
Risk factors for the short include verbal interventions that may temporarily influence the exchange rate and a sudden shift in Fed rhetoric toward holding rates without clear forward guidance. Nevertheless, given current expectations for the Fed and cautious “Japanese normalization,” the probability of moderate yen strengthening in the near term is seen as higher than the risk of a strong dollar-positive impulse.
Trade recommendation: SELL 155.650, SL 155.800, TP 154.900

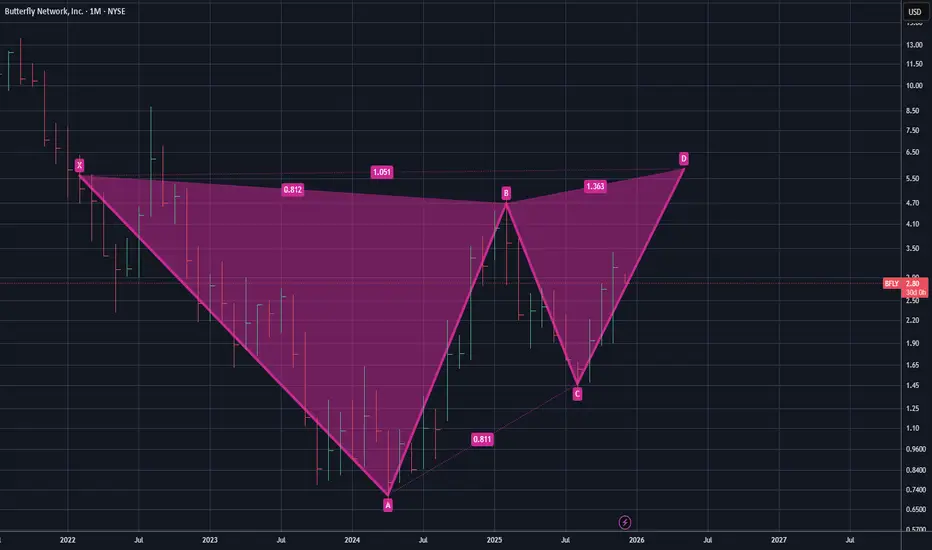
$5+ Target for Butterfly NetworksButterfly Networks is one of those stocks that short sellers like to get their hands on, as with many microcap stocks as well. That said, the product seems well developed, they have a large IP portfolio and could potentially be due for a new support line soon. I think $5 before Q2 2026 could be feasible. As always, none of this is investment or financial advice. Please do your own due diligence and research.
Gold Continued Support Feasible - Next Target for $4500? I believe if the oscillators play out, we can have another trendline support, even with aroon down, it could be quite minimal and a retracement for $4500 support per oz is possible. Gold as an asset and commodity seems to be getting scarcer and the demand for Gold including even in electronics is something I expect will increase. As always, none of this is investment or financial advice. Please do your own due diligence and research.

How to Build a Consistent Execution Checklist on TradingViewMost trading mistakes don’t come from bad strategy, they come from inconsistent execution.
An execution checklist removes guesswork and replaces it with structure.
When your actions follow a routine, your results stabilize.
TradingView gives you everything you need to build a checklist that stays visible, actionable, and tied directly to your chart.
1. Define Your Core Conditions
Before any trade, the bigger picture must be clear.
Start your checklist by answering three questions:
What is the higher-timeframe direction
Where is price relative to key levels
Is price approaching with strength or weakness
Use TradingView’s drawing tools to mark support, resistance, value zones, and session highs and lows.
Add a simple text note on the chart listing your core conditions so they are always visible.
If the market context fails this first screen, the trade is already invalid.
2. Build Confirmation Criteria
Once structure is confirmed, you move to evidence.
Mark confirmation areas directly on your chart:
Liquidity pools
Fair value zones or imbalances
Previous session highs and lows
Asian range or New York open
If your strategy uses indicators, document exact conditions:
Moving average position and slope
Volume behavior
VWAP location
Volatility expansion or contraction
Define rules that don’t change based on emotion.
Confirmation should prove your bias, not justify your urge to trade.
3. Validate Risk Before Execution
Every setup must survive a risk checkpoint before it’s allowed to go live.
Your checklist must answer:
Where is my invalidation level
How much capital am I risking
Does this violate any daily limits
Is the reward worth the risk
Use TradingView’s long or short position tool to visualize risk directly on the chart.
Save it as a template so your risk process stays uniform across all trades.
No trade is valid if risk isn’t clean.
4. Create a Pre-Execution Routine
A checklist only works if you actually follow it.
Add a short pre-trade process directly to your chart notes using checkboxes or bullet points:
Example execution checklist:
Market phase confirmed
Level identified
Confirmation present
Risk valid
Entry condition active
Walk through this list before clicking buy or sell.
If one item fails, the trade fails.
Over time, this routine removes emotional impulse completely.
5. Review and Refine Weekly
Your checklist isn’t static, it evolves.
Every week ask:
Where did I break my rules
What conditions led to losses
Which confirmations work best
What rules saved me from bad trades
Use TradingView’s trade replay and journaling features to review execution quality, not just profit.
Consistency improves when your system evolves with you.
Final Thought
A checklist doesn’t restrict your trading, it frees you from emotion.
When your process is clear, your confidence increases.
When your confidence increases, discipline follows.
Good traders make decisions.
Great traders execute procedures.
Stay Green!
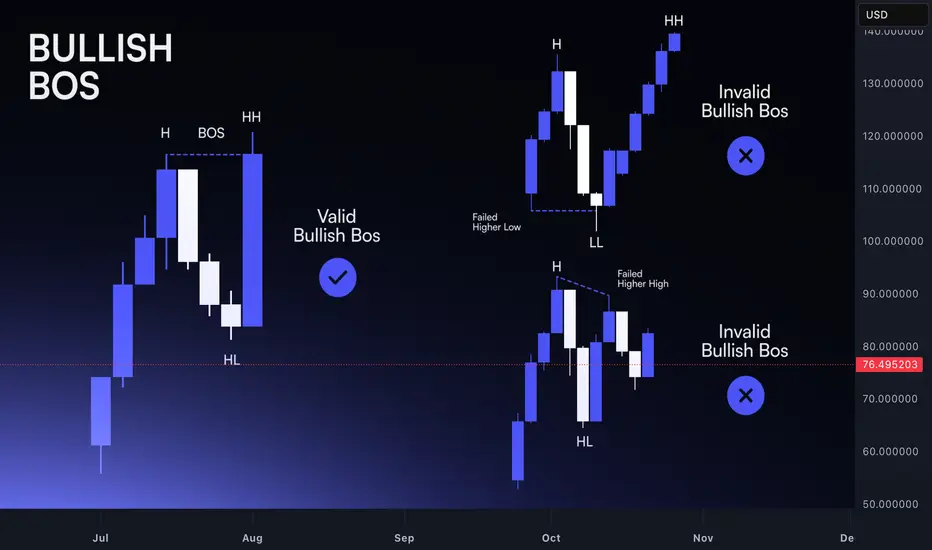
Break of Structure: Identifying Real Trend Shifts Markets move in phases, and structure is the clearest way to read those transitions. A trend doesn’t reverse because price slows down or because a candle looks different. It reverses when the underlying pattern of highs and lows breaks.
Understanding this sequence is what separates disciplined analysis from reactive guessing.
In an uptrend, buyers defend higher lows and push price into higher highs. As long as this structure holds, the trend is intact. Noise may create deep pullbacks or temporary hesitation, but the narrative remains unchanged.
The first sign of vulnerability appears when price fails to create a meaningful higher high. Momentum stalls, and the next push upward shows less conviction.
The real shift comes when a higher low is taken out. This is the break of structure. It shows that buyers no longer control the market, and sellers have absorbed enough liquidity to push through a prior defensive point.
This is not a prediction; it’s an objective change in the market’s behaviour. A single candle doesn’t define it. The sequence does.
For downtrends, the logic is the same in reverse. Lower highs and lower lows define control. When price fails to print a clean lower low and then breaks a prior lower high, the trend loses integrity. Structure reveals the turning point before sentiment catches up.
However, not every break is a real shift. Crypto produces countless intraday spikes that violate levels without altering the broader narrative.
The difference lies in context. A valid break is supported by:
– Clear momentum into the break
– Liquidity taken before the shift
– Follow-through after the level is broken
– A retest that confirms the new direction
These factors filter out noise and highlight genuine transitions. Watching price break structure is not enough; you must also assess whether the move fits within the larger story of the trend.
A break of structure doesn’t mean instant reversal. It means the previous trend has ended. The next phase might be consolidation, re-accumulation, or immediate reversal, but the bias shifts the moment structure changes.
Traders who read structure objectively adjust earlier and avoid fighting a direction that no longer has control.
Once you internalize how highs and lows interact, spotting real shifts becomes a structured process instead of an emotional reaction. Structure turns confusion into clarity and gives you a reliable framework for navigating both trends and transitions.
EURUSD Long: Channel Support Intact, Path Open Toward 1.1625Hello, traders! EURUSD is trading within a developing ascending channel, where price action continues to respect both the higher lows and the upper boundary of the structure. This upward movement formed after buyers defended the Demand Zone around 1.1550, which acted as a strong pivot area and triggered a bullish reversal via a clear inverse Head and Shoulders pattern. This pattern gave buyers the momentum needed to break back above the mid-range structure.
Currently, after reclaiming this level, EURUSD made a steady climb inside the ascending channel. However, price is now approaching the 1.16250 Supply Zone, which has previously acted as a strong reaction area where multiple breakouts and fake breakouts occurred. This remains the key short-term barrier that buyers need to overcome for further upward continuation.
My scenario: if buyers maintain structure above the Demand Zone at 1.15900 and hold the ascending channel’s support, EURUSD may continue pushing toward the 1.16250 level. This zone, aligned with the channel’s upper boundary, is the main target for the current bullish leg. A clean breakout above this resistance could open the door for a stronger bullish extension. However, if price reaches the Supply Zone and shows weakness or rejection, a corrective pullback toward the channel’s lower boundary is possible while still preserving the bullish structure. As long as EURUSD holds above the Demand Zone and respects the channel, the bullish scenario remains valid. Manage your risk!

Journaling For Traders: Turning Random Results Into A Feedback Most traders spend years tweaking indicators and strategies while leaving their process undocumented. Without a journal, every trade feels new, every mistake repeats, and progress stays vague. A structured journal turns experience into data. It shows what you do well, what keeps failing, and which behaviours appear before your best and worst decisions.
The first step is simple: record every trade. Log the setup, market structure, entry reason, risk, and emotional state. Write whether you felt rushed, confident, bored, or frustrated. Do not only record wins or big losses. Incomplete data keeps blind spots alive.
The real value appears during weekly review. Set time aside after markets slow down and go through the trades as a batch. Look for recurring situations. You may notice that late-session entries perform poorly, that you increase size after wins, or that you cut trades early when size feels uncomfortable. These patterns are not visible inside a single session. They emerge only over a cluster of trades.
Next, extract insights. Group trades by setup, session, and emotional state. Identify your highest quality combinations. For example, trend continuation trades in London with fixed risk might show a strong performance profile while countertrend entries in low volume hours consistently underperform. This step separates what you think works from what actually delivers.
Finally, adjust strategy. Turn observations into rules. Reduce or remove the behaviours that repeatedly drain capital. Formalise the conditions that define your best trades. Add small process rules rather than full rewrites, then track the impact in the next review cycle. Over time, your playbook becomes evidence based rather than theoretical.
Journaling is not an extra task for perfectionists. It is the operating system behind professional execution. When you continuously record, review, extract, and adjust, your trading process compounds in quality even when individual weeks are difficult.
XAUUSD Short: Rejection Pattern Points Toward 4,110 SupportHello, traders! XAUUSD continues to move within a broader ascending channel, where the price is forming higher pivot points along the Demand Line while consistently reacting to the descending Supply Line above. This structure indicates ongoing compression between buyers and sellers. Recently, Gold approached the upper Supply Line, where the price once again failed to break through, forming another lower high. This confirms that sellers are still defending the supply zone around $4,190–$4,200, keeping upward momentum limited. Before that, the price made several breakout attempts above the mid-range resistance, but many of them turned into fake breakouts, indicating liquidity grabs. Each rejection pushed Gold back toward the Demand Line, where buyers repeatedly created strong pivot points and revived the bullish momentum.
Currently, XAUUSD is trading close to the resistance area, and the chart suggests a potential pullback. If sellers maintain their pressure, the price may decline toward the $4,110 demand level, which aligns with both historical support and the upward Demand Line.
My scenario, if the price respects the Supply Line and fails to break higher, a bearish correction toward the $4,110 support zone becomes likely. However, if buyers manage to break above the descending Supply Line with strong momentum, the bearish idea becomes invalid, and Gold may continue its bullish expansion. Manage your risk!

BTCUSD: Channel Momentum Points Toward $93,700 TargetHello everyone, here is my breakdown of the current Bitcoin setup.
Market Analysis
BTCUSD has shifted from a prolonged bearish phase into a clear bullish recovery after breaking out of the major downward channel. The price confirmed the end of the bearish structure once it broke above the descending trendline and reclaimed the Support Zone around $89,800–$90,200, which previously acted as a strong demand area during the selloff. After the breakout, Bitcoin established a new upward channel, forming higher highs and higher lows, indicating that buyers are currently in control. The price is now moving steadily along the channel's Support Line, respecting its structure and maintaining bullish momentum. Recent price action also includes several breakout confirmations, showing that buyers successfully defended the Support Zone and turned it into a base for further growth.
Currently, BTCUSD is approaching the $93,000–$93,700 Resistance Zone, which remains the main obstacle for buyers. This level acted as strong resistance earlier and aligns with the mid-upper region of the ascending channel, making it a key reaction area where sellers may attempt to slow down the bullish trend.
My Scenario & Strategy
My scenario remains bullish as long as Bitcoin stays above the $90,200 support zone and continues to trade within the upward channel. The structure suggests that buyers may attempt another push toward the $93,700 resistance, where the next major reaction is expected.
Therefore, a clean breakout above $93,700 would confirm further bullish continuation and open the path toward higher targets, potentially extending the uptrend to the upper channel boundary. However, if BTC reaches the resistance and shows signs of rejection or weakening momentum, we may see a pullback toward the channel’s Support Line — yet the broader bullish structure will remain valid as long as the zone around $90,200 holds. For now, the market supports a long bias, with the primary objective being a retest of the $93,700 resistance zone, which stands as the key level buyers are aiming for.
That’s the setup I’m tracking. Thank you for your attention, and always manage your risk.

EURUSD: Sellers Target Move Toward 1.15200 SupportHello everyone, here is my breakdown of the current EURUSD setup.
Market Analysis
EURUSD continues to trade within a corrective market structure after a strong bullish impulse that formed an Upward Channel earlier in the month. Once price broke below that channel, the pair shifted into a broader consolidation, forming a descending Triangle pattern defined by a Triangle Resistance Line above and a Triangle Support Line below. After dropping from the 1.16000 Resistance Zone, the market produced a clear fake breakout above this level, signaling strong seller presence. This rejection aligned with the Triangle Resistance Line, confirming it as a firm boundary preventing further upside. On the downside, EURUSD also created a fake breakout at the Triangle Support Line, showing that buyers remain active around the 1.15200 Support Zone.
Currently, price is trading in the middle of this triangle structure, moving away from resistance and showing early signs of bearish momentum building toward the lower boundary. The broader picture reflects a balanced but weakening market, where sellers still hold the advantage as long as price remains under the 1.16000 Resistance.
My Scenario & Strategy
My scenario is bearish, based on the repeated rejections from the 1.16000 Resistance and the overall pressure along the Triangle Resistance Line. As long as EURUSD stays below this key zone, the probability favors further downside movement inside the triangle. My expectation is for price to make another minor pullback toward the 1.15850–1.15900 area, where short-term liquidity may form, before resuming the decline toward the 1.15200 Support Zone. This level aligns with the Triangle Support Line and represents the main downside target for the current move.
Therefore, a clean breakout below 1.15200 would signal stronger bearish continuation and open the path for deeper declines. However, if price rejects the support again and forms higher lows, we may see another corrective bounce back into the triangle — but the bearish bias holds as long as the 1.16000 Resistance remains intact. For now, the market supports a short scenario with a focus on a move toward the 1.15200 support area.
That's the setup I'm tracking. Thank you for your attention, and always manage your risk.

BTC Buyers Hold Control — Targeting $95,700 Resistance RetestHello traders! Here’s my technical outlook on BTC/USD based on the current market structure. After breaking out of the Buyer Zone near $86,400–$88,000, the price entered a sustained upward channel, forming higher highs and higher lows along the Support Line. However, BTC recently approached the Resistance Line inside the channel and showed signs of exhaustion, indicating that buyers are losing momentum as the price nears the local Seller Zone around $94,000–$95,700. The chart currently shows the market trading within a rising corrective structure, with bulls trying to hold the Support Line to maintain the short-term uptrend. As long as the price stays above the Buyer Zone and respects the channel’s Support Line, the bullish scenario remains valid. The structure suggests a potential pullback from Resistance toward the mid-channel area before buyers attempt another move upward. A continuation of this trend may push BTC/USD toward the TP1 target at $95,700, where the previous rejection occurred. A clean breakout above this level would open the door for stronger bullish expansion. However, a breakdown below the Support Line or a drop back into the Buyer Zone could weaken the trend and expose the price to deeper declines. Please share this idea with your friends and click Boost 🚀

CAD/JPY: Bullish Continuation Setup - Buy Above 111.33The CAD/JPY pair has completed a bullish wave structure and is now showing a healthy pullback, creating a high-probability continuation setup.
WAVE STRUCTURE ANALYSIS:
✅ Completed bullish wave formation
✅ Pullback has traded below Structure 4
✅ Continuation remains valid above Structure 2 (110.96)
TRADE SETUP:
📍 Entry: Buy above 111.33 (signals uptrend resumption)
🛑 Stop Loss: 110.96 (Structure 2 invalidation point)
🎯 Target 1: 112.46 (Fibonacci key ratio projection)
🎯 Target 2: 112.97 (Extended Fibonacci target)
FIBONACCI ANALYSIS:
Using key ratio Fibonacci measurement from the complete wave structure low to high, we've identified clear target zones for profit-taking.
RISK MANAGEMENT:
Price must hold above 110.96 for bullish bias to remain valid
Entry above 111.33 confirms momentum resumption
KEY LEVELS TO WATCH:
📌 Critical Support: 110.96
📌 Entry Trigger: 111.33
📌 Resistance 1: 112.46
📌 Resistance 2: 112.97
METHODOLOGY: WavesOfSuccess Price Behaviour Analysis

Fundamental Market Analysis for December 1, 2025 GBPUSDEvent to watch today:
01.12 17:00 EET. USD - ISM Manufacturing PMI
GBPUSD:
Sterling holds above 1.32 amid a softer dollar and a neutral-to-supportive UK backdrop: the impact of the Autumn budget and the OBR’s assessments is largely priced, while the Bank of England appears less inclined to ease early than the Fed. That divergence in policy expectations works against the dollar and underpins demand for GBP.
Additional support comes from moderately positive signals in UK labor and consumer activity, alongside steady gilt yields. A measured risk appetite and the dollar’s softness after benign U.S. data strengthen the short-term momentum in favor of the pound.
Risks relate to potential surprises in U.S. and UK statistics and any shifts in central-bank messaging. Nevertheless, the present configuration of fundamental factors is favorable for further GBP gains if the external backdrop remains neutral.
Trade recommendation: BUY 1.32300, SL 1.32000, TP 1.33200

EURUSD Retracement Before Bullish ContinuationQuick Summary
Although the overall outlook remains bullish, the EURUSD may go down first to collect liquidity below the Tokyo Low. This zone aligns with equal lows and a clean order block after, making 1.15855 a strong area for a continuation buy if a clear rejection or choch forms.
Full Analysis
The bullish structure on the EURUSD is still intact, but before continuing upward, the pair may need to sweep the liquidity sitting beneath the Tokyo Low, The area below the Tokyo Low also aligns with equal lows, which naturally attract liquidity and making this zone even more likely to be tested
The level around 1.15855 stands out as a probable point for bullish continuation once liquidity has been taken. However, entering directly at the level is not ideal. It is safer and more effective to wait for a clear sign of reaction such as a strong rejection or a confirmed choch on a lower timeframe. These signals help validate that the market is ready to shift from sweep to expansion upward.

Gold market {Trend Analysis}Last week we saw gold buy up to 4200's after a delayed bullish momentum until the close of last week's candle. Gold extended its bullish strength up till the 4220's where we closed off for last week. This week we saw gold continue on its bullish sentiment up till the 4250's before the ongoing bearish retracement.
fOLLOWING THE ANALYSIS, we see that gold mitigated its 50% trend channel on the 4hour time-frame before the bearish turnaround back to the 4220's. A break below this zone insinuates more lower liquidity grab back to the 4100's.
Further updates would be given as the market gains momentum

How did gold move in the first week of December? CONCISE & COMPREHENSIVE TECHNICAL ANALYSIS
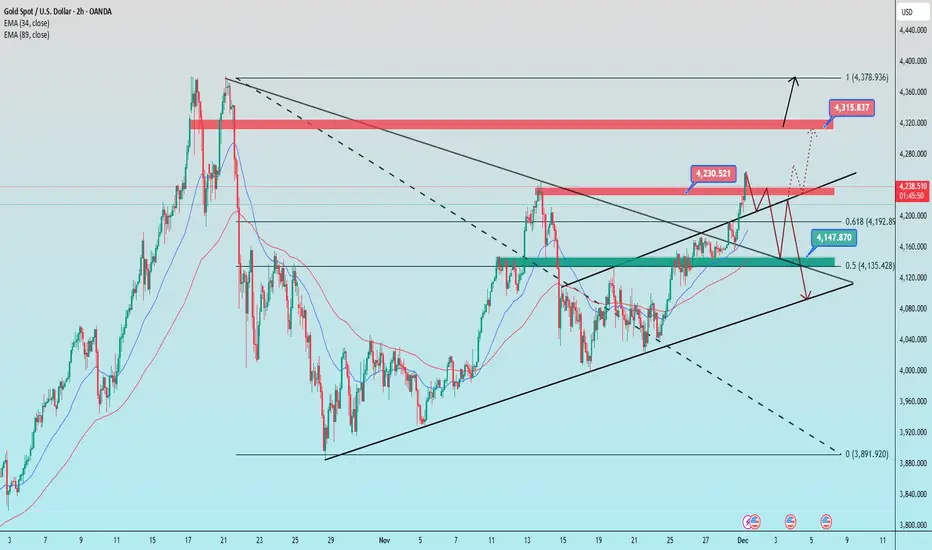
1. Trend Lines
Ascending trend line (lower black line)
This is the main dynamic support of the current uptrend structure.
The price has bounced off this trend line several times → the short-term trend remains bullish as long as this line is not broken.
Major descending trend line (upper black line)
This is strong dynamic resistance on larger time frames, and the price recently touched this area.
This is an area where selling pressure frequently arises.
2. Support – Resistance
Resistance
4,243–4,245 (red zone):
This is the confluence of the previous peak and the descending trend line → selling pressure appears right in this area.
4,315–4,320 (next major resistance):
If this area is broken, the price will likely head towards 4,375–4,380.
Support
4.147–4.150 (green zone confluence):
Confluence of moving averages, the nearest swing low, and Fibonacci levels → important support that maintains the bullish structure.
4.105–4.120 (lower trendline):
If the price breaks through this area → the short-term trend has the potential to turn bearish.
3. Fibonacci
Fibonacci 0.618 = 4.194
→ Area with a high probability of a rebound if the price corrects.
Fibonacci 0.5 = 4.135
→ Confluence with strong support + trendline → potential buy zone if a deeper pullback occurs.
4. Price Scenarios
Scenario 1 – Continue Upward (Priority)
If the price remains above 4,200–4,215, there is potential for a retest:
➡️ 4,230 → 4,315 → 4,375
Scenario 2 – Downward Correction
If the price breaks through 4,190 and breaks through the green zone of 4,144–4,150, then:
➡️ Risk of a downward movement towards the 4,105–4,120 trend line
📌 Trading Plan
BUY GOLD: 4,148 – 4,250
Stop Loss: 4,138
Take Profit: 100–300–500 pips
SELL GOLD: 4,313 – 4,315
Stop Loss: 4,325
Take Profit: 100–300–500 pip
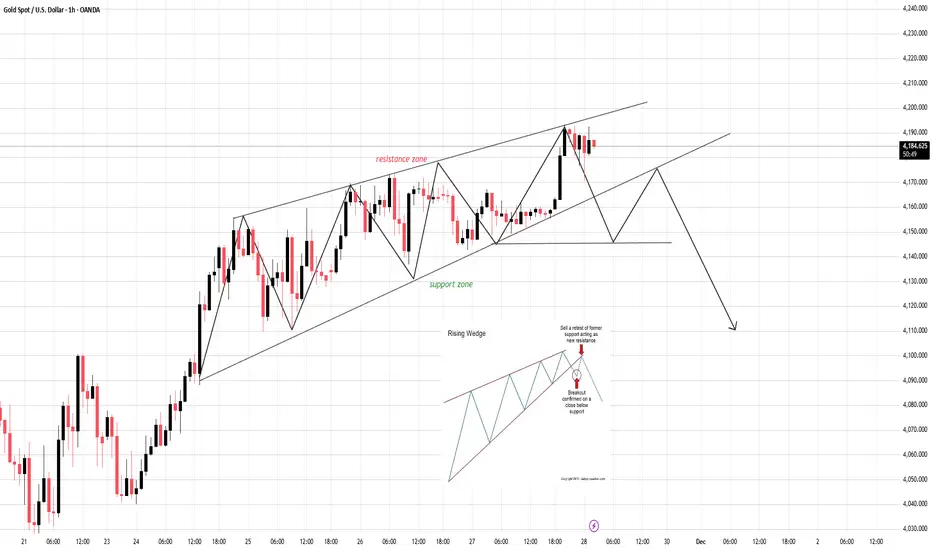
Rising Wedge on the Edge — The Breakdown Is Only One Candle AwayCURRENT MARKET ANALYSIS & TODAY’S EXPECTED MOVE
1. Current Market Structure
The market is currently respecting the structure of a Rising Wedge — a pattern where price continues rising but momentum weakens, volatility compresses, and the probability of a bearish breakdown increases.
Key observations:
- Price is moving near the upper boundary of the wedge.
- Newly formed highs lack strength → buying pressure is fading.
- Recent candles show long upper wicks, indicating strong sell pressure at resistance.
- The lower support line has been tested multiple times, increasing the likelihood of a breakdown.
- Buyers are losing control while sellers are beginning to step in.
2. Primary Scenarios for Today
✓ Scenario 1 – Breakdown of the Rising Wedge (High-probability scenario)
If a candle closes decisively below the lower support, the market is likely to:
- Drop quickly toward the next support levels.
- Trigger strong seller participation on the retest of the broken trendline (support → resistance).
- Confirm a high-quality SELL entry.
Downside Targets:
- Target 1: Nearest support zone
- Target 2: Previous low of the wedge
- Target 3: Major support below (depending on your timeframe)
✓ Scenario 2 – Price holds but remains weak
If price bounces from the lower edge but fails to break the upper boundary:
- The structure remains weakly bullish but vulnerable.
- Any upward move is fragile and easy to reverse.
- Not suitable for chasing BUY positions.
- Bulls need a strong breakout above the upper trendline to reverse the bias — which currently has a lower probability.
3. Intraday Trend Bias
Today’s intraday bias remains: DOWN (or at least corrective to the downside).
Confirmation signs:
- Support becomes easier to break the more it is tested.
- Volume is weak on bullish moves.
- Price action is tightening → preparing for a breakout.
- Sellers will wait for a clean retest, as shown in your reference chart.
4. Conclusion
The market is approaching the end-phase of a Rising Wedge, a classic bearish reversal pattern.
Priority today: Wait for breakdown → retest → SELL.
Avoid chasing BUY setups due to high reversal risk.
Expected development:
Break support → Retest → Continue dropping
“Your edge is built from discipline — not every setup must be traded, but every trade must follow your plan.”
Drop your market bias in the comments — do you expect the breakdown or a surprise breakout?
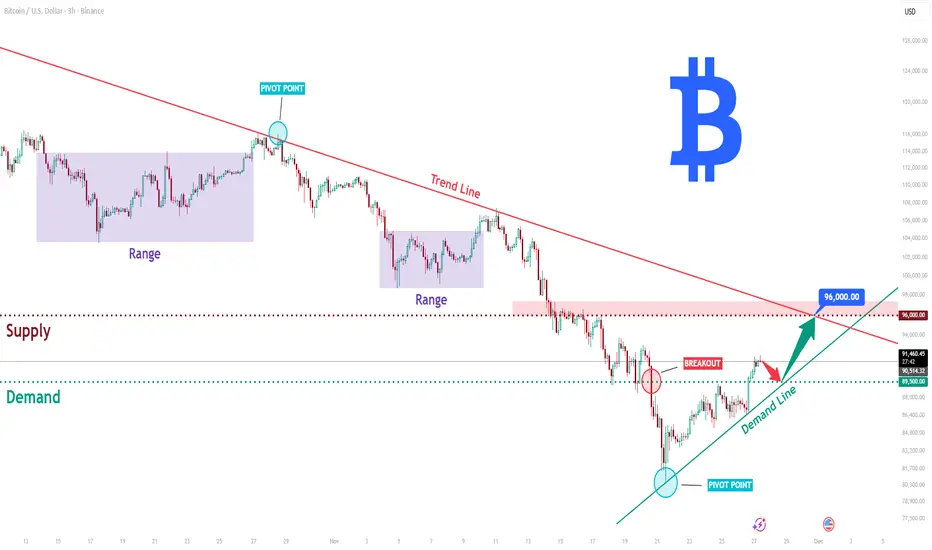
BTCUSD Long: Compression Near Trend Line, Possible Move to $96KHello, traders! BTCUSD continues to move within a broader descending structure, where the price has consistently respected the major downward trend line. Each approach to this trend line has resulted in a new lower high, confirming seller control in the medium-term outlook.
Currently, after the decline, Bitcoin tested the Demand Zone around $89,500, where buyers formed an important pivot point, triggering a noticeable upward impulse. This reaction confirmed strong demand and pushed the price toward the key compression area between the Demand Line and the main descending Trend Line.
My scenario, if buyers maintain pressure and break above the descending trend line, BTCUSD may extend its bullish correction toward the $96,000 supply zone. However, if the demand level fails to hold, this scenario becomes invalid, opening the path toward deeper support levels. Manage your risk!
XAUUSD: Channel Push Points to $4,220 as Next TargetHello everyone, here is my breakdown of the current Gold setup.
Market Analysis
Gold remains in a broader bullish structure, but the recent price action is developing inside a well-defined ascending channel, where price is currently moving from the lower boundary toward the upper one. After a sharp correction, XAUUSD found strong support at the $4,040 level, which aligns with the bottom of the channel and produced a fake breakout, signaling lack of bearish continuation.
Currently, price has started a new upward swing, respecting both the channel structure and the mid-line trend dynamics. However, despite the recovery, XAUUSD is still trading below the major $4,220 resistance, which previously acted as a strong reaction zone and remains the key obstacle for buyers.
My Scenario & Strategy
My scenario is bullish, as long as price stays above the support zone around $4,040 and maintains structure inside the ascending channel. I expect Gold to continue climbing toward the $4,220 resistance, where the upper channel boundary also converges, forming a strong confluence area.
Therefore, a clean breakout above $4,220 would open the way for higher targets and continuation of the broader trend. However, if price reaches this zone and shows strong rejection or weakness, we may see a pullback into the channel — but the bullish structure remains intact as long as the lower boundary holds. For now, the market supports a long bias, with the key objective being a retest of the $4,220 resistance zone, which is the next major level buyers are aiming for.
That's the setup I'm tracking. Thank you for your attention, and always manage your risk.

EURUSD Downside Outlook: Price Eyes Retest of 1.1540 Buyer ZoneHello traders! Here’s my technical outlook on EUR/USD based on the current market structure. After testing the Seller Zone near 1.16000–1.16200, the price once again faced rejection, forming a fake breakout around the descending Resistance Line. This confirms that sellers are still defending this area and keeping the pair inside a broader bearish structure. From there, EUR/USD pulled back toward the Buyer Zone, located between 1.15400–1.15000, which has acted as a reliable support area multiple times. The market is now moving inside a corrective pattern, showing weakening bullish momentum as it approaches support. As long as the pair trades below the Seller Zone and the descending trendline, bearish pressure remains dominant. The chart suggests a likely continuation toward the TP1 target at 1.15400, where buyers previously stepped in and produced notable recoveries. A clean bounce from this zone may trigger another short-term bullish correction — but without a breakout above 1.16000, any upside is likely to remain limited. A breakdown below 1.15400 could open the way for deeper declines toward lower support levels, while a confirmed breakout above the Seller Zone would shift short-term sentiment. Please share this idea with your friends and click Boost 🚀
