USD/JPY(20251105)Today's AnalysisMarket News:
The US government shutdown stalemate continues, and the 35-day record is about to be broken.
Technical Analysis:
Today's Buy/Sell Threshold:
153.81
Support and Resistance Levels:
154.97
154.54
154.26
153.37
153.09
152.66
Trading Strategy:
Consider buying if the price breaks above 153.81, with a first target price of 154.26.
Consider selling if the price breaks below 153.37, with a first target price of 153.09.
Analysis

BNB reacts to BTC declines🔍 General Technical Situation:
The BNB price has broken below a key uptrend line that has been in place since June.
It is currently below the support level of ~1010 USDT, signaling a shift from higher lows to a potential downtrend.
📉 Key Levels:
Resistance:
1086 USDT → last local resistance after the trend breakout (a retest from below is possible).
1205 USDT → strong resistance from August and September.
Support:
912 USDT → local support (currently being tested).
831 USDT → next support, significant from the August structure.
733 USDT → strong demand zone from June-July.
📊 Volume:
In recent days, it has increased noticeably during declines—confirming selling pressure and the presence of large players liquidating positions.
🔄 Stoch RSI Indicator:
The Stoch RSI is at the lower end of the chart, close to the oversold zone (around 20–0).
This could indicate a short-term rebound, but not necessarily the end of the decline—rather, a potential retest from below the broken trend line (~1050–1080 USDT).
⚠️ Scenarios:
🟥 Bearish (more likely):
Price remains below 1010 USDT and rejects the 1080–1100 level in the event of a rebound.
Next downside targets: 912 → 831 → 733 USDT.
High selling volume suggests a test of lower levels may occur before demand stabilizes.
🟩 Bullish (less likely, but possible):
Price bounces from the 900–910 zone and returns above 1010 USDT with confirmed volume.
Only a close of the daily candle above 1080 USDT would negate the current bearish signal and could open the way to 1200 USDT.
📈 Summary:
Medium-term trend: broken, signal of weakness.
Short-term: possible technical rebound from 900–910, but the overall bias remains bearish.
Key level to watch: 1010 USDT – a return above this level would be the first positive signal.

GBPUSD within Bearish StructureHi Traders!
With price failing to swing higher I'm still seeing it's within bearish structure. The 1.35000 area looks like a strong resistance/supply zone. If price fails to break and close above it, that reinforces my bearish bias.
As of now, the current bounce looks corrective- possibly a retracement toward the 1.3500 zone before sellers step in again.
If price rejects near 1.35000 and continues to break below, then the next level I'd be considering would be 1.30000.
In addition, DXY is sitting at a higher low zone on a higher TF. It hasn't broken its longer-term uptrend yet. The price action looks like it's attempting a base/reversal. If it holds within 98.000-98.500 and starts pushing up, that could align with GBPUSD weakness.
*DISCLAIMER: I am not a financial advisor. The ideas and trades I take on my page are for educational and entertainment purposes only. I'm just showing you guys how I trade. Remember, trading of any kind involves risk. Your investments are solely your responsibility and not mine.*

BTCUSD Long: Buyers Defend Demand Zone, Targeting $110,400 MoveHello traders! Bitcoin (BTCUSD) is currently trading within a key structural zone, showing signs of balance between demand and supply after a volatile move. Following the previous sell-off from the $116,000 Supply Area, the price found strong buying pressure near the $106,500 Demand Zone, which coincides with the ascending Demand Line that has been acting as dynamic support for several weeks.
After multiple rejections from the Supply Line, BTC has recently formed a fresh pivot low at the Demand Line — an area that has historically triggered bullish reactions. This reaction zone is particularly significant because it aligns with a confluence of horizontal and diagonal support, increasing the probability of a bounce scenario.
In the short term, I’m watching for a potential bullish rebound from the $106,500–$107,000 zone. A confirmed bounce with strong bullish candles could trigger a move toward the next pivot resistance around $110,400, which sits near the descending Supply Line. This would be the first major target for any short-term long positions.However, if buyers fail to sustain above the Demand Line, a breakdown below $106,000 would invalidate the bullish setup and potentially open the path for a deeper correction toward the next support levels. For now, the most probable scenario suggests a technical rebound toward $110,400, as long as the Demand Line continues to hold. I’ll be watching for confirmation signals such as higher lows or bullish breakouts to enter a long position. Manage your risk!

Fundamental Market Analysis for November 4, 2025 USDJPYThe pair is sliding below 154.000, and the market is shifting in favor of the yen amid stronger domestic drivers in Japan. Faster inflation in Tokyo has strengthened expectations of a gradual normalization of Bank of Japan policy in the coming months, while comments from the regulator’s leadership allow for the possibility of discussing tightening at one of the upcoming meetings. For the market, this implies a narrowing of the real yield differential going forward and reduced appeal of carry trades funded in yen, which supports a decline in USDJPY.
An additional constraint for the dollar against the yen comes from repeated warnings by Japan’s Ministry of Finance about excessive exchange-rate volatility. The risk of targeted actions by the authorities and tighter monitoring of the pair’s dynamics prompts market participants to close long USDJPY positions and trim risk whenever the dollar’s decline accelerates. Historically, such verbal signals increase investors’ propensity to take profits and reinforce corrective moves in favor of the yen.
On the U.S. side, short-term dynamics are shaped by uncertainty in the macro calendar and heightened sensitivity to any signs of a slowdown in the U.S. economy. Against this backdrop, local Japanese factors — inflation and official commentary — temporarily outweigh the overall dollar backdrop. All in all, this creates fundamental conditions for a near-term correction lower in USDJPY.
Trading recommendation: SELL154.000, SL 154.250, TP 153.150

AUD/JPY - Bullish Flag (03.11.2025)🧠 Setup Overview:
AUD/JPY is forming a Bullish Flag Pattern on the 30-minute chart — a continuation setup suggesting potential upside momentum after consolidation. The price has respected the flag support zone and is attempting a breakout above the descending channel, signaling renewed bullish pressure.
💡 Technical Plan: Pattern: Bullish Flag Pattern
Bias: Buy after confirmation breakout and retest
Support Zone: 100.650 – 100.700
Entry Zone: Near 100.850 – 100.900 (after breakout confirmation)
Targets:
🎯 1st Resistance: 101.460
🎯 2nd Resistance: 101.753
Invalidation: Close below 100.600 negates the bullish bias
🌏 Fundamental Insight (Today – 3 Nov 2025)
The AUD finds strength as China’s manufacturing PMI beats expectations, improving sentiment for commodity-linked currencies.
Meanwhile, the JPY remains under pressure due to continued Bank of Japan dovishness and yield differentials favoring risk assets.
Market tone is risk-on, further supporting bullish momentum in AUD/JPY.
⚠️ Disclaimer:
This setup is shared for educational purposes only. It is not financial advice. Always do your own analysis and apply proper risk management before trading any setup.
#AUDJPY #Forex #TechnicalAnalysis #PriceAction #BullishFlag #BreakoutTrading #Ichimoku #KABHI_TA_TRADING #ChartsDontLieTradersDontQuit #ForexSetup #MarketAnalysis #TradingView #FXMarket #BuySetup #ForexCommunity #AUD #JPY #ForexTrader
💬 Support My Work ❤️
If you find this analysis useful — LIKE 👍, COMMENT 💭, and FOLLOW 🔔 for more daily Forex chart updates and trade setups!

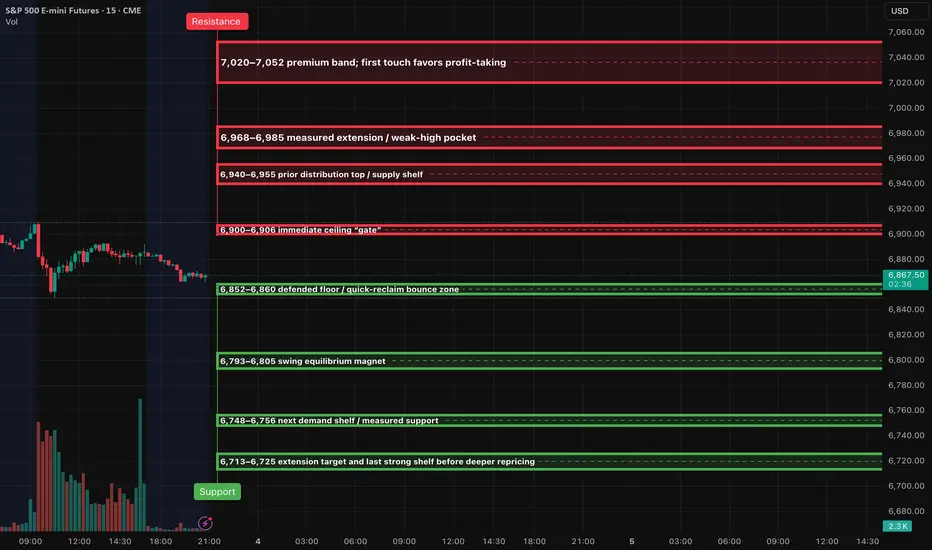
ES (SPX, SPY) Analysis, Key Zones, Setups for Tue (Nov 4th)Bias & context
Range-to-slightly-bearish intraday while price remains capped under 6,900–6,906. A clean 15m body close above that “gate” shifts bias to the upside toward 6,940→6,985. Lose 6,852–6,860 on a 15m body-through and the path opens to 6,805→6,756.
The key levels remain unchanged.
Setups (15m→5m→1m)
Rejection Fade at 6,900–6,906: tag and 15m close back below → use the first 5m re-close lower and enter short on the 1m pullback; TP1 = 6,860, TP2 = 6,805, TP3 = 6,756; hard SL = 15m wick high +0.50.
Acceptance Continuation through 6,906: 15m full-body close above → buy the 5m pullback that holds; TP1 = 6,940–6,955, TP2 = 6,968–6,985; invalidation = a 15m close back inside ≤6,900.
Quick-Reclaim Bounce at 6,852–6,860: sweep and instant reclaim → long back toward 6,900 “gate”; if the reclaim fails, stand aside and wait for the body-through short.
Exhaustion Flush Bounce at 6,748–6,756: only on a fast flush; first-touch responsive long back to 6,793–6,805; invalidate on a decisive 15m body-through below 6,748.
Kill-zones (ET)
NY AM 09:30–11:00 primary execution window; NY PM 13:30–16:00 continuation / reversal window.
Calendar & shutdown check
JOLTS (Sep) is scheduled for Tue, Nov 4 at 10:00 ET, but BLS warns releases may be delayed during the shutdown. Treat this as tentative.
ADP National Employment Report (Oct) is Wed, Nov 5 at 08:15 ET and is unaffected (private release).
ISM Services PMI (Oct) is Wed, Nov 5 at 10:00 ET and is unaffected (private release).
Census/Commerce releases on Tue (Trade Balance, Factory Orders) are on the calendar, but federal data dissemination is paused under the shutdown; expect postponements.
Major earnings Tue, Nov 4 (pre-market) include SHOP, UBER, PFE, SPOT, ETN, RACE, APO, MAR, TRI, ZTS, MPC, MPLX.
Management:
Instruction notes: only take plays where TP1 ≥ 2.0R using the 15m-wick stop. At TP1 close 70% and park 30% at BE; runner aims the next level. No trailing before TP2. Max 2 attempts per level per session.
ETH/USDT 1W Chart📊 Market Structure:
Main Trend: Still up (higher lows and highs pattern persists).
Current Phase: Correction in an uptrend.
Local Trend: Down for several weeks (series of red weekly candles).
⚙️ Key Support and Resistance Levels:
Resistance (green lines):
4,753 USDT – recent local high, very strong resistance.
4,373 USDT – previous consolidation level, currently a supply zone.
3,979 USDT – current key local resistance, which previously served as support.
Support (red lines):
3,600 USDT – currently tested support level (coincides with the uptrend line).
3,165 USDT – next strong support level (previous local lows).
2,740 USDT – strong long-term support, potential target for further correction.
📈 Trendline:
The black uptrend line connects successive higher lows since April 2024.
The current weekly candlestick is testing this line (confluence with support at 3,600 USDT).
Maintaining this line = still a bullish medium-term scenario.
A breakout and weekly close below ~3,580–3,600 USDT → a signal of a possible trend reversal.
📉 Volume:
Downward volume is increasing, indicating supply pressure.
A lack of strong demand candlesticks = buyers are cautious in this zone.
🔄 Stoch RSI Oscillator (bottom of the chart):
Located in the oversold zone (below 20).
The %K (blue) and %D (orange) lines are starting to converge → a possible rebound signal in the coming weeks if a crossover occurs upwards.
🧭 Scenarios:
🟢 Bullish
Holding support at 3,600 USDT + trendline.
Confirmation with a bullish candle with higher volume.
Target: Return to 3,980 → 4,370 USDT.
🔴 Bearish:
Closing the week below 3,580 USDT (trendline + support).
Potential decline to 3,165 USDT, and even 2,740 USDT beyond.
RSI and volume suggest that downward pressure remains significant.
📌 Summary:
Key level: 3,600 USDT → decisive point for the market's further direction.
Short-term: Still downward pressure, but a technical rebound is possible (Stoch RSI).
Medium-term: The uptrend has not reversed until ETH closes below the trend line and 3,550 USDT.

Backtesting 101: How to Turn an Idea Into a Tested StrategyEvery trader has thought it:
“If I’d just followed that setup every time, I’d be up big.”
That’s where backtesting steps in, it separates luck from logic.
It’s how you find out whether your strategy has a real edge, or just worked in hindsight.
Most traders skip it, not because it’s useless, but because it forces them to face the truth.
But if you can handle that truth, backtesting will make you a far more confident trader.
What Backtesting Really Is
Backtesting means applying your trading rules to historical data to see how your system would have performed.
It’s not about predicting the future, it’s about proving whether your idea works in different market conditions.
When done properly, it gives you three key insights:
Profitability: does your edge actually exist?
Risk: how deep are the drawdowns, and can you handle them?
Consistency: does it work across bull, bear, and sideways markets?
A solid backtest gives you confidence, not because it guarantees profit, but because it exposes weakness before the market does.
The Most Common Mistakes
Curve-fitting: tweaking rules until the past looks perfect.
Ignoring fees and slippage: small costs that quietly erase profits.
Testing too little data: short periods create false confidence.
Focusing on one market: edges must survive different conditions.
If your backtest looks too clean, it’s probably lying to you.
Why It Matters
Backtesting builds trust in your system and discipline in yourself.
When you know your data, you stop second-guessing every trade.
Losing trades stop feeling like failure, because you understand they’re part of a proven edge.
Even bots rely on backtesting. Without it, automation is just random execution.
With it, every trade follows structure, not emotion.
All of these points make a difference between a winning or losing strategy.
From Idea to System
Every strategy starts as a hypothesis.
Backtesting turns that hypothesis into data.
Data turns into structure.
Structure turns into consistency.
That’s the real path to professional trading - logic first, emotion second.

XAUUSD Long: Demand Zone Holding, Eyes on $4,080Hello traders! Gold (XAUUSD) is currently showing a corrective phase within its broader bullish trend. After a strong rally from the $3,850 Demand Zone, price climbed steadily along the ascending Trend Line, forming higher highs and higher lows until reaching the $4,150–$4,180 Resistance Area. This zone acted as a key pivot point, where buyers lost momentum and sellers initiated a retracement.
Following this, the market broke below the Trend Line, signaling the start of a short-term correction. The correction found temporary support near the $3,950 Demand Zone, where buyers have recently stepped in again. This level coincides with a previous pivot and a key structural support area, suggesting a potential rebound setup. At the moment, price is consolidating between the $3,950 Demand Zone and the $4,080–$4,150 Resistance Area, indicating indecision before the next move.
From my perspective, Gold is likely to attempt a bullish correction toward the $4,080–$4,150 Resistance Zone, which aligns with both the previous Trend Line and recent pivot structure. A successful break and close above $4,150 would confirm a trend continuation toward higher levels. However, if the price fails to break above this resistance area and gets rejected, sellers could regain control, pushing the market back down toward $3,950 or even lower. For now, I’ll be watching for confirmation of a bullish reaction from the $3,950 Demand Zone to validate a short-term long setup targeting $4,080. Manage your risk!

BTCUSDT: Buyers Aim for Recovery Toward $115K ResistanceHello everyone, here is my breakdown of the current Bitcoin setup.
Market Analysis
Bitcoin (BTCUSDT) is showing a constructive bullish setup after rebounding from the 106,600–107,000 Support Zone. This area has consistently acted as a strong demand region, confirming buyers’ interest each time price tested the lower boundary of the Upward Channel. The market structure has remained bullish overall, characterized by a series of higher highs and higher lows since the correction phase in mid-October.After a recent fake breakout below the support line, buyers quickly regained control, pushing price back above the channel’s lower boundary. This rejection from support and recovery above 110,000 suggests renewed bullish momentum.
Currently, BTCUSDT is approaching the midline of the channel, while short-term resistance lies at 115,400 — a level that coincides with a previous fake breakout zone and horizontal supply area.
My Scenario & Strategy
As long as BTCUSDT holds above the 109,000–110,000 region, the bullish scenario remains valid. I expect the price to continue climbing toward the 113,000–115,400 Resistance Zone in the near term. A clean breakout above 115,400 could open the way for another bullish leg toward the upper boundary of the channel near 117,000–118,000.
However, a confirmed rejection from 115,400 could trigger a temporary pullback toward the support trendline before another potential push higher. In my view, Bitcoin remains in a healthy uptrend, and I prefer to look for long opportunities from dips above the support line, targeting 115,400 (TP1) and potentially 117,000 (TP2).
That's the setup I'm tracking. Thank you for your attention, and always manage your risk.

EURUSD: Bounce from Support Could Trigger Move Toward 1.1640Hello everyone, here is my breakdown of the current Euro setup.
Market Analysis
EURUSD has been trading in a corrective phase after breaking down from the Upward Channel that previously guided its bullish movement. The pair formed a Range near the 1.1760 Resistance Area, showing consolidation before sellers regained control. Multiple Breakouts confirmed shifts in market structure — first to the upside within the channel, and later to the downside, signaling the transition from bullish to neutral-bearish momentum.
Recently, price found strong demand within the 1.1550–1.1560 Support Zone, which aligns with the Triangle Support Line. This level has been tested multiple times, acting as a significant pivot point for potential bullish reactions. The Triangle Resistance Line above continues to limit upward movement, forming a contracting structure that reflects growing pressure from both sides.
My Scenario & Strategy
From my view, EURUSD is currently setting up for a possible bullish rebound from the support zone near 1.1560. If buyers defend this level, the price could rise toward the Triangle Resistance Line around 1.1630–1.1640. A confirmed breakout above this resistance could open the way toward the key 1.1760 Resistance Zone, signaling a shift in sentiment back to bullish.
However, if the pair fails to hold above the Triangle Support Line, a breakdown could trigger a deeper decline toward 1.1500. For now, I maintain a short-term bullish bias, looking for long opportunities near support with clear confirmation signals.
That's the setup I'm tracking. Thank you for your attention, and always manage your risk.

BTCUSD Rebound Setup: Buyers Target 114K Resistance ZoneHello traders, I want to share with you my opinion about Bitcoin (BTCUSD). Bitcoin continues to move within a well-defined descending channel, forming a consistent pattern of lower highs and lower lows. This confirms that the market remains under bearish control, with sellers actively defending each retest of the resistance line. The Resistance Level at 115,600 has acted as a major cap for bullish attempts, rejecting multiple upside moves over the past few weeks. Recently, BTC retested the Buyer Zone near 108,000–109,000, where strong demand emerged, preventing further downside. This level aligns with both the Support Line of the channel and the horizontal Support Level at 106,400, making it a critical zone for potential bullish reactions. At the current stage, the price is showing early signs of a corrective rebound from the Buyer Zone. I believe this recovery could push the price toward the Seller Zone and Resistance Line, with a short-term target (TP1) around 114,000. However, this move should be viewed as a correction within a broader bearish trend unless BTC manages to break and hold above the 115,600 resistance area. My scenario suggests that BTC could face selling pressure once it reaches the upper boundary of the channel, possibly leading to another bearish leg unless bulls confirm a breakout. Please share this idea with your friends and click Boost 🚀

Gold price developments March 11📊Market Structure (H1 Chart)
Current Structure:
Price is moving within a symmetrical triangle pattern — showing a consolidation phase before the next breakout.
Main Trendlines:
Upper Trendline: Descending dynamic resistance, connecting lower highs.
Lower Trendline: Ascending dynamic support, connecting higher lows.
⚙️Key Zones
Resistance: 4,105 – 4,110 → aligns with the upper trendline and potential breakout confirmation area.
Support 1: 3,950 → confluence of the lower triangle boundary and previous accumulation zone.
Support 2: 3,890 → recent swing low, key structural level for trend direction.
🎯Scenarios
✅Bullish Breakout:
Break above 4,030 – 4,050 → look for buy setups targeting 4,105 – 4,175.
⚠️Rejection at Upper Trendline:
If price gets rejected near resistance, expect a pullback toward 3,950 → watch for bullish reaction to re-enter buys.
❌Breakdown Below 3,950:
Confirms structure failure → potential short opportunity toward 3,890.
⛏ BUY Breakout : 4030 - 4027
(Follow breakout confirmation)
Stoploss : 4013
Take profit 1 : 4050
Take profits 2: 4100
⛏BUY GOLD : 3951- 3948
Stoploss : 3938
Take profit 1 : 3960
Take profit 2 : 4000
⛏SELL GOLD : 4100 - 4103
Stoploss : 4113
Take profit 1 : 4080
Take profit 2 : 4050
The market is in compression phase within a symmetrical triangle — stay patient and wait for a clear breakout or rejection signal before taking action.
Trade smart. Trade disciplined.

Gold compression before expansionGold remains in a controlled accumulation phase after a strong move, holding rising lows and respecting the fair value zone near 3990. As long as buyers defend the 3985–4000 range, the setup favors a false dip and re-entry scenario with continuation higher. A clean break and hold above 4040 unlocks the first target at 4110, and extension toward 4200 remains valid on structural expansion and Fibo alignment. The market is balanced on a hinge: levels are defined, buyers present, but confirmation lies only in price reclaiming the breakout zone.
Fundamentally gold still tracks macro uncertainty. Rates, inflation expectations, dollar hesitation and US debt dynamics keep capital rotating defensively. This is one of those periods where expectations and reality diverge, and the longer the compression holds, the stronger the eventual move. Still, discipline first — price must confirm above 4040.
Bias remains bullish while above 3985. Break below opens a corrective path toward 3920–3890 before another attempt higher.

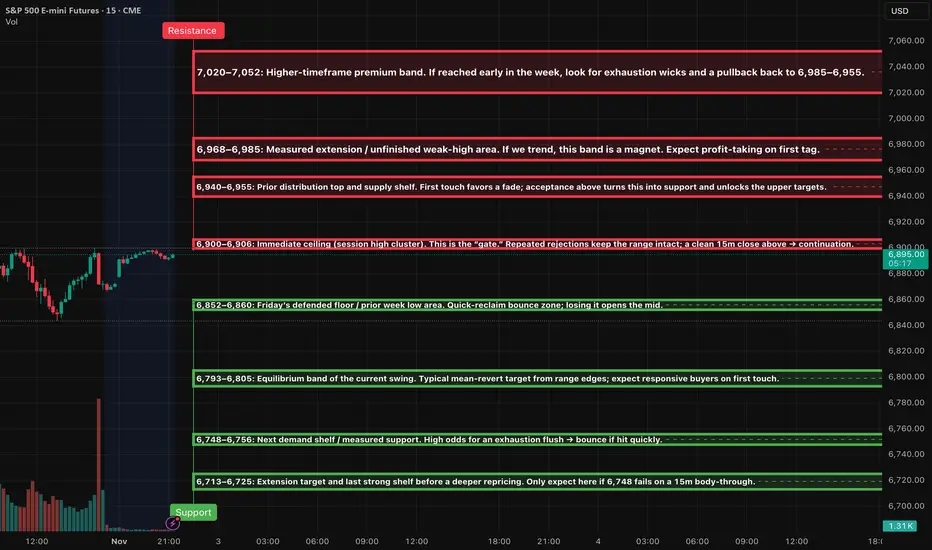
ES (SPX, SPY) Week Ahead Analysis, Nov 3rd - Nov 7thMarket Context
The price is currently positioned just below a key near-term resistance level at 6,900–6,906, following a sharp reversal on Friday from around 6,845. The daily and 4-hour structures indicate an incomplete "weak-high" area above, but the 1-hour momentum has just shifted upward from oversold conditions. As we move into the Asia/London sessions, I anticipate a balance formation within the upper half of the previous session unless we see a decisive 15-minute close above 6,906.
Short — Rejection Fade at 6,900–6,906
Trigger: 15m rejection close back below the band → 5m re-close down with a lower high → 1m first pullback fail.
SL: Above the 15m wick high +0.25–0.50.
TP1: 6,880 → 6,860 (≥2.0R gate). TP2: 6,805.
Notes: If a retest holds below 6,900, add on a fresh 1m LH.
Short — Rejection Fade at 6,940–6,955
Trigger: Same 15m→5m→1m sequence as above.
SL: Above the band’s 15m wick +0.25–0.50.
TP1: 6,900 gate; TP2: 6,880–6,860; stretch TP3: 6,805.
Long — Acceptance Continuation above 6,906
Trigger: 15m full-body close above 6,906 → 5m pullback holds and re-closes up → 1m HL entry.
SL: 5m pullback low −0.25–0.50.
TP1: 6,940–6,955; TP2: 6,968–6,985; stretch TP3: 7,020–7,052.
Notes: If 6,906 holds as support on retest, consider scaling on a clean 1m HL.
Long — Quick-Reclaim Bounce at 6,852–6,860
Trigger: Sweep/flush below the band and instant reclaim (1–3m), confirmed by a 5m re-close up → 1m HL entry.
SL: Below the sweep low −0.25–0.50.
TP1: 6,900 gate; TP2: 6,940–6,955.
Long — Quick-Reclaim Bounce at 6,793–6,805
Trigger: Same reclaim logic; prefer fast tag → quick pop.
SL: Below the 5m reclaim low −0.25–0.50.
TP1: 6,860; TP2: 6,900; optional TP3: 6,940.
Long — Exhaustion Flush Bounce at 6,748–6,756 (stretch 6,713–6,725)
Trigger: Fast liquidation into the band + momentum divergence → 5m reversal close → 1m HL entry.
SL: Below the exhaustion low −0.25–0.50.
TP1: 6,793–6,805; TP2: 6,860; trail only after TP2.
Short — Continuation Below 6,852
Trigger: 15m body-through below 6,852 that holds on retest → 5m LH → 1m pullback entry.
SL: Above the 15m break wick +0.25–0.50.
TP1: 6,805; TP2: 6,756; stretch TP3: 6,725.
KILL-ZONES & EXECUTION NOTES
Primary execution windows: NY AM 09:30–11:00 and NY PM 13:30–16:00. London 02:00–05:00 optional, reduced size. Asia optional, smallest size.
Stops & viability: Anchor hard SLs to the relevant 15m wick; only take plays where TP1 ≥ 2.0R. Max two attempts per level per session. At TP1: close 70%, set 30% runner to BE; no trailing before TP2.
WEEK AHEAD GAME PLAN
If Monday holds above 6,860 and forms a higher low, the outlook is modestly bullish, aiming for a move toward 6,940–6,955 early to mid-week. A decisive daily close above 6,955 would suggest a rally into the 6,968–6,985 range, with the potential to extend further to 7,020–7,052 later in the week.
Conversely, if the price falls back below 6,852, the scenario shifts to a mean-reversion week, targeting 6,805 and then 6,756, with 6,713 as a potential stretch target.
BTCUSD Short: Targeting 108,000 Demand ZoneHello, traders! Bitcoin (BTCUSD) has recently transitioned from a prolonged bullish structure into a corrective phase after facing strong rejection from the 116,000 Supply Zone. The market previously traded inside a well-defined Ascending Channel, forming a steady sequence of higher highs and higher lows — a classic bullish formation.However, after testing the upper boundary of the channel and the Pivot Point, BTC failed to sustain bullish momentum. The breakout attempts above the supply zone turned out to be fake breakouts, showing exhaustion among buyers. Since then, the market has shifted its tone and started to form a descending structure, moving below the Supply Line that now acts as dynamic resistance.
Currently, the price is pushing lower from the mid-range of the channel toward the Demand Zone, located between 108,000 and 107,700. This area has previously served as a strong support base that triggered impulsive bullish reversals in the past.
In my opinion, BTC is likely to extend its bearish correction toward the 108,000–107,700 demand area. A successful test and strong reaction from this zone could mark a potential bullish reversal, confirming demand absorption and the end of the correction phase. However, if sellers maintain control and manage to break decisively below 107,700, the market may open the way for a deeper decline toward the 106,000 level. As long as the price remains below the Supply Line, short-term bearish pressure prevails. I’m currently bearish to neutral, looking for price action signals around the demand area to confirm whether a new upward impulse is about to begin. Manage your risk!

NZDCHF: H1 ATL BreakKey observations across the D1 and H1 timeframes
D1
Pair is in a clean downtrend
Right now, the bearish bar hasn't closed below the low of the bullish bar, which is a small point of concern for selling strength
H1
Price is crossing below a very structural ATL
EMA bands haven't crossed over yet

Comex Gold.Here is pattern in short time frame that is 15 min. This is a triangle pattern and if you look carefully you will also spot Flag and Pole which I leave you guys to spot for. A breakout from this will trigger an entry.
Tagret for Day high with sl of 3994.
Disclaimer - This is just for educational purpose.
Jai Shree Ram
Follow for more such analysis and learnings!

Crypto will boom, BUT...In my view, the cryptocurrency market is poised for a significant multi-year rally.
However, such a rally cannot begin without a major transfer of capital, from weaker holders to large institutional players. This is why I believe we are likely to experience a sharp correction in the coming days or weeks, possibly extending toward the end of the year.
My outlook for this short-term downturn is driven by two key factors:
Persistent uncertainty surrounding the Federal Reserve’s next policy move, particularly whether it will proceed with an interest rate cut in December, and a bearish pattern emerging in the global money supply. After a notable recent decline, this formation suggests further contraction ahead.
The good news is that this potential market shakeout may serve as the final reset before Bitcoin establishes its bottom. Those who withstand the upcoming volatility will likely find themselves well-positioned for the next major bull run.
#bitcoin #crypto #finance #economy #market #analysis

Trading Bots: The Future of the Markets?Let’s be real, the idea of a trading bot sounds like the holy grail.
Set it up, go to bed, and wake up to profit.
If only it were that simple.
Most bots don’t fail because of bad code, they fail because of bad logic.
A bot is only as good as the rules you give it.
What a Trading Bot Actually Does
A bot doesn’t predict the market, it reacts to it.
It follows a defined strategy:
Buy when X happens, sell when Y is confirmed, cut losses if price breaks Z.
That’s all.
No fear. No greed. No “maybe I’ll wait for one more candle.”
The power of bots isn’t in magic,it’s in consistency.
They do what most traders can’t: follow the plan exactly as written, every single time.
Why Most Bots Fail
The truth?
Most traders plug in random bots they find online without understanding what’s inside.
They win a few trades, feel invincible… and then lose it all when volatility spikes.
The reason isn’t the bot, it’s the lack of testing and understanding.
If you don’t know your system’s weak spots, you’ll eventually find them the hard way.
That’s why backtesting matters.
Backtesting: Your First Line of Defense
Backtesting shows how your logic performs over hundreds of trades — across bull, bear, and sideways markets.
It reveals your system’s strengths, weaknesses, and drawdowns before you risk a dollar.
A good backtest should tell you:
Your average win rate and risk/reward ratio.
How your system handles volatility.
How often it hits consecutive losses.
Whether your edge actually holds over time.
If your bot looks good in backtests and performs similarly in live conditions — you’re onto something real.
*Example of one of our indicator
How Bots Can Enhance Your Trading
You don’t have to hand everything over to automation.
In fact, many great traders use bots to handle the mechanical side, while keeping the decision-making human.
Here are a few examples:
Trade Execution: Let the bot enter trades instantly after your setup triggers.
Risk Management: Bots can move stop-losses, take partial profits, or scale positions automatically.
Signal Filtering: Use automation to scan hundreds of pairs and alert you only when conditions align.
Backtesting Sandbox: Test new ideas safely with data before deploying them live.
Bots don’t replace traders, they multiply efficiency.
They free your mind from execution so you can focus on refinement.
The Real Lesson
A trading bot isn’t a shortcut.
It’s a mirror, it reflects your discipline, your rules, and your logic.
If your plan is solid, a bot will make it unstoppable.
If your plan is weak, it’ll just lose money faster.
Automation doesn’t fix bad habits, it exposes them.
So learn the logic, test it hard, then let the system do what humans struggle with most: follow the plan.

Bitcoin Approaches Key Resistance — Bulls Eye 117K BreakoutHello traders, I want to share my view on Bitcoin (BTCUSD). The current market structure shows a gradual recovery phase following the previous breakdown from a large range near the 118,000 level. After a sharp decline and retest of the 106,400 support zone, the market found strong buying interest, forming a new ascending channel structure. This setup has been characterized by steady higher highs and higher lows, confirming the presence of short-term bullish momentum. At this stage, BTCUSD is approaching a key resistance level around 116,000, which aligns with both the upper boundary of the current channel and the prior horizontal resistance zone — a region that previously acted as a strong supply area. This confluence suggests that the market could face a short-term pause or pullback before attempting another bullish impulse. My primary scenario anticipates that if the price holds above the support line near 113,000–113,500, buyers may maintain control and push toward the 117,000 target (TP1) — the next logical resistance level and the top of the channel. However, a clear rejection from 116,000 without follow-through could open the door to a corrective pullback toward 110,500–111,000 for another demand test. In my opinion, the structure remains bullish in the short term, as long as the lower boundary of the ascending channel holds. Therefore, I continue to favor a long scenario with a TP at 117,000, expecting a potential breakout or test of the upper resistance. Please share this idea with your friends and click Boost 🚀

Fundamental Market Analysis for October 30, 2025 USDJPYThe yen weakened after the Bank of Japan kept its policy rate near 0.50% today, again declining to back proposals from some members for a move to 0.75%. The statement keeps future steps “in view” but offers no timeline, reinforcing the yield differential in favor of the United States and supporting USD/JPY near the top of its recent range.
An additional impulse for USD comes from the Fed: while it delivered a 25 bps cut, Chair Powell stressed that subsequent actions are not predetermined. For USDJPY, what matters is not the single rate print but expectations for U.S. Treasury yields and risk appetite. Yields along the curve remain relatively high, and the Fed’s readiness to pause points to a slower easing cycle, which supports the dollar against the yen.
External factors round out the picture: moderately positive global risk sentiment and the absence of strong signals from Japan’s Ministry of Finance about interventions. Given the current monetary-policy trajectories in the U.S. and Japan, upward attempts in USDJPY persist while pullbacks look contained.
Trading recommendation: BUY 152.750, SL 152.100, TP 153.500
