SGDCAD: Price Holds Above Daily HTLKey Observations
Daily Timeframe:
Price tested this daily HTL as resistance a few times. The last break was very strong.
After price reverted below this daily HTL, it did not make a new lower low. Instead, it traded above this level rather quickly.
Overall, this gives me an indication that selling pressure is weakening.
H1 Timeframe:
Price crossed below EMA20, but this was shortlived
As price exits the EMA band, this is an indication that momentum might pick up
Realistically, I might close this trade and re-open in order to bypass the the 5PM rollover spike in spreads
Analysis

GBP/USD - Breakout Pattern (14.10.2025)The GBP/USD pair on the M30 timeframe presents a Potential Buying Opportunity due to a recent Formation of a Breakout Pattern.
This suggests a shift in momentum towards the upside and a higher likelihood of further advances in the coming hours.
Possible Long Trade:
Entry: Consider Entering A Long Position around Trendline Of The Pattern.
Target Levels:
1st Resistance – 1.3434
2nd Resistance – 1.3484
🎁 Please hit the like button and
🎁 Leave a comment to support for My Post !
Your likes and comments are incredibly motivating and will encourage me to share more analysis with you.
#GBPUSD #Forex #Trading #TechnicalAnalysis #PriceAction #ForexSignals #BreakoutTrading #Ichimoku #FXTrading #BullishSetup #TradingView
⚠️ Disclaimer:
This analysis is for educational purposes only and not financial advice. Always use proper risk management and conduct your own research before trading.
Best Regards, KABHI_TA_TRADING
Thank you.

Fundamental Market Analysis for October 14, 2025 GBPUSDOn October 14, 2025, the pound has recovered to 1.33300–1.33400, retracing as worries over a tariff flare-up between the US and China eased. The retreat of some safe-haven demand for the dollar and stabilization in global risk appetite supported sterling, while the market closely assesses fresh UK labor data and the government’s autumn fiscal outlook.
Domestically, wage growth and services inflation remain pivotal. As long as these components stay elevated, expectations for rapid Bank of England easing are limited, which helps prevent deeper GBP declines. At the same time, a better global risk backdrop and renewed interest in European assets create a window for moderate GBP/USD upside.
The external backdrop is neutral-to-positive: reduced tariff tension and the absence of unexpectedly restrictive signals from the Federal Reserve encourage the market to probe higher levels in the pair. Under these conditions, an upside scenario looks preferable with careful risk control.
Trading recommendation: BUY 1.33350, SL 1.33150, TP 1.33950

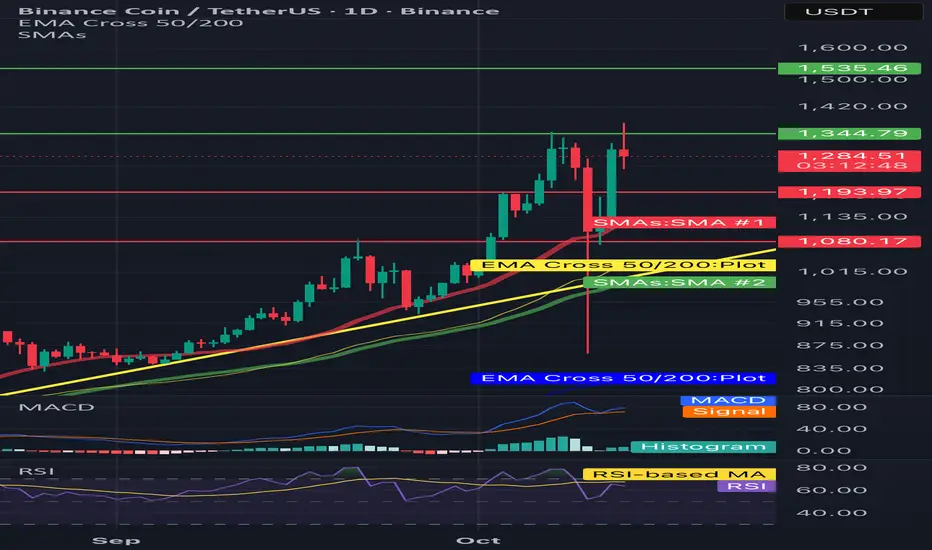
BNB/USDT 1D Chart Review🧭 Key technical levels
Resistances:
• 1,344–1,350 USDT – local resistance (last candle highs).
• 1,535 USDT – strong resistance from previous highs.
Support:
• 1,193–1,200 USDT – first strong support (the reaction of the candles is visible).
• 1,080 USDT – another important level, coincident with the yellow uptrend line and EMA50.
⸻
📊 Technical indicators
1.EMA/SMA:
• The red SMA and yellow EMA show that the medium-term trend is up (EMA 50 > EMA 200).
• The price is currently testing the zone between the SMA and EMA - if it stays above ~1,190-1,200, a rebound may occur.
2. MACD (bottom):
• The signal line (orange) crosses the MACD (blue) from above → bearish signal.
• The histogram is starting to flatten - possible end of correction if it lasts for a few days.
3.RSI:
• RSI around 50-55, neutral → no overbought or oversold yet.
• If the RSI rebounds from 50 upwards, it may mean the price rebounds from support.
⸻
📈 Scenarios
✅ Upward scenario (more likely if it maintains support)
• Maintaining above 1,190 USDT → reflection towards 1,344 and then 1,535.
• Confirmation: daily candle closed above 1,344 + increasing volume.
⚠️ Downside scenario
• Loss of the level of 1,190 USDT → correction to 1,080 USDT (EMA 50 test).
• If this support breaks, the next target is around USDT 950-1,000.
GBPUSD: Testing Daily HTLKey Observations
Daily Timeframe
EMA20 crosses below EMA60 > signals a weak downtrend
Overall, this pair is topping out given the lower high formed
H1 Timeframe
Price fails to hold above the EMA band as it quickly cross below it
Very likely momentum to the downside will pick up

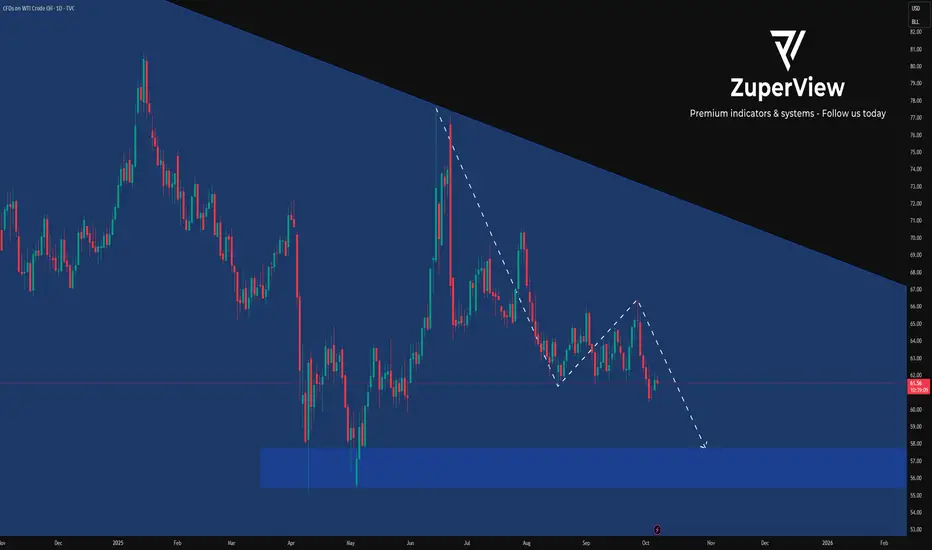
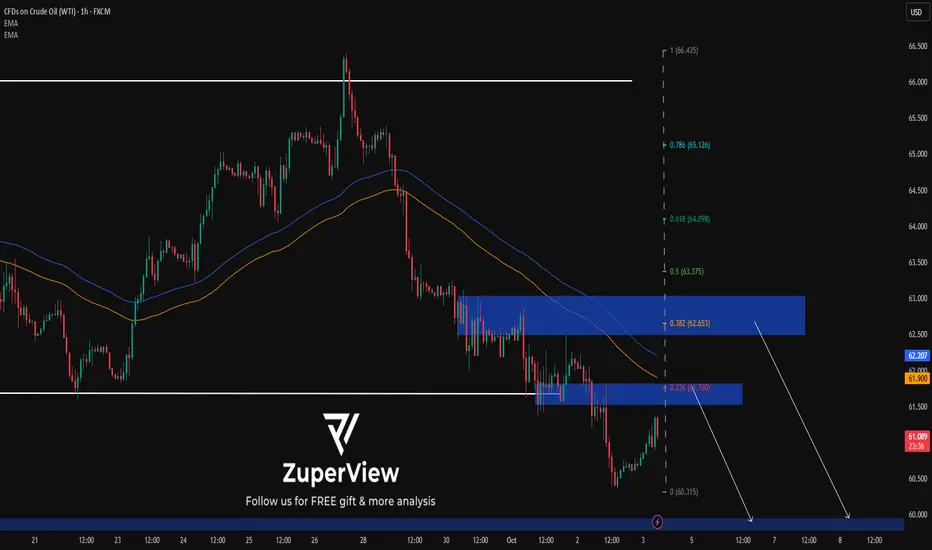
USOIL: Check lower levels after breaking out of the rangeThis is my previous analysis — feel free to take a look for reference.
OIL PRICE OUTLOOK
(Week of Oct 06 - 10, 2025)
1. Institutional Forecast Updates
● IEA (Sep 15, 2025):
WTI targets $64.2/bbl for 2025 and $47.8/bbl for 2026
Brent targets $68/bbl for 2025 and $51/bbl for 2026
● Goldman Sach (Jul 14, 2025):
WTI targets $63/bbl for H2 2025 and $52/bbl for 2026
Brent targets $64/bbl for H2 2025 and $56/bbl for 2026
● J.P. Morgan (May 16, 2025):
WTI targets $63/bbl for H2 2025 and $52/bbl for 2026
Brent targets $64/bbl for H2 2025 and $56/bbl for 2026
www.rigzone.com
www.reuters.com www.jpmorgan.com
2. Key Drivers & Risks
🔹 Updates on Supply–Demand and Geopolitical News
OPEC+ announced a milder-than-expected production increase of around 137 kb/d for November, leaving the oversupply outlook through 2026 largely unchanged.
Geopolitical tensions in the Red Sea / Gulf of Aden have flared up again.
U.S. inventories and weekly data: API estimated a draw of 3.7 mb (Sep 26), while recent EIA reports have shown mixed, inconsistent trends.
Market consensus: Reuters’ latest survey keeps the Brent forecast at ~$67.6/bbl for 2025, unchanged from last month, with expectations for lower prices around $60 in 2025 and further weakness into 2026.
🔹 Watchlist for Next Week
Official details on OPEC+’s November production implementation
API / EIA weekly U.S. oil data
Maritime security developments
Any notable demand-side signals
🔹 Overall View
Governments appear to favor keeping oil prices lower to support economic growth, though current levels are near or below breakeven for many producers.
Oil prices are expected to gradually decline within a relatively narrow range of $70–$50, while potential supply–demand shocks remain key factors to monitor for any sharp volatility.
3. Technical Analysis
* Trend: assessed using at least three trend indicators, with market structure as the primary guide.
** Weak or Reversal Signals: Assessed based on one of our criteria for trend reversal signals.
*** Support/Resistance: Selected from multiple factors – static (Swing High, Swing Low, etc.), dynamic (EMA, MA, etc.), psychological (Fibonacci, RSI, etc.) – and determined based on the trader’s discretion.
**** Our advice takes into account all factors, including both fundamental and technical analysis. It is not intended as a profit target. We hope it can serve as a reference to help you trade more effectively. This advice is for informational purposes only and we assume no responsibility for any trading results based on it.
Please like and comment below to support our traders. Your reactions will motivate us to do more analysis in the future 🙏✨
George Vann @ ZuperView
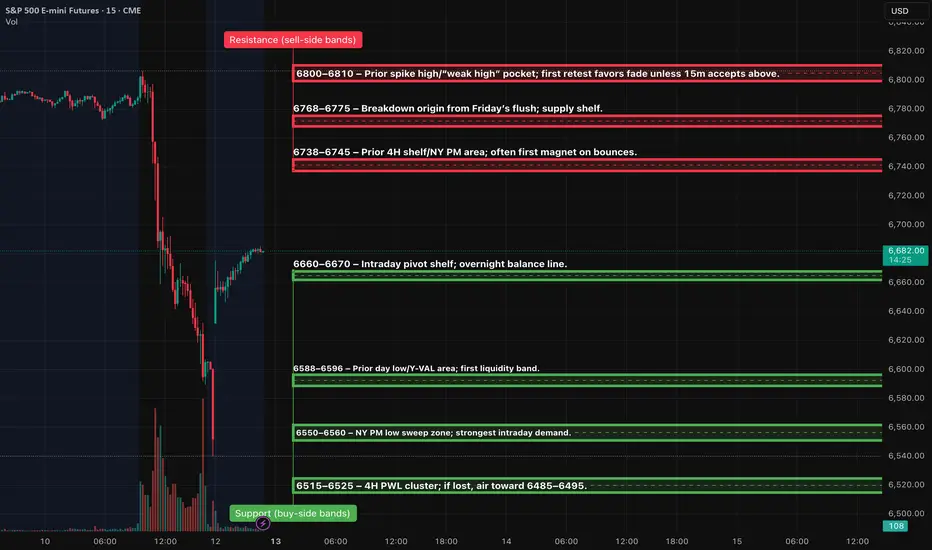
ES (SPX, SPY) Analyses, Key-Zones, Week (Mon 10/13 → Fri 10/17)Macro drivers to watch (ET)
Powell (NABE) — Tue 10/14 ~12:20. Markets will parse tone on growth/inflation. (Fed official calendar confirms time & venue.)
PPI (Sep) — Thu 10/16 8:30. First major U.S. inflation print of the week. (BLS “Next Release”.)
Advance Retail Sales (Sep) — Thu 10/16 8:30. Key read on demand into holiday season. (Census “MARTS” note; FRED release calendar.)
CPI (Sep) — not this week; rescheduled to Fri 10/24 8:30 due to the shutdown. (BLS reschedule notice; CPI schedule.)
Earnings kick-off (could move ES): JPM Tue 10/14, BAC Wed 10/15. (Company IR pages/press.)
Market conditions: U.S. bond market closed Mon 10/13 (liquidity thinner); NYSE equities open. (SIFMA; NYSE hours.)
Options expiration: standard monthly Fri 10/17. Expect pinning flows. (Cboe 2025 calendar.)
Setups (Level-KZ Protocol — 15m→5m→1m; NY kill-zones preferred)
TIER-1 (A++) — Rejection Short at 6790–6810 (NY AM)
Trigger: 15m full-body fails to hold above 6790–6810 → 5m prints a lower-high and re-closes back inside → 1m first pullback “pop-and-fail”.
Entry: 6796–6803 on the 1m failure.
Invalidation: Hard SL above the 15m fail-wick (guide 6814).
TPs: TP1 6738–6745, TP2 6690–6700, TP3 6625–6635.
TIER-1 (A++) — Quick-Reclaim Long at 6550–6560 (Asia/London → carry to NY)
Trigger: Liquidity sweep into 6550–6560, immediate 15m re-close back above 6600, 5m holds ≥6620, 1m higher-low entry.
Entry: 6602–6610 on the first pullback that holds.
Invalidation: Hard SL below the 15m sweep-low (guide 6544).
TPs: TP1 6690–6700, TP2 6738–6745, TP3 6768–6775.
TIER-2 (A+ Bounce) — 6590–6596 fast reclaim
Trigger: Wick through 6590–96 that immediately reclaims ≥6620 on 5m.
Entry/SL: Enter 6615–6622; SL below sweep-low −0.5pt.
Targets: 6690 then 6738–45. ¾ size.
TIER-3 (A Bounce) — 6515–6525 exhaustion flush
Trigger: Capitulation into the 4H PWL band with 15m reversal signal.
Entry/SL: Scale inside the band; SL below the 15m reversal wick.
Targets: 6590–96 then 6690. ½ size; only first touch.
GOLD (XAUUSD) 15M – Bullish Continuation SetupTVC:GOLD
🚀
Structure | Trend | Key Reaction Zones
Price perfectly respected the demand zone near 3945–3960 and rebounded strongly.
Market is maintaining a clean ascending channel structure, signaling controlled bullish momentum.
A higher-low formation above 4020 confirms continued buyer strength.
Market Overview
Gold respected the lower trendline and demand zone, showing a sharp bullish reaction back above 4020. The structure remains intact for an upside continuation as long as 4020 holds as intraday support. The next bullish impulse could target the previous high zone near 4060. A clean break above that may extend the rally toward 4080.
Key Scenarios
✅ Bullish Case 🚀 → 🎯 Target 1: 4060 | 🎯 Target 2: 4080 | 🎯 Target 3: 4100
❌ Bearish Case 📉 → 🎯 Target 1: 4000 | 🎯 Target 2: 3960 (if structure breaks below 4020)
Current Levels to Watch
Resistance 🔴 : 4060 – 4080
Support 🟢 : 4020 – 3960
⚠️ Disclaimer: For educational purposes only. Not financial advice.

Bitcoin may Rally Back Towards the 118000 ResistanceHello traders, I want share with you my opinion about Bitcoin. The market for Bitcoin has experienced extreme volatility recently, with a powerful rally to a new all-time high near 126000 being completely erased by a sharp, news-driven decline down to 101000. This dramatic price swing has reset the market structure. Since that low, however, the price of BTC has staged a significant recovery, breaking back above the major 109500 support level and showing strong signs of a bullish reversal. Currently, the asset is in a minor corrective phase after this initial powerful rebound. In my mind, the strong reversal from the lows indicates that the sell-off was overdone and buyers are now re-engaging. I expect that the price will make a small corrective movement down to retest the major support level around 109500. I think a successful defense of this level, which also aligns with the buyer zone, will confirm the recovery is sustainable and will trigger the next major rally. Therefore, I have placed my TP at the 118000 resistance level, targeting the top of the prior consolidation range. Please share this idea with your friends and click Boost 🚀
Disclaimer: As part of ThinkMarkets’ Influencer Program, I am sponsored to share and publish their charts in my analysis.

BTCUSD: Rally between Trend Line can ContinueHello everyone, here is my breakdown of the current Bitcoin setup.
Market Analysis
From a broader perspective, the market for Bitcoin has been through a very complex and volatile consolidation. After multiple failed moves and tests of both the 108800 Support and the 118000 resistance, the price has finally shown a clear directional bias with a powerful breakout to the upside.
This breakout has established a new, clear uptrend which is being guided by an ascending trend line. Currently, after a strong impulsive rally, the price is in a healthy corrective phase, pulling back towards this main trend line for a potential retest, which is a key area to watch.
My Scenario & Strategy
I'm looking for the price to complete its correction down to this ascending trend line. The key signal for me would be a confirmed and strong bounce from this dynamic support, indicating that the pullback is over and buyers are ready to resume the rally.
Therefore, the strategy is to watch for this bounce. A successful defense of the trend line would validate the long scenario. My new target for the next impulsive wave higher is 127300, which would be a new ATH.
That's the setup I'm tracking. Thank you for your attention, and always manage your risk.

#ETH #ETHUSDT #ETHEREUM #Analysis #Update #Eddy#ETH #ETHUSDT #ETHEREUM #Analysis #Update #Eddy
According to the formed pattern, namely QM in the RTM style on the weekly block breaker, I expect an upward movement and a ceiling hunt and an ATH of Ethereum, and also in the ICT and liquidity styles, I expect a Fake BOS and a drop to the weekly block order to liquidate long positions and then continue the upward trend according to the analysis I did on the chart and the Path I drew. I expect the Ethereum currency to act accordingly.
So I expect an upward movement, a drop and a re-rise according to this analysis and explanation.
The important upper timeframe area for volatility has been identified and named.
These settings are based on a combination of different styles, including volume style with ict style and a combination of RTM and liquidity style.
Based on your strategy and style, get the necessary confirmations to enter the trade in these volatility settings.
Don't forget about risk and capital management.
The entry point, take profit point and stop loss point along with their values are indicated on the chart.
The responsibility for the transaction is yours and I am not responsible for any failure to comply with your risk management and capital.
🗒 Note: If, according to the analysis, the progress after the main rise begins, I expect the price of Ethereum to reach the targets of the latest analysis provided on Ethereum, which will be attached.
⚠️ Warning: Predicting market movements is a mistake and this analysis may be violated, so do not rush into your decisions and proceed to trade after obtaining the necessary confirmations. Market makers will always surprise us and predicting movements and future movements is a complex and difficult task.
Check out my previous analysis on Ethereum via the link below :

#BTC #BTCUSD #BTCUSDT #BITCOIN #Analysis #Eddy#BTC #BTCUSD #BTCUSDT #BITCOIN #Analysis #Eddy
I have identified the important supply and demand zones of the higher timeframe for you.
This analysis is based on a combination of different styles, including the volume style with the ict style.
Based on your strategy and style, get the necessary confirmations for this analysis to enter the trade.
Don't forget about risk and capital management.
The responsibility for the transaction is yours and I have no responsibility for your failure to comply with your risk and capital management.
💬 Note: This is just a possibility And this analysis, like many other analyses, may be violated. Given the specific circumstances of Bitcoin, it is not possible to say with certainty that this will happen, and this is just a view based on the ICT style and strategy with other analytical styles, including the liquidity style. (( The fall of Bitcoin may not change the trend of altcoins and money will move out of Bitcoin and into altcoins, and we will see altcoins grow. ))
Be successful and profitable.

Friday - the day the market shows its true faceEveryone loves chasing moves early in the week - Monday, Tuesday, news, data drops. But if you look closer, the most honest market signals usually appear on Fridays. By that time, the fight between buyers and sellers is settled, and the price reveals who really has control.
When big funds and banks are confident about direction, they don’t rush to close positions before the weekend. The market often ends the week at its highs - and Monday continues the same move. But if selling pressure picks up late on Friday, it’s usually a warning sign: traders are nervous and prefer not to hold risk over the weekend.
Friday’s close isn’t just another candle - it’s the verdict for the entire week. A close near the top of the range means demand is strong; near the bottom means fear and profit-taking are taking over.
Retail traders often close everything before the weekend to “stay safe.” But smart money uses those thin Friday hours to shake out weak hands and grab liquidity. That’s why the real moves often begin right after those late-week impulses.
What to keep an eye on:
1. Watch where the price closes within the weekly range - it sets the tone for Monday.
2. Check volume during the last trading hours - it tells you who’s really in control.
3. A strong Friday move with no news? Often that’s the setup for next week’s trend.
Friday’s action is rarely random. It’s the final scene before the next act of the market drama.
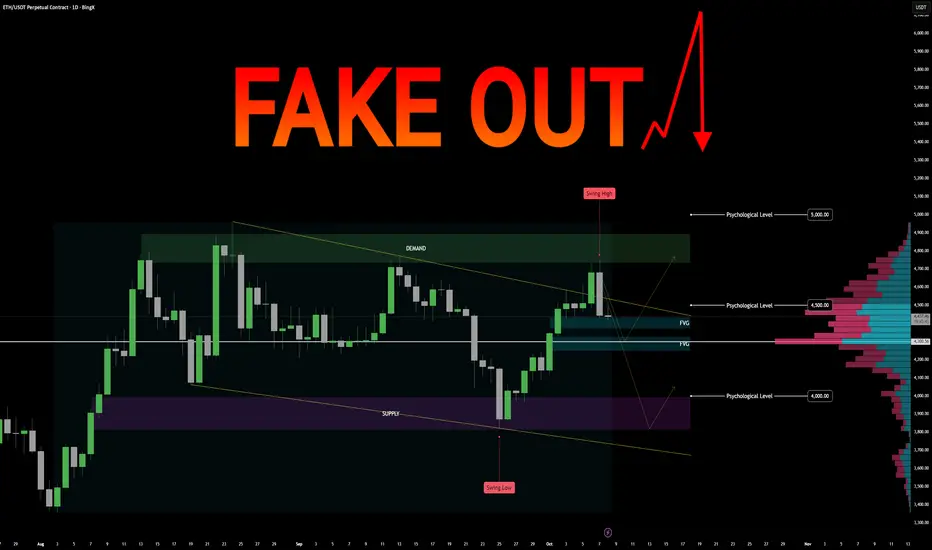
$ETH Market Assessment Incoming FAKEOUT? ETH/USD Perpetual – Market Assessment
Key Zones
Demand: 4737 – 4895
Supply: 3818 – 3994
Fair Value Gaps (FVGs): 4433, 4326
Anchored Volume Node: 4300 (significant liquidity cluster)
Psychological Levels : 4000, 4500, 5000
Recent Swing Points: High 4753, Low 3821
Technical Structure
High-Time Frame (HTF) Analysis:
Pattern: Bullish flag
Interpretation: Indicates potential continuation to the upside if price breaks above the flag resistance.
Daily-Time Frame (DTF) Analysis:
Pattern: Bearish channel
Interpretation: Suggests a slightly bearish pressure on the daily trend; caution required for long positions.
Volume and Liquidity:
Anchored volume node at 4300 aligns closely with FVGs at 4326 and 4433 – this area may act as strong support on pullbacks.
Scenario Planning
Bullish Scenario:
Price holds above demand zone (4737–4895).
Break above recent swing high at 4753 confirms bullish momentum.
Potential targets: 4895, 5000 psychological resistance.
Pullbacks likely to find support at FVGs (4433, 4326) or volume node (4300).
Bearish Scenario:
Price fails to hold demand zone and breaks below recent swing low 3821.
Next support: supply zone 3818–3994, then psychological level at 4000.
FVGs and volume node may temporarily slow the downside movement.
Summary / Notes
HTF indicates bullish continuation potential; daily trend shows bearish pressure.
Demand and supply zones, FVGs, and volume nodes are key levels for trade planning.
Monitor price reactions at swing points, psychological levels, and liquidity clusters to confirm trade setups.
Trade management should consider both bullish and bearish contingencies, with SLs placed near key FVGs or volume nodes.
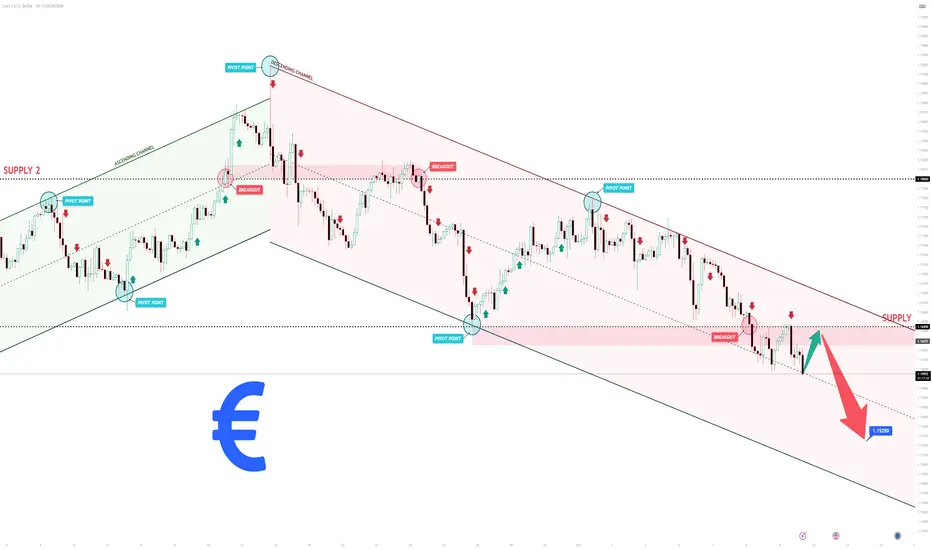
Euro may Break the 1.1550 Support LevelHello traders, I want share with you my opinion about Euro. The dominant market pressure for the Euro has been bearish since the price failed to sustain its rally to the 1.1920 high. This reversal initiated a significant downward trend for EURUSD, characterised by the breakdown of several key market structures, including the prior upward channel and the major 1.1740 resistance level. Currently, this bearish impulse has brought the price down to the major horizontal support level at 1.1550, an area which also coincides with a historical buyer zone. The price is now in a consolidation phase, attempting a minor corrective bounce from this support. In my mind, this bounce appears weak and lacks the momentum to signal a true reversal. I expect that this small upward movement will fail to attract significant buying interest and will soon be overcome by the prevailing selling pressure. I think a failure of this bounce will lead to a decisive breakdown below the 1.1550 support level. Therefore, I have placed my TP at 1.1510, targeting a new structural low in what I believe is a continuation of the primary downward trend. Please share this idea with your friends and click Boost 🚀
Disclaimer: As part of ThinkMarkets’ Influencer Program, I am sponsored to share and publish their charts in my analysis.

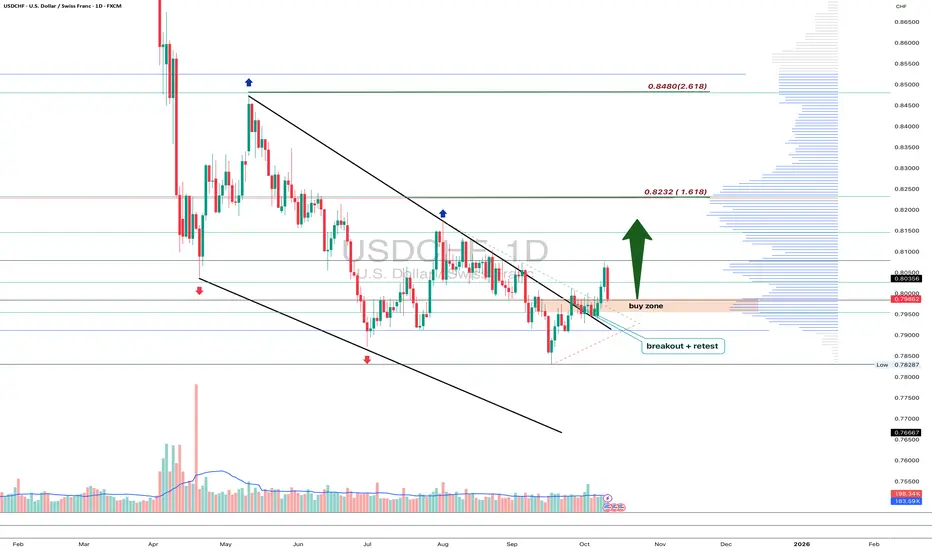
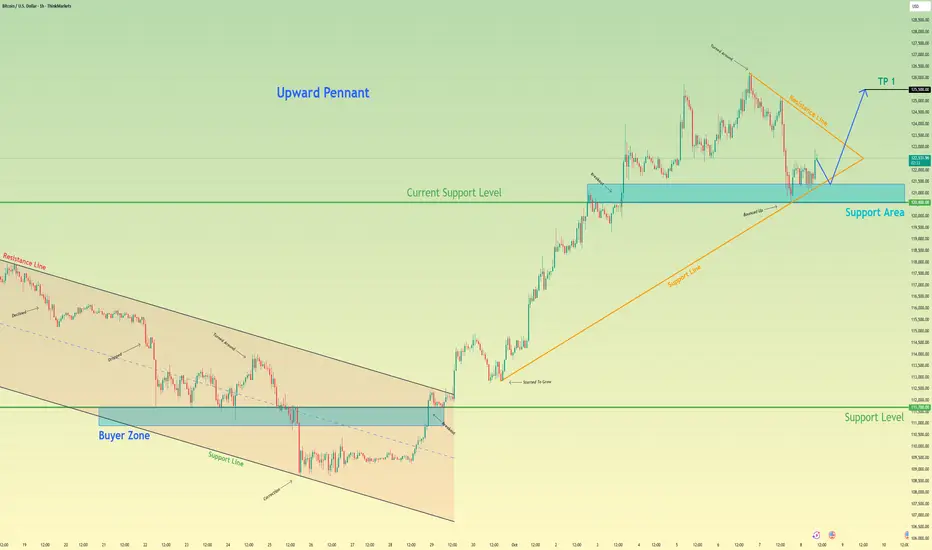
Bitcoin will Bounce From Pennant Support and Rally HigherHello traders, I want share with you my opinion about Bitcoin. The market structure for Bitcoin has recently undergone a major transition from bearish to bullish, following a decisive reversal from the 111700 support level. This shift triggered a breakout from the previous descending channel and gave rise to a new upward pennant pattern, a clear signal of strengthening bullish sentiment. After setting a new all-time high around 126000, BTC has entered a short-term corrective phase, retracing toward the 120600 area, which coincides with both the pennant’s ascending support line and a key horizontal support zone. To me, this pullback looks like a textbook healthy correction within an ongoing uptrend, allowing the market to consolidate before the next move higher. I anticipate that buyers will step in around this level, defending the support and initiating a strong rebound. If the price holds and bounces off the pennant’s support line, it could trigger a bullish breakout, resuming the upward momentum. Based on this outlook, my TP target remains set at 125500. Please share this idea with your friends and click Boost 🚀
Disclaimer: As part of ThinkMarkets’ Influencer Program, I am sponsored to share and publish their charts in my analysis.
BTCUSD Long: Small Correction and Pump to new ATHHello, traders! The prior market structure for BTCUSD saw a powerful breakout from an ascending channel, which propelled the price to a new all-time high of 125600. Following this peak, the market has entered a new consolidation phase, forming a high-level range between the new ATH and the key support area around the 120400 level.
Currently, the price is in a corrective phase within this new range. After an initial drop from the highs and a minor bounce, the auction is heading back towards the major support zone located around the 120400 level for what I believe will be a decisive test of buyer strength.
My scenario for the development of events is a successful re-accumulation within this range. I believe the price will complete its correction down to the 120400 support zone. In my opinion, a confirmed bounce from this area will signal the end of the pullback and trigger the next impulsive wave higher, breaking the top of the range. The take-profit is therefore set at 125700, targeting a new ATH. Manage your risk!

EURUSD Short: Trend Continuation to 1.1525 pointsHello, traders! The prior market structure for EURUSD has shifted to a bearish bias. This occurred after a failed breakout above the 1.1800 resistance level, which concluded a prior ascending channel. The subsequent reversal established the current descending channel, which has been guiding the price auction lower through a series of lower highs and lower lows.
Currently, the price action has confirmed its weakness by breaking below the key horizontal support at the 1.1645 level. After some consolidation below this level, the auction is now making a corrective pullback. This price action is setting up a classic retest of the broken support as new resistance, which is a critical point for the market.
My scenario for the development of events is a continuation of the downtrend. I believe this rally is a corrective retest that will fail upon reaching the 1.1645 resistance level. In my opinion, a confirmed rejection from this area will validate the bearish control and trigger the next impulsive move down. The take-profit is therefore set at 1.1525. Manage your risk.
USOIL: Price breaks out of sideways – sell on pullbackTo better understand my current outlook on USOIL, please refer to my previous higher-timeframe and fundamental analyses.
This could be a position trade in anticipation of a larger downtrend on the daily timeframe, but there's risk involved due to the upcoming Non-Farm Payrolls (NFP) report this Friday.
* Trend: assessed using at least three trend indicators, with market structure as the primary guide.
** Weak or Reversal Signals: Assessed based on one of our criteria for trend reversal signals.
*** Support/Resistance: Selected from multiple factors – static (Swing High, Swing Low, etc.), dynamic (EMA, MA, etc.), psychological (Fibonacci, RSI, etc.) – and determined based on the trader’s discretion.
**** Our advice takes into account all factors, including both fundamental and technical analysis. It is not intended as a profit target. We hope it can serve as a reference to help you trade more effectively. This advice is for informational purposes only and we assume no responsibility for any trading results based on it.
Please like and comment below to support our traders. Your reactions will motivate us to do more analysis in the future 🙏✨
George Vann @ ZuperView
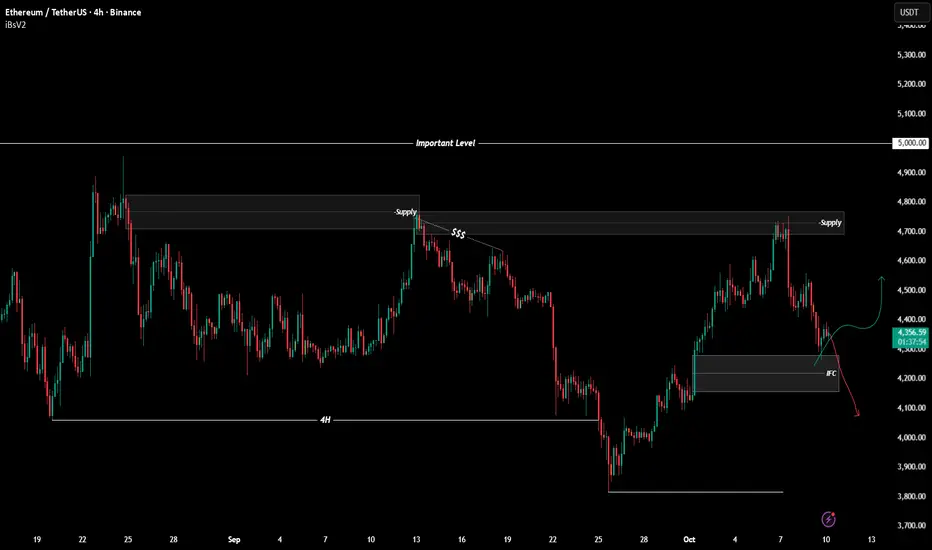
$ETHUSDT Analysis - Oct 10 | 4H Time FrameBINANCE:ETHUSDT Analysis - 4H
Hello and welcome to another analysis from the Satoshi Frame team!
I’m Abolfazl, and today we’re going to analyze Ethereum on the 4-hour timeframe.
After rejecting from the supply zone, Ethereum has reached an IFC, which could cause a price pullback.
On the 15-minute timeframe, look for confirmation signals to enter a long position — the first target is around $4,520, followed by $4,750.
Keep in mind that this setup is very risky, and no entry should be taken without proper confirmation.
The second scenario is a break below $4,200, which could provide a short opportunity targeting $3,950, and then the 4H low. (The break must be confirmed by a full candle close, not just a shadow.)
These scenarios allow you to align with price movement in both directions — the key is to wait for precise confirmations before entering any trade.
See you in the next analyses!
Stay tuned with the Satoshi Frame team...
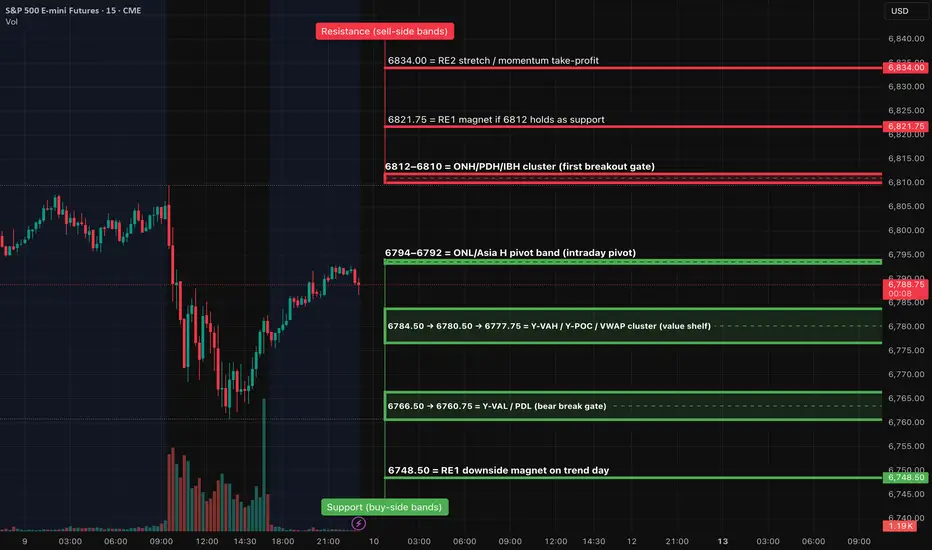
ES (SPX, SPY) Analyses, Key Zones, Setups Fri (Oct 10)Session Roadmap (London → NY)
London (02:00–05:00 ET): Expect balance 6792–6807. A sustained London hold above 6802–6805 increases odds of a pre-NY probe into 6809–6812. A London slip below 6784.5 shifts risk to a VWAP check 6777–6780 and potentially 6766–6761 into NY AM.
NY AM (09:30–11:00): Two-way opening likely unless 6812 converts rapidly; watch 9:45–10:05 for the sentiment print impulse.
NY PM (13:30–16:00): If morning sets a trend, expect continuation toward RE1/RE2; otherwise back-to-value rotations inside 6780–6795.
TIER-1 (A++) — Breakout LONG above PDH/ONH
Trigger: 15m full-body close above 6810–6812, then a 5m hold/re-close with HLs.
Entry: 6810.75–6812.25 on the first clean retest/hold.
Invalidation (hard SL): 6804.75 (below retest & today’s open region).
TPs: TP1 6821.75 (RE1), TP2 6834.00, TP3 6841.25.
TIER-1 (A++) — Breakdown SHORT through Y-VAL/PDL
Trigger: 15m full-body close below 6766.5 and then 6760.75, with a 5m retest 6764–6766 that fails.
Entry: 6764.00–6766.00 on the rejection.
Invalidation (hard SL): 6772.50 (back above value shelf).
TPs: TP1 6748.50, TP2 6736.50, TP3 6729.00.
TIER-2 (A+ Bounce) — Quick-reclaim LONG at Value Shelf
Trigger: Fast flush into 6777–6780 with a 1m reclaim of 6780.5 and 5m re-close above.
Entry: 6778.00–6780.50 after the reclaim.
SL: 6771.25.
TPs: TP1 6792.75 (Asia H pivot), TP2 6805.50 (today’s open/nearby shelf), runner eye 6810–6812 if momentum.
TIER-3 (A Bounce) — Exhaustion-flush LONG at PDL
Trigger: Liquidity sweep 6758–6752 that reclaims 6761 on 1m and 5m holds.
Entry: 6754–6756 on the reclaim.
SL: 6750.75.
TPs: TP1 6777.75 (VWAP), TP2 6789–6792 (pivot band).
===
Price-Path Scenarios (most to least likely)
Balance → Break Probe: Early churn inside 6792–6807; successful lift through 6810–6812 post-10:00 unlocks 6821.75 (RE1).
Fade to Value: Early rejection at 6809–6812 leads to a drift back into 6784/80 → 6777.75; buyers defend value and keep the range intact.
Bear Extension (data-shock needed): Clean 15m close below 6766.5/6760.75 opens 6748.50 with potential follow-through to 6736.50.
Fundamental Market Analysis for October 09, 2025 GBPUSDSterling hovers near 1.34, but the fundamental balance of forces favors the dollar. Market participants compare potential slowing in US activity with risks in the UK: budget concerns, pressure on household spending, and the Bank of England’s cautious stance. In the absence of new, strong pro-GBP drivers, short-term demand for USD persists.
The US side adds support to the dollar via steady demand for safe assets and expectations of an imminent Fed decision later in October. Even if a moderate rate cut materializes, the desynchronization in the pace of easing between the Fed and the BoE offers the pound few advantages, especially as UK inflation remains above target and tempers confidence in rapid borrowing-cost reductions in Britain.
Net-net, the fundamental backdrop argues for a moderate pullback in GBPUSD. Any short-lived risk-on bursts look fragile: as US newsflow strengthens and dollar inflows continue, upside breakouts in the pound appear limited.
Trade recommendation: SELL 1.34150, SL 1.34950, TP 1.33000

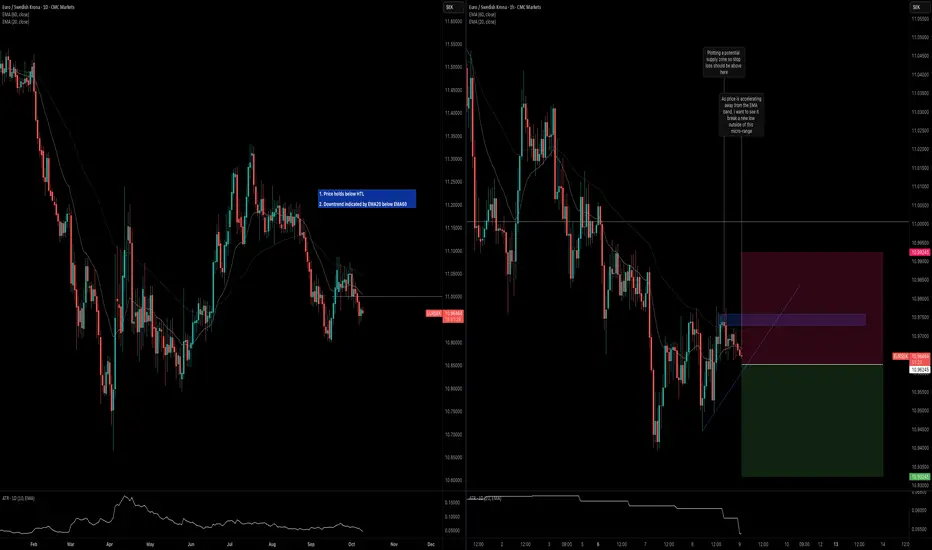
EURSEK: Trend ContinuationKey observations on the daily and H1 timeframes below.
Daily Timeframe:
Price is holding below HTL
Downtrend is indicated by EMA20 below EMA60
H1 Timeframe:
Price is accelerating away from EMA band
Sell stop set to enter when price breaks out of the micro-range