EURUSD Liquidity Sweep And Potential Demand ReactionQuick Summary
EURUSD may move lower to break the previous low at 1.16699 This move would act as a liquidity sweep and a possible reaction is expected from the orderblock at 1.16486
This area represents strong demand and could offer a buying opportunity if a clear reversal signal appears
Full Analysis
There is a strong probability that EURUSD continues its downside move to break the previous low formed at 1.16699
This type of movement is typically designed to sweep sell side liquidity resting below that level
After this liquidity sweep price may find support at the next orderblock around 1.16486
This zone is considered a strong demand area where buying interest could step in
If price reaches this level and shows a clear reversal signal it would provide a strong indication for potential long positions
The reaction from this zone will be crucial in determining whether the move lower was simply a liquidity grab or the start of a deeper decline
Until a reversal signal appears patience is required
The focus remains on observing how price behaves after the liquidity sweep and whether demand is strong enough to push the market higher
Analysis

ETH at Major Support After Distribution BreakdownOn the H1 chart, Ethereum has clearly completed a distribution → markdown cycle after failing at the upper boundary of the accumulation range around 3,330–3,380. The sharp bearish impulse that followed confirms that the prior sideways structure was not continuation, but distribution. Once price broke below 3,286, selling pressure accelerated and ETH transitioned into a clean bearish trend, with the EMA rolling over and acting as consistent dynamic resistance.
After the initial breakdown, price paused briefly inside the sideway zone near 3,180–3,230, but this consolidation failed to attract meaningful demand. The loss of 3,180 acted as confirmation of trend continuation, leading to another impulsive leg down that drove price directly into the higher-timeframe support range around 2,900–2,950. The speed and structure of this move strongly suggest liquidation-driven selling rather than healthy pullbacks.
At current levels, ETH is reacting off major support, and the slowdown in downside momentum indicates sell-side exhaustion. This makes a technical rebound highly plausible, especially after such an extended impulsive decline. Structurally, a corrective bounce toward 3,020–3,050 is reasonable, with a deeper retracement potentially targeting the prior breakdown area around 3,150–3,180, which now represents the most important resistance cluster.
However, it is critical to frame this move correctly: any upside from here remains corrective unless proven otherwise. As long as price stays below 3,180–3,230, ETH remains in a bearish short-term structure. Only a sustained reclaim and acceptance back inside the former sideways zone would invalidate the distribution thesis and signal a potential trend shift.
In summary, Ethereum is currently in a relief-rally phase after a completed markdown, reacting at a strong support range. A bounce is technically justified, but until former support is reclaimed, this should be treated as a sell-the-rally environment, not a confirmed bullish reversal.

Continuously setting new ATH records, getting closer to the 50001️⃣ Trendline
Primary trend: BULLISH
Price is still moving within a long-term ascending channel.
The most recent move broke the short-term rising trendline → this signals a technical correction, not a trend reversal, as the major trendline remains intact.
2️⃣ Resistance
5,000 – 5,005: Strong resistance (channel top + distribution zone).
→ Profit-taking pressure is likely to appear. A clear break & close above this zone is required to confirm further upside.
3️⃣ Support
4,888 – 4,890: Near-term support (pullback area to the channel trendline).
4,840 – 4,845: Strong support (correction low + demand zone).
→ If this zone holds, the bullish trend remains valid.
4️⃣ Main Scenarios
Preferred scenario: Pullback into support → bullish reaction in line with the trend.
Risk scenario: A break below 4,840 → bullish structure weakens, market may shift into short-term consolidation or bearish movement.
📈 Trading Plan
BUY GOLD: 4,888 – 4,890
Stop Loss: 4,880
Take Profit: 100 – 300 – 500 pips
SELL GOLD: 5,000 – 5,002
Stop Loss: 5,010
Take Profit: 100 – 300 – 500 pips

Breakout Reaction Completed, Market Now At Decision PointOn the H4 timeframe, EURUSD has just delivered a clean bullish break from the prior consolidation, marked by a strong impulsive candle that displaced price above multiple intraday resistance levels. This move represents a short-term structure break, shifting momentum bullish after an extended downtrend. However, the market has not confirmed continuation yet instead, price is pulling back and retesting the 1.1665–1.1600 support zone, which now acts as the key decision area. From a structure perspective, this is a classic breakout → pullback scenario. If price holds above the support zone and forms higher lows, the pullback should be read as healthy absorption, opening the path for continuation toward 1.1725 → 1.1790 → 1.1808 (prior HTF liquidity and resistance). In this case, the earlier downtrend would be considered temporarily neutralized.
Conversely, failure to hold the support zone — especially a clean acceptance back below 1.1600 would invalidate the breakout and confirm the move as a liquidity grab / false break, exposing EURUSD to renewed downside pressure and continuation of the broader bearish structure.
In summary: bullish momentum has appeared, but confirmation is not complete. This is a wait for reaction zone, not a chase zone. Direction will be decided by whether buyers can successfully defend the reclaimed support.

USD/JPY(20260123)Today's AnalysisMarket News:
According to data released Thursday, U.S. gross domestic product (GDP), an inflation-adjusted measure of the value of goods and services produced, grew at an annualized rate of 4.4% in the third quarter of last year, the fastest pace in two years.
The report shows that this is one of the two strongest consecutive quarters of growth since the U.S. economy was still in the recovery phase of the pandemic in 2021. After rushing to import goods at the beginning of the year to avoid the implementation of President Trump's comprehensive tariffs, businesses slowed their pace of imports. Despite the volatile trade policy, consumer and business spending remained robust.
With strong growth, a more solid job market, and inflation still above the Federal Reserve's target, the Federal Reserve is expected to keep interest rates unchanged at its meeting next week.
Technical Analysis:
Today's Buy/Sell Threshold:
158.48
Support and Resistance Levels:
159.19
158.92
158.75
158.21
158.04
157.77
Trading Strategy:
Consider buying if the price breaks above 158.48, with a first target price of 158.75.
Consider buying if the price breaks below 158.21, with a first target price of 158.04.

ATH Rejection or Just a Pause Before the $5,000 Run?On the Gold (XAUUSD) H1 chart, price is firmly holding a bullish market structure, despite the recent rejection from the ATH zone near 4,880–4,900. The prior move into ATH was a strong impulsive expansion, signaling aggressive institutional buying rather than a weak breakout. The pullback that followed is orderly and corrective, not impulsive a key distinction that keeps the bullish thesis intact.
Technically, price is now reacting inside a clearly defined support zone around 4,760–4,780, aligning closely with the rising short-term EMA (blue). This confluence suggests buyers are defending structure, absorbing sell pressure after the ATH liquidity sweep. The candles here show stabilization and higher lows, which is typical re-accumulation behavior after a strong markup leg.
As long as Gold continues to hold above this support zone, the broader bias remains continuation to the upside. A confirmed push back above 4,850–4,880 would signal that the pullback phase is complete and open the path toward new ATHs, with the higher-timeframe extension pointing toward the psychological $5,000 target.
This is not distribution it’s bullish digestion. Gold is consolidating above a major support after an ATH breakout. Hold above the current support zone keeps the trend bullish, and the next confirmed expansion could accelerate price into uncharted territory toward $5,000.

EURUSD Timeframe Conflict: Which direction is in play?Hi Traders!
EURUSD is trading at a higher-timeframe resistance near 1.18000. While monthly structure remains bullish, and may resemble a bullish flag, continuation has not yet been confirmed.
On the weekly timeframe, price seems to be in a range beneath resistance. Momentum has clearly slowed which puts price in consolidation rather than immediate continuation.
However, as I move down to the daily timeframe, the story may be different. With price failing to swing higher than 1.18000, a new bearish daily CHOCH has formed with a new higher low. If the daily bearish CHOCH is true, I'm looking for price to reach around that area for a retest, and possibly continuing a deeper pullback before any higher-timeframe attempt.
In addition, with DXY taken into consideration, it looks to me that price is attempting to make a double bottom on the weekly without a clear close below 97.500. This to me can seem like price may take another attempt at 100.000. Therefore, if the daily bullish CHOCH that was created is true, I am looking for a retest around 98.850 with signs of continuation.
A swing trade on EURUSD could be in play if my confirmations align. But for now, alerts are set near the bearish daily CHOCH, and DXY's bullish CHOCH.
If you've read this far, thank you! Leave a comment on what you think is possible!
*DISCLAIMER: I am not a financial advisor. The ideas and trades I take on my page are for educational and entertainment purposes only. I'm just showing you guys how I trade. Remember, trading of any kind involves risk. Your investments are solely your responsibility and not mine.*

TheGrove | GBPCAD SELL | Idea Trading AnalysisGBPCAD broke down sharply from the rising channel, confirming a bearish. the impulsive sell-off invalidated prior bullish structure and pushed price below key intraday supports.
GBPCAD is moving on Resistance area..
The chart is above the support level, which has already become a reversal point twice.
We expect a decline in the channel after testing the current level.
We expect a decline in the channel after testing the current level
Hello Traders, here is the full analysis.
I think we can soon see more fall from this range! GOOD LUCK! Great SELL opportunity GBPCAD
I still did my best and this is the most likely count for me at the moment.
-------------------
Traders, if you liked this idea or if you have your own opinion about it, write in the comments. I will be glad ⚜️

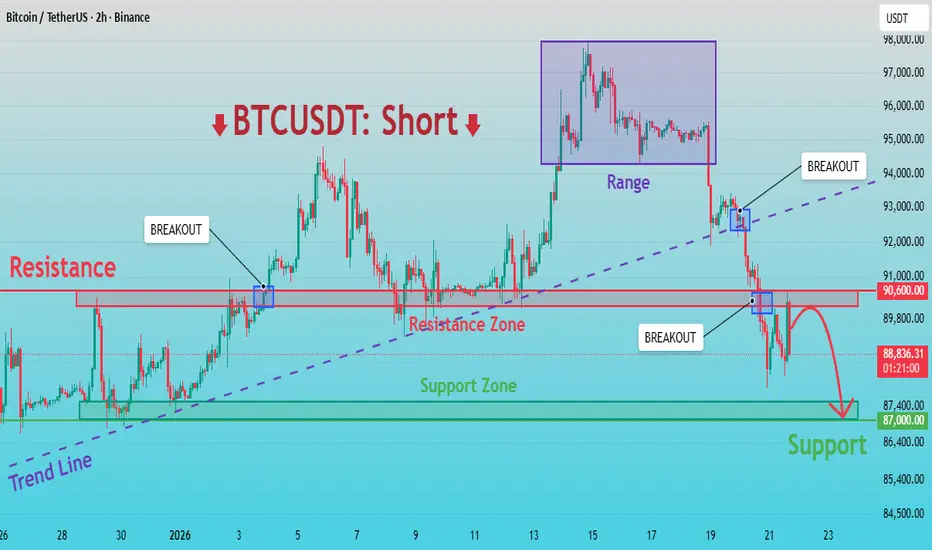
BTCUSDT: Breakdown Confirmed – Sellers in Control, Target to 87KHello everyone, here is my breakdown of the current BTCUSDT setup.
Market Analysis
BTCUSDT previously traded within a bullish structure, supported by a well-defined ascending trend line that reflected strong buyer control. After an impulsive upward move, price formed a consolidation range near the highs, indicating a temporary balance between buyers and sellers. Eventually, BTC failed to continue higher and broke down from the range, which became the first sign of weakening bullish momentum. This was followed by a decisive break below the ascending trend line, confirming a structural shift in favor of sellers. Subsequent recovery attempts were capped by a clearly defined Resistance Zone around 90,600, where multiple breakout attempts failed, signaling strong selling pressure.
Currently, BTCUSDT is trading below the resistance zone, forming lower highs and maintaining a bearish market structure. Upward moves appear corrective rather than impulsive, reinforcing seller dominance. Below the current price, a Support Zone near 87,000 stands as the next key area where buyers may attempt to slow the decline.
My Scenario & Strategy
My primary scenario remains bearish as long as BTCUSDT stays below the 90,600 resistance zone and does not reclaim the broken trend line. Any pullbacks into resistance that show rejection may be considered potential short opportunities. The main downside target is the 87,000 support zone, where price could react or temporarily consolidate.
However, a clean break and sustained acceptance above 90,600 would invalidate the bearish bias and suggest a possible transition back into consolidation or recovery. For now, market structure and momentum clearly favor sellers.
That's the setup I'm tracking. Thank you for your attention, and always manage your risk.
EURUSD: A Pullback to 1.1680 is Planned Before Further GrowthHello everyone, here is my breakdown of the current EURUSD setup.
Market Analysis
EURUSD previously traded within a well-defined upward channel, confirming a bullish recovery phase with higher highs and higher lows. During this advance, price respected the rising support line and produced several breakout attempts, showing strong buyer control at that stage. However, as the pair approached the upper boundary of the structure and the broader Resistance Zone around 1.1735–1.1740, bullish momentum began to weaken. Near this resistance area, EURUSD formed multiple fake breakouts, signaling seller absorption and exhaustion at the highs. Price failed to achieve acceptance above resistance and subsequently lost upward momentum. This failure marked a structural shift, as EURUSD broke below the rising channel support and transitioned into a clearly defined descending channel. From that point, price started forming lower highs and lower lows, confirming that sellers have taken control in the short to medium term. After the breakdown, EURUSD continued to respect the downward channel, with pullbacks acting as corrective moves rather than impulsive bullish legs.
Currently, price broke above the short-term descending channel support, triggering a corrective bounce. This move, however, appears to be a retracement into prior resistance, not a trend reversal. The current rally is testing the Resistance Zone near 1.1735–1.1740, which also aligns with previous support turned resistance and the upper boundary of the bearish structure. On the downside, a key Support Zone / Buyer Zone around 1.1680 remains critical. This level has acted as a reaction area multiple times and represents the next downside objective if sellers regain control.
My Scenario & Strategy
My primary scenario remains bearish as long as EURUSD stays below the 1.1735–1.1740 Resistance Zone and fails to gain acceptance above it. I expect sellers to defend this area and push price back toward the 1.1680 Support Zone (TP1). A clean rejection from resistance would confirm continuation within the broader bearish structure. If price breaks and holds below 1.1680, it would open the door for a deeper bearish continuation toward lower support levels.
However, a strong bullish breakout and acceptance above 1.1740 would invalidate the short setup and suggest a shift back toward consolidation or renewed bullish recovery. For now, the market structure favors sellers, and the current move looks corrective within a broader bearish phase.
That’s the setup I’m tracking. Thank you for your attention, and always manage your risk.

EURUSD Stalls at the Top — Accumulation Turning DistributionOn the EURUSD H1 chart, price has transitioned from a strong impulsive rally into a tight accumulation range just below 1.1740, directly under a key resistance area and near the EMA 89. The initial upside move was aggressive and momentum-driven, but once price entered this range, bullish follow through stalled. Candles became overlapping, wicks increased, and upside extensions failed classic signs that buyers are no longer in control, and the market is absorbing liquidity rather than expanding. Structurally, this accumulation is occurring after an impulsive move, which shifts its context from bullish consolidation to potential distribution. The highlighted breakdown from the lower boundary of the range is critical: a clean acceptance below this level would confirm that the range was used to build short positions, not prepare for continuation. From there, the projected path favors a pullback–continuation sequence lower, with price likely to seek liquidity first around 1.1688, then deeper into the 1.1660–1.1630 demand zone, where prior imbalance and EMA support align. As long as price remains capped below the upper range highs and fails to reclaim the accumulation floor, the bias remains bearish continuation, not a healthy correction. Any bounce from minor levels should be treated as corrective, unless EURUSD can reclaim and hold above the range with strong acceptance something that is currently absent. This is no longer a bullish structure. EURUSD is showing post-rally distribution behavior, and a confirmed break from the accumulation range opens the door for a measured sell off toward the lower demand zone before any meaningful bullish reassessment.

EURUSD Short Term Pullback ZoneQuick Summary
EURUSD rallied strongly at the start of the week and broke the H4 bearish trendline
A short term continuation higher is possible and the Price may reach the orderblock at 1.17215
This level will only be considered for sells if a clear rejection appears.
Full Analysis
Following the strong bullish move at the beginning of the week EURUSD managed to break the bearish trendline on the four hour timeframe
This break opens the door for a brief continuation to the upside before any further downside attempt
Price is expected to extend higher toward the orderblock around 1.17215
This area represents a potential reaction zone where the market may decide its next direction
The move toward this level is viewed as short term continuation rather than a full trend shift
For that reason sell positions should only be considered if price shows a clear rejection signal from this zone
Without strong bearish confirmation the level should not be traded blindly
Only a clear rejection would validate this area as a continuation point for the broader bearish direction

EURUSD Liquidity Driven DownsideQuick Summary
EURUSD remains under a bearish view
After a strong rally that created a liquidity void price has started to move lower and The market is expected to fill this liquidity void and continue toward the low at 1.16324
This level represents a liquidity target and aligns with a retest of the broken bearish trendline
Full Analysis
In continuation of the bearish outlook EURUSD recently pushed higher aggressively which resulted in the creation of a clear liquidity void
Following that move price has now started to decline in order to rebalance this inefficiency
The expectation is for price to fully fill the liquidity void and then continue lower toward the low at 1.16324
This low represents a strong liquidity target as such levels are often revisited after liquidity voids created.
This type of structure where a liquidity void is followed by a nearby liquidity low is commonly targeted by the market
The probability increases further as this potential sweep also aligns with a retest of the previously broken bearish trendline
As long as price remains below the recent high the downside scenario stays valid
The focus remains on watching price behavior as it approaches the 1.16324 level and monitoring the reaction around the trendline retest

Fundamental Market Analysis for January 22, 2026 GBPUSDGBP/USD is trading near 1.34300 on January 22, 2026. The backdrop for sterling is mixed: UK inflation in December rose to 3.4%, and services inflation to 4.5%, making the market more cautious about pricing in rapid Bank of England rate cuts. However, weak economic growth and a cooling labor market keep expectations in place that the 3.75% rate will be reduced further over time.
On the US side, the dollar is supported by higher interest rates: the Fed’s target range is 3.50–3.75%, and the regulator is tying future decisions to incoming data. Today’s key releases include growth and inflation figures, as well as weekly jobless claims. If the reports confirm resilient demand and a gradual easing of inflation pressure, demand for the dollar may strengthen.
External trade headlines between the US and Europe remain a source of short-term volatility and affect investors’ appetite for risk. On such days, sterling tends to be vulnerable as market participants prefer to rotate into more liquid assets and currencies with a clearer yield advantage. If the dollar remains supported, the base-case scenario is pressure on GBP/USD and a move lower from current levels.
Trade recommendation: SELL 1.34300, SL 1.34500, TP 1.33500

BTC at a Decision Point — Relief Bounce or Lower High?On the BTCUSD H1 chart, price remains firmly in a short-term bearish structure following the sharp impulsive sell off from the 95,000 region. The breakdown from the prior consolidation occurred with strong momentum, slicing cleanly below the EMA and confirming a shift from balance to markdown. Since then, Bitcoin has been trading beneath a well-defined resistance zone around 93,200–93,500, where previous support has now flipped into supply a classic bearish market behavior.
The recent reaction from the support zone near 88,000–88,500 is technically a relief bounce, not a reversal. Structurally, the bounce is corrective: price is forming overlapping candles and shallow pullbacks, suggesting short covering rather than aggressive new demand. As long as BTC remains capped below 89,900–91,200, the probability favors a lower high forming before sellers reassert control.
If buyers can hold above the support zone and reclaim 89,900, a deeper corrective move toward 91,200–91,500 is possible, where the EMA and prior intraday structure align. However, this zone is expected to act as sell side re entry, not a breakout level. Failure to build acceptance above that area would likely trigger another leg down, reopening downside liquidity toward the lower 88,000 region and potentially below if support weakens.
Bitcoin is currently in a bearish retracement phase inside a broader intraday downtrend. The support zone is holding for now, but without a strong structural reclaim, upside moves should be treated as corrective pullbacks into resistance. Until BTC decisively breaks and holds above the resistance zone, risk remains skewed to the downside, with sellers still controlling market structure.

EURUSD Is Stalling at Supply — Distribution Pressure Is Quietly On the EURUSD H1 chart, price has completed a sharp impulsive rally and is now stalling directly inside a well-defined resistance zone, where upside momentum has clearly weakened. After the vertical push, the market failed to extend higher and instead transitioned into a tight sideways range, signaling acceptance rather than continuation. Candles inside this zone are overlapping, with repeated rejections near the upper boundary a classic sign of distribution, not consolidation for another leg up.
Structurally, this sideways behavior after an impulse suggests buyers are losing control, while sellers are gradually absorbing liquidity at premium prices. As long as price remains capped below resistance, the bias favors a range breakdown scenario. A clean loss of the lower boundary of the sideways zone would likely trigger a controlled bearish expansion, targeting the next liquidity pocket below, followed by a deeper continuation toward the lower demand region where profit-taking becomes logical.
This is no longer a breakout environment. EURUSD is in a sell-high, patience-required phase. Failure to reclaim and hold above resistance keeps the path of least resistance to the downside, with rallies into the zone serving as opportunities for distribution rather than continuation.

Will there be a correction today, January 22nd, 2026?1️⃣ Trendline
Main trend: BULLISH.
Price is still holding above the long-term ascending trendline → the Higher High – Higher Low structure remains intact.
The current move is a pullback / consolidation after a strong rally, with no confirmed trend reversal yet.
2️⃣ Resistance
4,855 – 4,888: Strong resistance zone (previous high + distribution area).
→ Profit-taking and false breakouts are likely in this zone.
→ Bullish continuation only if price breaks and closes clearly above 4,888.
3️⃣ Support
Ascending trendline: Key dynamic support, focus on price reaction here.
4,755: Strong support (structural low + demand zone).
→ Losing this level would break the short-term bullish structure, increasing the risk of a deeper correction.
4️⃣ Main Scenarios
Primary scenario: Price pulls back to the trendline → holds → rebounds to retest resistance.
Risk scenario: Break below the trendline and lose 4,755 → market shifts to sideways or short-term bearish.
👉 Strategy: Look for trend-following buys at support, avoid FOMO entries at resistance.
📈 Trade Plan
BUY GOLD: 4,755 – 4,757
Stop Loss: 4,747
Take Profit: 100 – 300 – 500 pips
SELL GOLD: 4,854 – 4,856
Stop Loss: 4,866
Take Profit: 100 – 300 – 500 pips

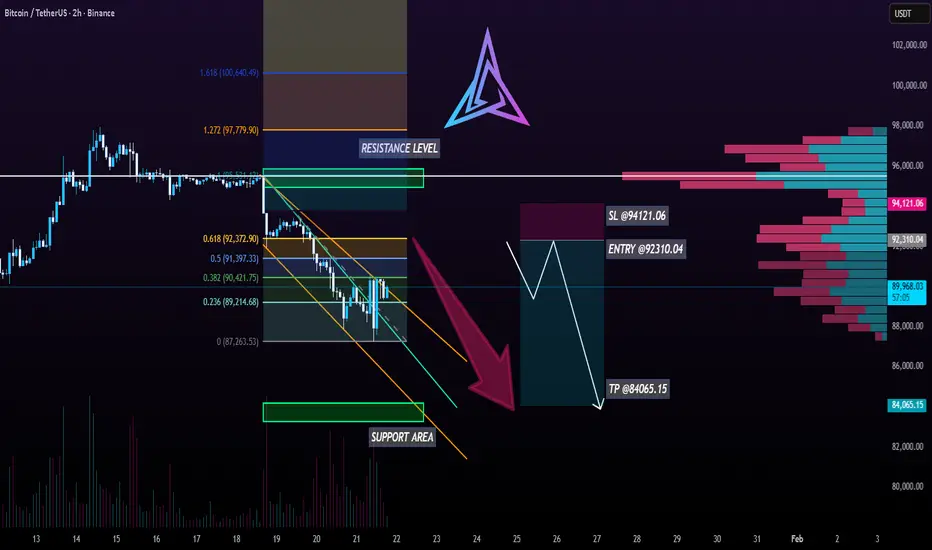
BTCUSDT 2H | Rejected at 0.382 Fib – Bearish ContinuationHello everyone,
BTC 2H chart shows clear rejection at 0.382 Fib retracement ($90,421) after brief rally attempt. Price now back below it (~$89,987 area), maintaining the descending channel structure with lower highs intact.
Key Technicals:
📌 Fibonacci Retracement (Swing High ~$95.5k → Low $87.3k):
0.236 broken, 0.382 rejected multiple times → strong overhead resistance.
📌 Next barriers: 0.5 ($91,397), 0.618 ($92,372).
📌 Descending Channel: Upper trendline capping rallies, lower highs pattern holding.
📌 VRVP: Heavy selling supply stacked $90k–$96k (dominant pink/red bars) → exhaustion on up moves.
Bearish Confluences:
✅ Multiple rejections at Fib + channel resistance despite momentum attempts.
✅ Low-volume zone = increased volatility risk on downside.
✅ Overhead supply from VRVP confirms selling pressure dominant.
SHORT Setup (High-Probability Wait):
Entry: ~$92,310 (confirmed rejection at 0.618 Fib $92,372) – look for long upper wicks, declining volume on approach.
SL: $94,121 (above key resistance) – Risk ~1.962%.
TP Range: $84,065 (1.272 to 1.618 Fib extension confluence + psychological support zone).
Why Wait for Confirmation?
Patience for rejection at resistance → tighter stop, higher probability. No clear signal = no trade.Invalidation: Clean close above $94,121 + volume breakout → bullish flip, reassess higher.
Monitoring next 24–48h for rally to $92k rejection or direct breakdown below $89k. Technical structure holds priority.
DISCLAIMER
Educational analysis documenting my trading process. Not financial advice. Crypto markets are volatile. Use proper risk management. Trade at your own risk!
XAUUSD Long: Uptrend Holds as Price Respects Rising Trend LineHello traders! Here’s a clear technical breakdown of XAUUSD (1H) based on the current chart structure. Gold is trading within a well-defined bullish structure after forming a clear pivot low earlier on the chart. From this pivot point, a rising trend line has been established, highlighting consistent buyer participation and a gradual shift in market control toward the upside. This trend line has been respected multiple times, confirming it as a key dynamic support guiding the bullish move. Following the pivot, price advanced and broke above a descending supply line, signaling a structural change from corrective pressure to bullish continuation. This breakout was impulsive, indicating strong demand entering the market. After the breakout, XAUUSD transitioned into a consolidation range, where price moved sideways as buyers and sellers reached temporary equilibrium. This range acted as a continuation structure rather than distribution.
Currently, price eventually broke out of the range to the upside, confirming renewed bullish momentum. After the breakout, gold pulled back and successfully retested the former resistance area, which is now acting as a Demand Zone around 4,700. This retest appears corrective, not impulsive, suggesting healthy price action and continued buyer dominance rather than trend exhaustion. On the upside, the next key level is the Supply Zone near 4,770, where previous selling pressure is expected to reappear. The current structure shows higher highs and higher lows, and price remains firmly above both horizontal demand and the rising trend line, keeping the bullish bias intact.
My scenario: as long as XAUUSD holds above the 4,700 Demand Zone and continues to respect the ascending trend line, the bullish structure remains valid. I expect buyers to defend this area and potentially push price toward the 4,770 Supply Zone (TP1). A clean breakout and acceptance above this level would confirm further bullish continuation. However, a decisive breakdown below the demand zone and trend line would weaken the bullish bias and signal a deeper corrective move. For now, market structure clearly favors buyers. Manage your risk!

BTCUSDT Long: Rising Trend Line and Demand Supports Bullish BiasHello traders! Here’s a clear technical breakdown of BTCUSDT (2H) based on the current chart structure. Bitcoin is trading within a developing bullish structure after forming a clear pivot low, from which a rising trend line has been established. This trend line reflects increasing buyer participation and gradual strength returning to the market. Following the pivot, price moved higher and transitioned from consolidation into an impulsive bullish leg, confirming a structural shift. After the upside move, BTC reached a clearly defined Supply zone around 94,500, where selling pressure stepped in. This reaction led to a range formation just below supply, indicating temporary consolidation after the impulsive rally. This range reflects short-term equilibrium rather than a trend reversal, as price remains structurally supported.
Currently, BTC is reacting from a strong Demand zone around 91,900, which aligns closely with the rising trend line. This confluence between horizontal demand and dynamic support strengthens the level. The recent pullback into demand appears corrective rather than impulsive, suggesting that sellers are losing momentum and buyers continue to defend structure.
My scenario: as long as BTCUSDT holds above the 91,900 demand zone and respects the ascending trend line, the market structure remains bullish. A sustained reaction from demand could lead to another attempt toward the 94,500 supply zone, and a confirmed breakout above this level would open the door for further upside continuation. A decisive breakdown and acceptance below demand would invalidate the bullish bias and shift focus toward deeper corrective levels. For now, price remains compressed between demand and supply, with buyers maintaining structural control. Manage your risk!

Gold prices continue to set all-time highs (ATH).1️⃣ Trendline
Main trend: BULLISH
Price remains above the ascending trendline → the Higher High – Higher Low structure is still valid.
The current move is a consolidation / technical pullback, with no signs of a structural breakdown yet.
2️⃣ Resistance
4,900 – 4,905: Strong resistance (target peak + confluence with the upper trendline) → profit-taking pressure is likely.
Condition for continuation: A clear break and close above 4,900.
3️⃣ Support
4,816 – 4,814: Near-term support (consolidation / pullback zone).
4,766 – 4,768: Strong support (Higher Low + demand zone). Holding above this area keeps the bullish trend intact.
4️⃣ Main Scenario
Priority: BUY with the trend as long as price holds above 4,768, target 4,900.
Warning: A break below 4,766 increases the risk of a deeper correction and requires close price action monitoring.
Trading Plan
BUY GOLD: 4,816 – 4,814
Stop Loss: 4,804
Take Profit: 100 – 300 – 500 pips
SELL GOLD: 4,900 – 4,902
Stop Loss: 4,912
Take Profit: 100 – 300 – 500 pips

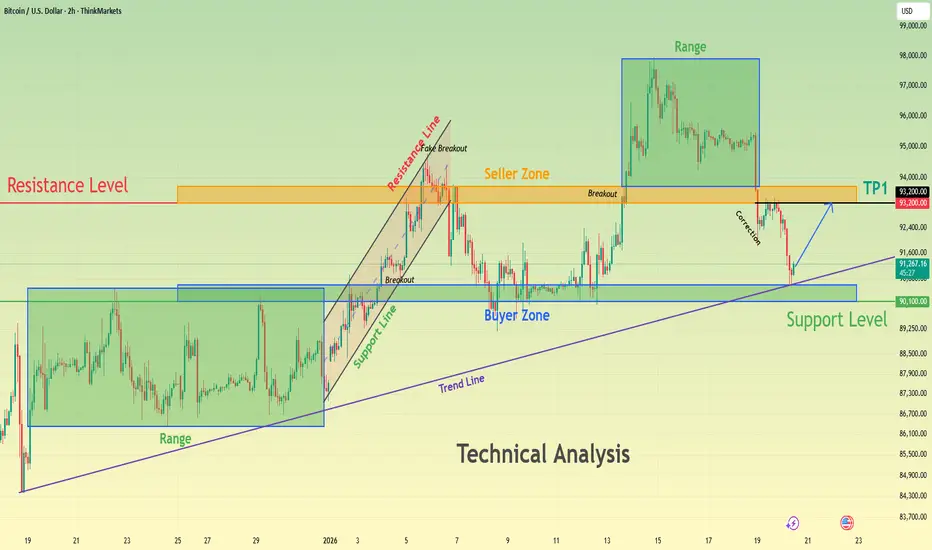
BTCUSD Holds Above Demand - Next Move Toward 93,200 ResistanceHello traders! Here’s my technical outlook on BTCUSD (2H) based on the current chart structure. Bitcoin is trading within a clear bullish environment after transitioning from a prolonged consolidation phase into an impulsive upward move. Earlier on the chart, price was moving inside a well-defined range, indicating balance between buyers and sellers and a period of accumulation. This range was eventually resolved to the upside, confirming a shift in market control in favor of buyers. Following the breakout, BTCUSD accelerated higher and successfully established acceptance above the former range highs. Currently, price is trading above the Support Level around the 90,100 area, which aligns with a clearly defined Buyer Zone and a previous structural level. This area is now acting as a key demand zone after the breakout and is reinforced by the rising trend line, strengthening its importance. The recent pullback into this support appears corrective rather than impulsive, suggesting healthy profit-taking instead of aggressive selling pressure. Buyers are actively defending this zone, keeping the bullish structure intact as long as price remains above support. If buyers continue to defend the 90,100 Buyer Zone, BTCUSD could resume its upward move toward the 93,200 Resistance Level, which serves as the next key objective. A clean continuation and acceptance above this resistance would confirm further upside momentum and open the door for continuation toward higher targets (TP1 and beyond). However, a decisive breakdown and acceptance below the support zone and rising trend line would signal a deeper correction and weaken the bullish setup. For now, the overall structure favors buyers while price respects support. Please share this idea with your friends and click Boost 🚀
GOLD – 4H | Bearish Divergence – Pullback or Continuation?Gold ( OANDA:XAUUSD ) remains in a broader uptrend on the 4H timeframe, printing higher highs and higher lows while respecting the ascending channel structure. However, recent price action suggests the upside momentum may be weakening near a key resistance zone at 4640.
Price is currently consolidating between 4640 and 4570, showing clear signs of accumulation. At the same time, a bearish divergence on RSI is visible, indicating declining momentum despite price holding near highs. This divergence aligns with a rising wedge formation, which often precedes corrective or reversal moves when it appears late in an uptrend.
From a structure perspective, the market is approaching a decision point.
A clean break and 4H close above the 4650 zone would invalidate the immediate bearish setup and could open the path toward the 4700 area.
On the downside, a 4H close below 4570, accompanied by a clear breakdown from the accumulation range, would confirm weakness and expose 4500, with room for further downside.
Adding to the confluence, the higher-timeframe structure also shows a bearish harmonic AB=CD pattern, reinforcing the idea of a potential pullback or corrective phase..
Fundamentally, gold remains strong overall, but from a technical standpoint, a pullback within the trend appears increasingly likely.
Watching price action closely for confirmation.
Bias remains short-term bearish unless invalidated.
