ETH Is Quietly Loading Up for Its Next Major Rally1. Current Market Structure (1H)
ETH continues to maintain a clean short-term uptrend with:
- Higher lows forming consistently → buyers remain in control.
- Price holding above EMA 34 → intraday bullish rhythm intact.
- EMA 89 sitting lower, confirming strong medium-term momentum.
- Demand zone 2280–2300 acting as the key intraday support.
- Liquidity resting below 2230–2250, potential draw if a pullback occurs.
Price action shows compression → energy buildup → preparing for the next expansion leg.
2. Macro Alignment
Macro conditions continue to support a bullish bias:
-DXY weakening → risk assets get a tailwind.
-US Treasury yields cooling → reduces pressure on crypto.
-Market pricing in earlier Fed cuts for 2025 → liquidity shifts toward risk-on assets.
-BTC and ETH correlation stays elevated → BTC strength fuels ETH upside.
Macro flow + technical structure both point to continuation of the upward cycle.
3️⃣ Current Structure (Right Range)
You marked SUPPORT ZONE & RESISTANCE ZONE.
ETH is repeating the same playbook:
- Long wick rejection into Support
- Price oscillates inside the range (liquidity creation)
- A breakout is likely to follow once enough orders are collected.
This is the third accumulation cycle — textbook bullish continuation.
🎯 TRADING SIGNAL
BUY SETUP
Entry Zone:
3310 – 3350 (Support Zone dips / liquidity sweeps)
Stop Loss:
Below support box: 3250
Take Profit:
Partial at 3450–3500
Full target at 3600+ (expected breakout continuation)
Why this works:
ETH has shown the exact pattern twice:
Range → Liquidity Sweep → Expansion.
Current price is building the third range — probability favors another upward expansion.
📈 SUMMARY:
ETH is not random it is systematically accumulating before each major pump.
As long as price holds the Support Zone and continues ranging, the bullish continuation scenario remains the highest-probability play.
Next Move:
– Bullish bias remains intact as long as ETH continues to hold above the channel’s support; reclaiming 3,440 would open momentum toward 3,520 and potentially the upper boundary. – ETH/USD (1H)
Analyze

Gold Is Setting a Trap — The Real Move Comes After the LiquidityMarket Analysis — XAUUSD (H1)
1. Current Price Structure
- The market previously created a series of Higher Highs (HH) and Higher Lows (HL) → bullish order flow.
- After the last HH, the price showed multiple CHoCH events → early signs of a shift from bullish to bearish structure.
- Current consolidation is forming around 4,207 – 4,210, with price struggling to regain bullish conviction.
- A rising dotted trendline represents the last support of short-term buyers — once broken, bearish momentum strengthens.
2. Liquidity Zones
- Upper liquidity zone: 4,225 – 4,230 → where you expect price to sweep before reversal.
- Key support: 4,181 – 4,183 → first downside liquidity zone.
- Major target liquidity zone: 4,163 – 4,165 → final liquidity cluster before deeper bearish continuation.
3. Today’s Primary Scenario
This matches the green projection drawn on your chart:
🔹 Main Scenario (Bearish Continuation After Liquidity Sweep)
Price is likely to:
- Push upward to retest the 4,225 zone → sweep liquidity and create a final LH.
- Reject strongly → break the rising trendline.
- Drop into 4,181 → first liquidity target.
- Minor pullback → forming a reactionary LH.
- Continue down toward 4,163 → completing the corrective leg.
This aligns perfectly with the market structure + liquidity logic in your chart.
4. Market Psychology
- Buyers are weakening: repeated CHoCH + BOS bearish signals.
- Liquidity is building above and below → ideal for manipulation before expansion.
- Narrow movement before news = accumulation phase.
- Smart money likely pushes up first, then aggressively sells into trapped buyers.
5. Intraday Strategy Guidance
📌 SELL Setup (High Probability)
Sell Zone: 4,225 – 4,228
TP1: 4,181
TP2: 4,165
SL: 4,232
This aligns perfectly with your chart projection.
📌 BUY Setup (Low Probability – Countertrend)
Buy Zone: 4,163 – 4,166
TP: 4,178 – 4,185
SL: 4,158
⚠️ Notes
• Recent BOS patterns favor continuation to the downside.
• Avoid chasing trades in the middle of liquidity zones
Stay patient — the market always pays those who wait for the right setup, not the fast setup.

Gold Is Preparing for a Deep Liquidity SweepMost traders chase the final push of wave (B) and get trapped right before the market reverses. When you understand wave structure + liquidity zones, you stop trading emotions and start trading precision.
📌 1. Market Structure
Gold has just completed a 5-wave impulsive structure (1 → 5) into the resistance zone.
Immediately after wave (5), price shifted into a corrective phase, forming leg (A) downward.
This is classic Elliott behavior: Impulsive (5 waves) → Corrective (ABC).
Current structure is entering wave (B) retracement before dropping into wave (C).
📌 2. Key Zones
Resistance Zone:
Price reacted strongly at the previous swing-high cluster where wave (5) completed — confirming heavy sell orders.
Support Zone:
The zone around wave (2) & (4) provided multiple rejections, but a break below (A) suggests this support is weakening.
Liquidity Zone (Target): 4128 – 4136
This is the major liquidity pocket where the market likely aims for a sweep during wave (C).
📌 3. Price Action
- Wave (A) formed with clear momentum down.
- Current upward leg into (B) shows weaker volume, typical of a corrective pullback.
- The projected path shows price retesting resistance before a deeper drop.
- Structure is no longer bullish — it’s transitioning into a corrective sequence.
- The dashed path is perfectly aligned with typical ABC behavior.
📌 4. Technical Confirmation
- Wave Theory: 5-wave impulse completed → ABC retracement is expected.
- Liquidity Map: Price has unfinished business at the 4128–4136 zone.
- Support Break: Wave (A) broke below the previous minor support, shifting short-term bias bearish.
- Resistance Rejection: Wave (B) is likely to fail at the previous top structure.
Everything aligns with a bearish continuation into wave (C).
📌 5. Trading Plan
🎯 SELL Setup (High probability)
Entry: 4,230 – 4,255 (top of wave B retracement)
Stop-Loss: 4,290 (above previous swing & invalidation of B)
Take Profit 1: 4,165
Take Profit 2: 4,140
Final Target: Liquidity 4128 – 4136 (wave C completion)
Why this setup is strong:
You are shorting into the end of wave B, which typically traps breakout buyers before wave C dumps sharply.

The Drop Is Done — Bitcoin Is Preparing to Bounce🔥 BTC/USD – 1H MARKET OUTLOOK
“BTC Correction Completed – Reversal Structure Forming!”
1. Market Structure Overview
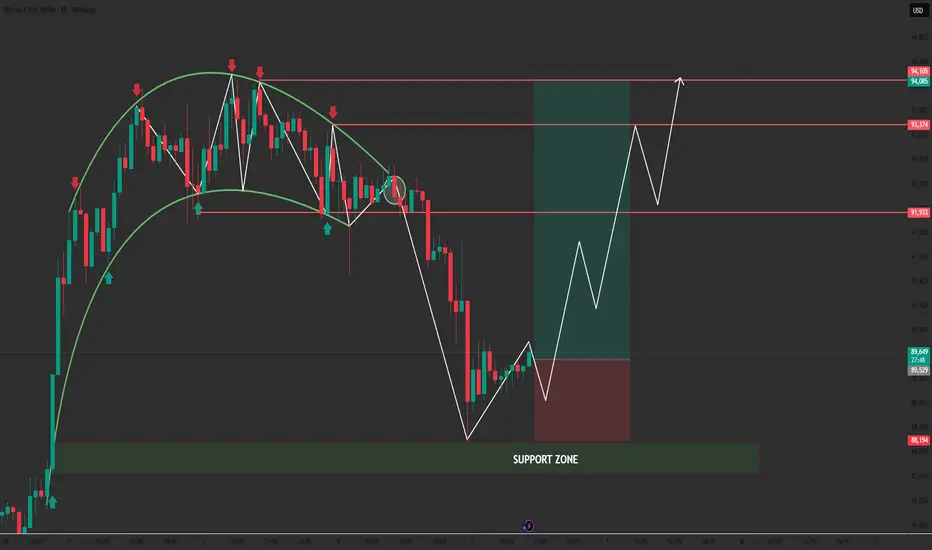
BTC has completed a full rounding-top structure followed by a sharp decline into the Support Zone.
After liquidity was swept below the recent swing low, price has formed a clean bullish reaction with a potential V-shape reversal pattern.
The market is now transitioning:
- From distribution ⟶ accumulation
- From downtrend leg ⟶ early-stage bullish structure
- Higher low formation is developing, validating the first signals of trend reversal.
This matches perfectly with your chart’s projection:
A rebound structure with higher highs & higher lows forming from support.
2. Key Zones
🔴 Resistance Zones
- 91,933 – First major resistance
- 93,374 – Liquidity zone
- 94,085 – 94,105 – Key upside target / breakout zone
- 94,523 – Final projected target
🟢 Support Zone: 88,194 – 88,800
This is the area where price reacted strongly, confirming buyer presence and liquidity sweep.
As long as BTC holds above the Support Zone, the upside scenario remains dominant.
3. Scenarios Ahead
🔹 Primary Bullish Scenario (High Probability)
BTC continues to respect the support area → develops a higher low → pushes upward following your projected path.
Expected steps:
- Small retracement
- Break of minor structure to the upside
- Momentum continuation targeting:
🎯 91,933
🎯 93,374
🎯 94,085 – 94,105
🎯 Final: 94,523
🔸 Alternative Scenario (Low Probability)
Only valid if price breaks & closes below 88,194:
→ BTC could revisit deeper liquidity around 87,000 – 86,500.
Currently, the chart shows no evidence favoring this scenario.
4. Intraday Trading Setups
📌 SETUP 1 – Intraday Buy (Main Setup)
BUY ZONE (Support Reaction):
👉 88,194 – 88,800
Take Profit:
🎯 91,933
🎯 93,374
🎯 94,085 – 94,105
🎯 Extended: 94,523
Stop Loss:
❎ Below 88,194
⚠️ Manage risk properly and avoid over-leverage during volatile swings.
5. Summary & Motivation
BTC is following the roadmap exactly as projected:
✔ Correct breakdown
✔ Correct liquidity sweep
✔ Correct reversal reaction
✔ Correct higher-low formation
✔ Correct bullish outlook from support
This structure shows the market is shifting from weakness to strength—and traders who stay disciplined will capture the next upside wave.
🔥 Keep your mindset sharp — every correction is an opportunity, not a threat. Stay focused, stay confident, and trade the structure, not the emotions.
EURUSD Is Coiling for a Breakout — The Next Push Could Be ExploZ1. Market Analysis
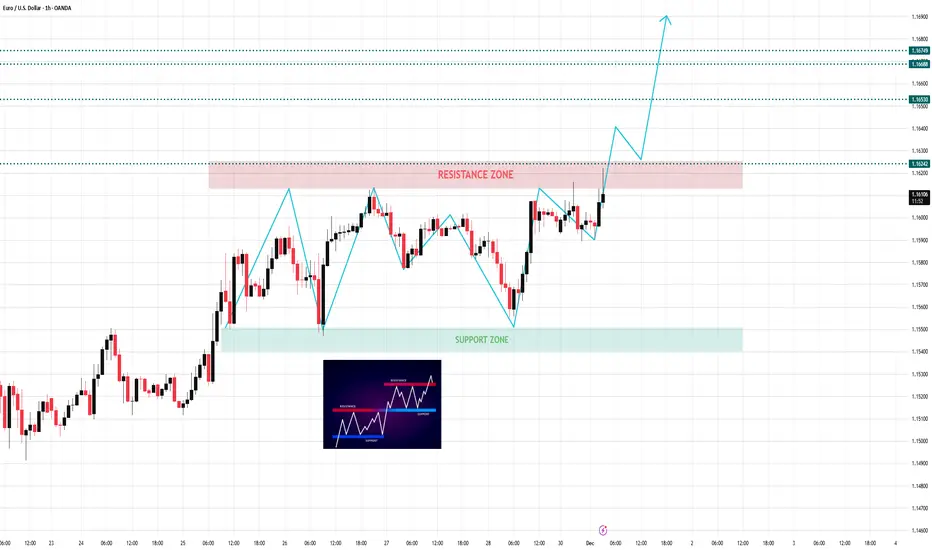
EURUSD is currently trading in a clean and well-defined structure, showing a gradual shift from consolidation to bullish momentum. Price has been oscillating between the Support Zone (1.1540–1.1550) and the Resistance Zone (1.1618–1.1624) , forming a sequence of Higher Highs and Higher Lows — a textbook bullish staircase pattern.
The support zone has acted as a strong demand region, rejecting price multiple times and building a foundation for continuation. Each test of resistance is becoming stronger, and the most recent bullish impulse shows increased momentum compared to previous swings. This indicates that buyers are gaining confidence as liquidity builds above the resistance line.
The current price action is also forming a Bullish Continuation Pattern, identical to the reference image at the center of your chart. This suggests accumulation below resistance before a potential breakout.
As long as EURUSD stays above the bullish micro-structure, sentiment continues to favor the upside.
2. Technical Structure Breakdown
Key Observations:
- Support Zone at 1.1540–1.1550 continues to hold strongly
- Multiple successful retests indicate strong buyer presence
- A clean Resistance Zone at 1.1618–1.1624 is the final barrier before expansion
- Market structure is forming a staircase pattern → consistent HH + HL
- The recent bullish leg has more momentum than previous ones
This is a classic bullish breakout setup, supported by structure and liquidity alignment.
3. Market Scenario & Strategy
🔸 Main Scenario – Bullish Breakout (High Probability)
Price is currently testing the resistance zone with strong bullish structure behind it.
If price closes above 1.1624, expect continuation toward:
🎯 Target 1: 1.16530
🎯 Target 2: 1.16688
🎯 Target 3: 1.16749+ (extended liquidity zone)
A clean breakout → retest → continuation pattern is the expected sequence.
Strategy:
Look for long entries on:
✔ Break + retest of 1.1624
✔ Or pullback into minor higher low structure
Momentum is on the buyer’s side.
🔹 Sub Scenario – Correction Before Breakout
If price gets temporarily rejected at the resistance zone:
- Expect a pullback toward 1.1580–1.1600
- This would allow buyers to reload before pushing higher
Structure remains bullish as long as price stays above 1.1550.
Invalidation of Bullish Bias :
❌ 4H close below 1.1550 → structure weakens
New targets would shift to 1.1500 and lower.
Probability of this scenario remains lower for now.
4. Summary & Personal View
- Overall Trend: Bullish
- Current Momentum: Strong and accelerating
- Best Buy Zone: On breakout 1.1624 or minor pullback before breakout
- Main Targets: 1.1653 → 1.16688 → 1.16749
- Bias Remains Bullish as long as price holds above 1.1550
EURUSD is preparing for a breakout — this is one of the cleanest continuation structures of the week.
RESOLV Hello my friends 😍
Is the end of the bullish trend of the RESOLV cryptocurrency near? 🤔
The RESOLV cryptocurrency seems to have reached the end of the uptrend and should change direction soon
⚠️ The question is, should I enter a short position at this point?
💁♂️ Absolutely not!
🤔 When should we enter a trade?
💁♂️ When we see a logical structure with a trigger in this area
⚠️ If I don't see a structure and a trigger in this area, I won't enter a trade
The analysis targets will be the lower orange areas
⚠️The analysis may not reach the final target, so at each target, if you make a good profit and see signs of a trend change, you can exit the trade or manage your capital.
⚠️ None of the analysis is a recommendation to buy or sell, but simply my personal opinions on the charts. You can use the charts and choose any that interest you and take a position if you wish.
To support me, I would appreciate it if you boost the analysis and share it with your friends so that I can analyze it with more energy for you, my dears. Thank you all. ❤️

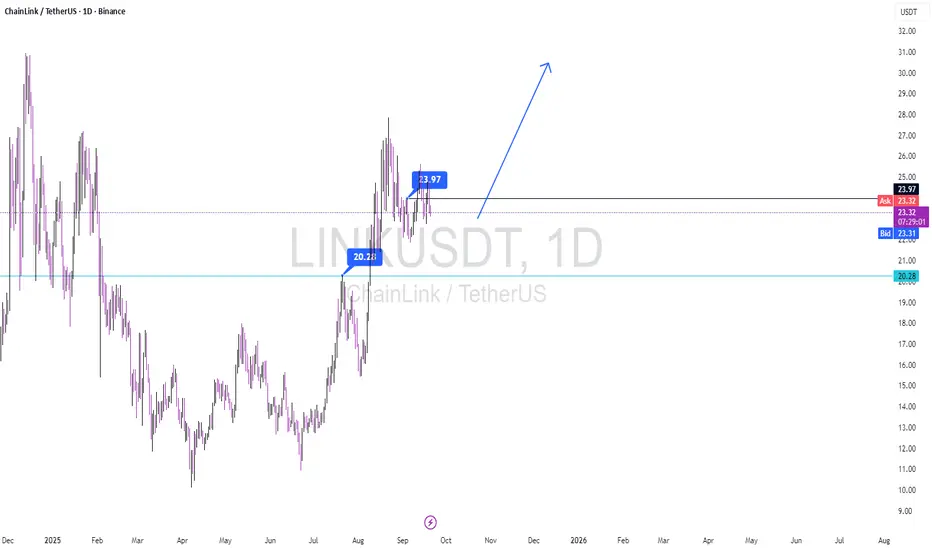
Professional Analysis: LINK/USDT (Daily Timeframe)Current Setup: LINK has successfully breached and held above the key support level of $20.28, demonstrating bullish momentum. The price action is currently consolidating in what appears to be a Bull Flag pattern, suggesting a potential continuation of the prior upward move.
Trigger & Confirmation: A decisive daily close above the pattern's resistance at $23.97 will serve as the primary buy signal according to my strategy. I am awaiting confirmation from a secondary indicator before considering this trigger fully validated.
Projection: Upon a confirmed breakout, LINK possesses a clear trajectory to target higher resistance levels on the daily chart.
Risk Management: A strict stop-loss is essential for this setup. Any move resulting in a daily close back below $20.28 would invalidate the bullish structure and signal an exit.
I will issue a formal ' SPECIAL SIGNAL ' alert once all confirmation criteria are met and the trade is officially live.
Trade Safe,
S.Reza Mehrjuyan / CEO FNS
Analyst, Manager
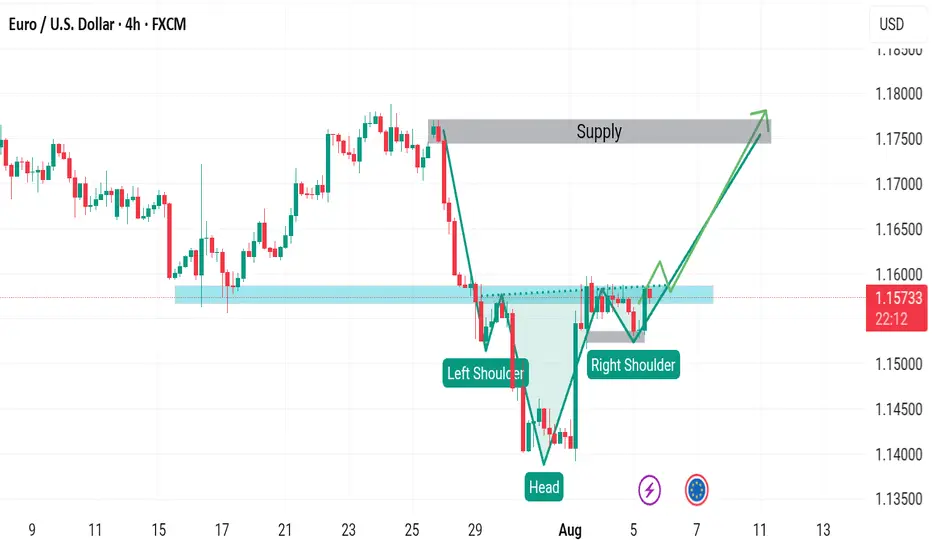
EURUSD BUY SETUPThe price will form a head and shoulders pattern because the candle in the second shoulder is very strong, which indicates that it will break the neck of the pattern. We also have a stronger bounce from below, so I expect an uptrend.
USD/JPY AnalysisOn the daily timeframe, a downward movement toward the 147.014 level is expected, followed by a short-term upward move projected to reach 153.550
This analysis is brought to you by the FXonbit Traders Team

GBPJPY Bullish After RetestI see that GBPJPY will experience a decline and enter the demand area, our plan is to take a BUY setup if the price enters the demand area with a realistic target of 1: 2, setup, see chart image. Thank you happy trading.
Note: this is not trading advice. All risks are not our responsibility. Secure your account.

SOLUSDT 4H SHORT Hello traders, today I see that Solana needs time to return to the price of 88 USDT. I decide to enter at 97 USDT, but as you can see, the stop loss is very small to recover in the next trade. The profit target for this setup is 10% as the first goal and 28% as the second goal. I am basing this on Fibonacci and order block zones. Good luck.

#YFIIt is moving in a short-term ascending channel, and this upward correction can continue the downward trend until the specified areas. Therefore, with a pullback to the upper area, it can continue the downward trend.

#EURUSDAccording to the previous analysis, the EURUSD currency pair has started to correct around the resistance zone, which after a complete cycle can continue the trend in the specified support zone to retest the previous ceiling. But to confirm the continuation of the process, you have to wait for a double floor, one floor higher to continue the path. In the open time, this continuation of the movement path can be continued up to the range of 1.14.

#Pepe | #Usdt | Buy Zones#PEPE is a meme coin with a very high risk, as a result, you should know that the money you invest for this currency is likely to reach zero, so buy a small amount of this currency in good areas.

#BTC | #Usdt | WEEKLYBitcoin is currently supported by MA 192 on the weekly time frame
After this dynamic support, the next support is the area of 25250 to 23950
And the resistance area is 31294~32400

#BTC | #Usdt#BTC In the time frame of 15 minutes, it is located in a rectangle
The ceiling of this rectangle is the price area of 27756.6 and the price floor of this rectangle is 27282 ~ 27339.7
If the rectangle breaks upwards, the price can rise up to the green lines indicated in the chart

#Pepe | #UsdtIt is located in a rectangle in the time frame of 5 minutes
The ceiling of this rectangle is the price area of 0.00000207903 and the price floor of this rectangle is 0.0000015 ~ 0.00000153352.
If the rectangle breaks upwards, the price can rise up to the green lines indicated in the chart

#Btc | #UsdtBitcoin is in a bullish channel on the one-hour time frame
And its momentum in the one-hour time frame is upward, but apparently its energy has decreased
The first static resistance in the area of 30041~29977
Next static resistance area 30532~30763
And it has a very strong daily resistance in the area of 31245~32707

#PEPE | #Usdt#PEPE currency was able to break the key resistance of 0.0000015 in the 15-minute time frame, and it is currently in an ascending channel, if the support price falls, it is indicated on the chart.
And if the price continues to rise, the resistances are also indicated in the chart.

FTM USDT CHART ANALYSIS WITH PROFFESIONAL COACH The FTM/USDT cryptocurrency pair is currently showing a bearish trend and may continue to decline towards the zone of 0.3900. Please note that cryptocurrency markets are highly volatile and can change rapidly. It's important to conduct thorough research and exercise caution when making investment decisions."

DXY visionhello
my analyze on DXY chart is a bullish channel
price hit top of channel and then goes down, 1 week ago hitted an Support(Was Resistance before) and react to it, now i can goes top again or break it and then goes to bottom of channel.
also here it is 0.618 Fibo from last bullish wave but price have bearish momentum ,
lets see what will happen and waiting for confirmations.
Hope you enjoy this analyze and like it,
comment your idea about DXY.
Follow for more analyze.

Weekly Outlook - SMC Daily AnalysisWeekly Outlook + Daily Analysis for AUDUSD
Daily Chart
s3.tradingview.com
After a reaction from a flip zone on the daily decisional demand we can see that more recent price action caused a daily change of character. At this point, we can start to anticipate the possibility that the higher time frame is going to turn around and continue the swing trend bearish.
4hr Chart
s3.tradingview.com
After a daily bos or change of character we can now expect a retracement to a daily discount level (if not a sweep if the daily high to form a failed higher high on the daily)
We can see that the 4hr is clearly bullish, heading to a deeply discount range, if not to clear the daily high.
15m chart
s3.tradingview.com
Here is the general expectational order flow that we can look for trade setups within. We understand "what should happen" while simultaneously trading "what is happening" , in other words lets continue to trade with the 4hr and 15m trends until we get a very clear indication of market reversal.

GBPUSD October 11th 2022i saw today news at 2am NY time market not really moving and clear low that been form on 30 sept 2022 and at 5m TF i saw that BMS to upside at 3am..so im entry when it retrace to FVG at 5m TF
my target is Monday high cause market CLEARLY make equal high on Monday
