APPLE Massively oversold RSI. Short-term buy??Almost 2 months ago (December 05 2025, see chart below), we gave a massive long-term Sell Signal on APPLE (AAPL) as it hit the top of its 4-year Channel Up and the 1.236 Fibonacci extension:
The price immediately dropped and we are now on a strong weekly selling streak that is approaching the 1W MA50 (red trend-line), which is generally the first technical Support during corrections.
However, the 1D RSI turned massively oversold as it hit 20.00 and this is technically the first Buy Signal but only on a short-term basis. In fact, every correction within this Channel Up pattern, always rebounded around the same point we are at today, to test the 1D MA50 (blue trend-line) and then resumed the long-term downtrend to test the 1W MA50. This 1D MA50 test may take place at $265.
Whether that's a traditional Bear Cycle (like in 2022) or a shorter correction, the deciding factor will be the 1W MA50 test. We expect that to be at $236, which is also where the 0.382 Fib is (tested previously on the October 26 2023 low). A break below it, will technically open the way for further downside towards the 1W MA200 (orange trend-line).
In that case, we will maintain a long-term target/ Buy Zone within $210 - $200, whose bottom will still be marginally less than the -32.00% of 2022 or the -35.00% of early 2025.
---
** Please LIKE 👍, FOLLOW ✅, SHARE 🙌 and COMMENT ✍ if you enjoy this idea! Also share your ideas and charts in the comments section below! This is best way to keep it relevant, support us, keep the content here free and allow the idea to reach as many people as possible. **
---
💸💸💸💸💸💸
👇 👇 👇 👇 👇 👇
Apple

SPY WEEKLY 20 JAN 2026Spy weekly is here, feel free to leave a comment if you have any doubt and I will try to revert back asap.
I have analyzed in depth price action here discussing all sectors as well
NOTE:ALWAYS USE SL

Apples easy 1 month reversalApple Inc. (AAPL) is currently trading under a tough resistance zone where sellers have stepped in multiple times before, making it a key area to watch. This zone has capped price in the past, so hesitation here is normal. However, if AAPL can break and hold above this resistance with strong volume, there is relatively clean upside ahead. Once through, price has an easier path back toward the previous swing high, with fewer major resistance levels in between, increasing the odds of momentum continuation.

Apple - Going DeeperIt looks like a full five-wave structure has formed.
Waves 1 and 5 are almost equal in size.
We may still see a short push higher, back toward 288 , and then the move down begins.
Alternatively, the decline could start from the current level.
Potential targets:
260 -> 243 -> 229
---
Please subscribe and leave a comment.
You’ll get new information faster than anyone else.
---

AAPL (Apple Inc.) – High Timeframe Demand Reaction | Swing Long Apple is pulling back into a strong higher-timeframe demand zone after a corrective move from recent highs. Market structure remains bullish, with price respecting prior accumulation and discount levels. The marked zone aligns with previous consolidation and institutional buying interest.
Key Levels to Watch:
Demand / Buy Zone: 234.00 – 230.30
Invalidation: Clean break & close below 230
Upside Targets:
First objective: 255+
Extension targets: 280 → 300 (HTF projection)

AAPL 96 days Trend Line Breakdown I wanted to publish this idea at the moment of the break down, but I simply didn't have time because we didn't have electricity in Ukraine for 15 hours a day for a few weeks already.
So, here we can see Apple breaking down a 96 days trend line thus losing a long trend. I wouldn't rely on it this much but the stock had a very big run previously and is cooling off now. This is the example of a bigger view I wrote in my other Idea of tech heavy stocks dragging the index lower. There are others which were going down for a long time already.
Right now I could see it being choppy, or making short squeezes cause we are already down a lot (for 7 red weeks straight). And cramer went bearish on it yesterday :) But the overall trend is obviously down.
Stay safe!

AAPL – Breakdown in Play, Eyes on $248 ZoneApple NASDAQ:AAPL is breaking down, unable to reclaim the key $262 level, signaling continued bearish pressure. The rejection at this level has shifted focus to the $245–$248 area, where buyers may look for re-entry. This zone aligns with past support and could offer a technical bounce setup.
📌 Trade Plan:
Entry: $245–$248
Take Profit: $262 (TP1), $275 (TP2)
Stop Loss: $239
This setup targets a bounce play with well-defined risk/reward. The $239 stop loss protects against further downside if the breakdown accelerates. Watching closely for price action signals or volume confirmation before entry.
⚠️ Discipline is key—this is a technical play, not financial advice.

APPLE What Next? BUY!
My dear followers,
This is my opinion on the APPLE next move:
The asset is approaching an important pivot point 255.48
Bias - Bullish
Safe Stop Loss - 254.60
Technical Indicators: Supper Trend generates a clear long signal while Pivot Point HL is currently determining the overall Bullish trend of the market.
Goal - 257.25
About Used Indicators:
For more efficient signals, super-trend is used in combination with other indicators like Pivot Points.
Disclosure: I am part of Trade Nation's Influencer program and receive a monthly fee for using their TradingView charts in my analysis.
———————————
WISH YOU ALL LUCK

APPLE: Long Trade with Entry/SL/TP
APPLE
- Classic bullish pattern
- Our team expects retracement
SUGGESTED TRADE:
Swing Trade
Buy APPLE
Entry - 255.48
Stop - 254.29
Take - 257.63
Our Risk - 1%
Start protection of your profits from lower levels
Disclosure: I am part of Trade Nation's Influencer program and receive a monthly fee for using their TradingView charts in my analysis.
❤️ Please, support our work with like & comment! ❤️

Apple remains bullish, but consolidation/pullback likelyApple stock continues to trade in a ascending channel that has been intact since 2019. The stock has continually made higher highs; however, RSI bearish divergence has deepen, warning of larger pullback or at least a period of consolidation. Last time we saw similar divergence in the stock, the asset fell $50. All in all, traders should watch short term support at $250, before a potential larger pullback.

-15% in the next 1-2 monthsAAPL has been messing around in this bear flag for quite a bit.
Most of the Mag7 have broken down aside from Google.
Next major support on AAPL is not until 237....
Looking for the next leg down.
I'm honestly not sure "why" this is happening, which is more frightening long-term. Typically when there is a news event reason, the market prices it in and we continue up.
But, when markets flip without any reason, it means they know the reason but aren't telling the public because they need time to get out of the burning building while you're all eating the cake and getting fat.
If you are buying Mag7 stocks, SPY, QQQ right now.
You are a pig, getting fat, inside a burning building.

DVA LOOKING GOOD 13 Jan 2026Dva is looking very good to create long positions. I am creatkng some long positions here. Not for trading but in my portfolio as the level looks very good but just being conservative because of the market.
I will update the price action analysis soon

AAPL – Bullish Flag If the Catalysts Show UpApple is pulling back into a descending flag after a strong multi-month rally. This still looks like a healthy consolidation if the next move higher is backed by fundamentals. The bullish case needs catalysts to trigger: iPhone 17 supply catching up to demand, Services growth holding in the mid-teens (high-margin EPS leverage), and gross margins staying resilient despite higher AI spend.
If these start to confirm and price pushes higher, the flag can resolve to the upside. If not, a failure could lead to a minor correction toward the anchored VWAP, which would still be consistent with the broader bullish structure. The oversold RSI suggests downside may be limited near-term, supporting the idea of consolidation rather than a full trend break.

AAPL | 30m | ShortTech rotation: Pre-earnings neutral (Jan 29, 10-12% rev guide positive but China risks). USD strength pressures growth. News impact: Quiet Monday, rotation continues. Liquidity high.
_________
Execution:
Entry: Sell below 269.00 (strong resistance)
Stop: 282.30-283 (above MA20)
Targets: 255.00 - 245.22 (use trailing SL)
_________
Disclaimer: This is not financial advice — just my thoughts for educational purposes only. Always DYOR and trade at your own risk.
Stay tuned. Follow for more. Daily setups.

SPY PRICE ACTION 10TH JAN 2026This is the price action for the overall market. If you did like the analysis make sure you to like & follow me here.
NOTE:USE TIGHT STOPS IF YOU ARE LONG

Asset Sold: Apple IncAsset Sold: Apple Inc
Symbol: AAPL
Exchange: US
Sold at Market Value: US $259.15
Date: 10-Jan-2025

AAPL: The 30% Rule — Why Apple’s Next True Low Likely at 200 USD🍎 AAPL WEEKLY SNAPSHOT — EXECUTIVE SUMMARY
✨ Apple Inc. is entering the late phase of a multi-year corrective cycle
📉 Primary thesis: A ~30% correction is still unfolding, consistent with prior Apple macro drawdowns
🏛️ Macro backdrop: Dow Jones Industrial Average extended near psychological 50,000 → late-cycle risk elevated
⏳ Timing focus: 2025 distribution → 2026 corrective low
🎯 Projected downside target: $200 ±10 macro support + valuation reset
________________________________________
🔍 Why the 30% Correction Matters Historical Fractal Logic
Apple has repeatedly respected ~30% drawdowns during secular bull markets — not crashes, but controlled re-ratings:
• 📌 2021 → 2022:
• High → Low ≈ -30%
• Trigger: tightening cycle + growth multiple compression
• Outcome: strong multi-quarter recovery
• 📌 2024 → 2025:
• High → Low ≈ -30%
• Trigger: AI-led over-extension + index concentration risk
• Outcome: range repair, not trend resumption
• 📍 Current Cycle (2025 → 2026):
• Structure suggests another proportional leg
• Distribution at highs → rolling lower highs → trend exhaustion
• Measured move from 286 ⇒ ~200 aligns with historical symmetry
📐 Market logic: Apple doesn’t usually collapse — it compresses.
________________________________________
🧱 Key Technical Zones Weekly / Monthly
• 🔺 286–280: Macro ceiling / cycle high (distribution complete)
• ⚖️ 245–235: Mid-range congestion (temporary reactions possible)
• 🟨 215–200: High-probability terminal support zone
• 🚨 Invalidation (bear thesis): Sustained acceptance above 286
________________________________________
🧠 Macro Confluence Why 2026 Matters
• 📊 DJIA near historic extension → mean reversion risk rising
• 💰 Passive flows crowded into mega-caps (AAPL = core holding)
• 🧮 Valuation sensitivity at cycle peaks historically resolves via price, not time
• 🕰️ Apple corrections often lag index tops, bottoming after broader sentiment breaks
________________________________________
🎯 Strategic Trade Framework
• ❌ Avoid chasing long exposure at highs
• 🧘♂️ Expect volatility + range expansion before clarity
• 🛒 Best long-term accumulation: only near 200 zone, not earlier
• 🧭 Tactical traders may short rallies below 280 with tight risk
• 🏦 Post-2026: High-quality reset likely sets up next secular advance
________________________________________
🗳️ AAPL Weekly Scenarios — Levels Quiz
Which path do you see next?
🅰️ Hold above 245 → extended range before final breakdown
🅱️ Break 235 → acceleration toward 215–200 macro support
🅲 Flush to ~200 in 2026 → generational accumulation window
🅳 Your level: comment the one price that changes your bias

$AAPLNASDAQ:AAPL you owe Me. Lets Get it. Big Bounce back candle is being ENGULFED by green buy candles, so 1.272, 1.414 & 1.618 are all target for this Light show.
Happy Trading, Alerts Set!

$AAPL On the Move NASDAQ:AAPL Look just like the rest of them with the HARD rejection at -0.414 & -0.272. The Chart Explains it self for the Most Part. The Risk to Reward Ratio is Super Litty!. A whole lot to get and not too much to lose. Stay Discipline and yall will be just FINE.
Alerts Sets, Happy Trading!
TUESDAY is my Favorite day of the Week, Its random as hell.

Apple Next MoveApple Index
- Rising Wedge as an corrective pattern in Short Time Frame
- Change of Characteristics
- Completed " 12 " Impulsive Waves
- Break of Structure
- Fibonacci Level - 261.80%

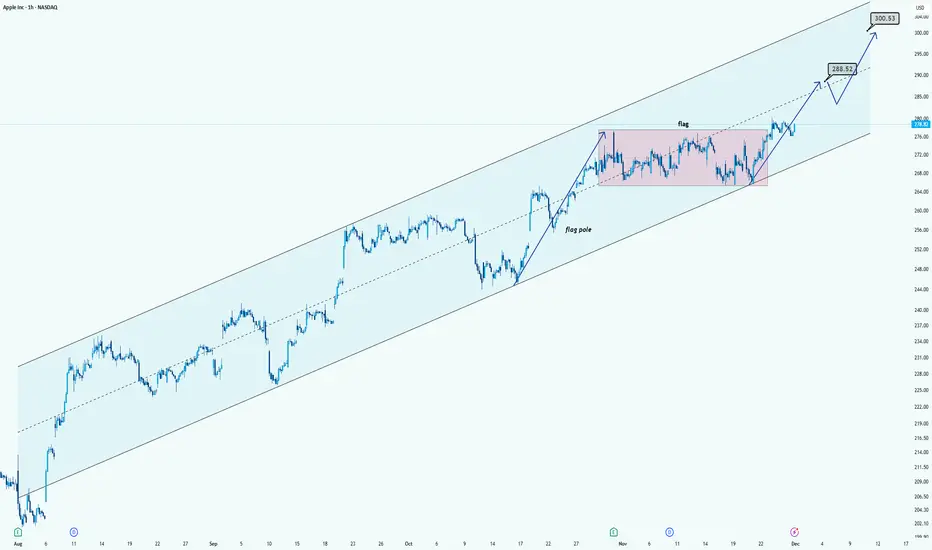
AAPL Chart AnalysisHi!
AAPL is trading inside a clean long-term ascending channel, showing a strong uptrend. Recently, the price formed a bullish flag (pink zone) after a sharp move up. The breakout above the flag signals continuation of the trend.
The chart projects two key upside levels:
$288.52 as the first target (flag breakout objective / mid-channel resistance)
$300.53 as the second target (upper channel boundary + psychological level)
As long as price stays above the flag range and respects the channel, the bullish structure remains intact.
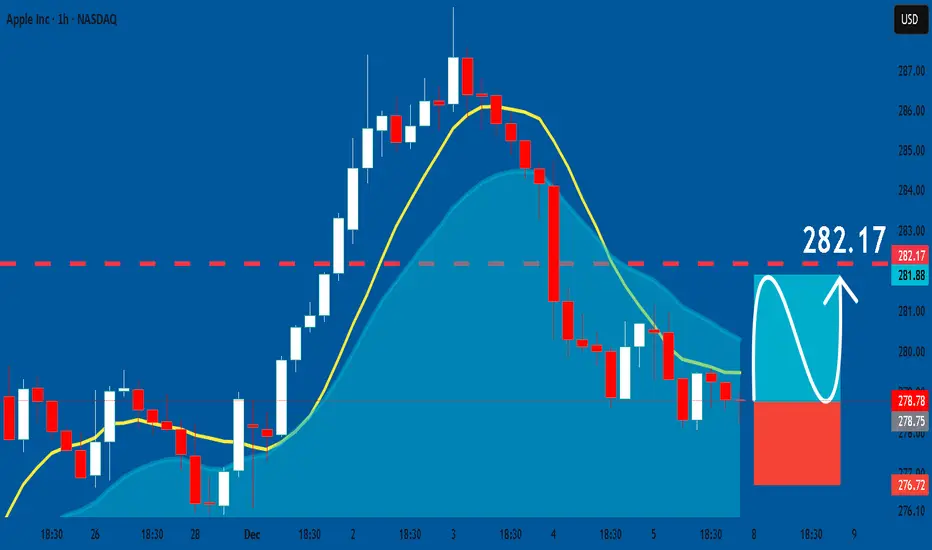
APPLE: Bullish Continuation & Long Signal
APPLE
- Classic bullish pattern
- Our team expects retracement
SUGGESTED TRADE:
Swing Trade
Buy EURUSD
Entry - 278.78
Stop- 276.72
Take - 282.17
Our Risk - 1%
Start protection of your profits from lower levels
Disclosure: I am part of Trade Nation's Influencer program and receive a monthly fee for using their TradingView charts in my analysis.
❤️ Please, support our work with like & comment! ❤️
Apple - This stock will collapse!🥊Apple ( NASDAQ:AAPL ) is reversing right now:
🔎Analysis summary:
Starting back five years ago, Apple established a major rising channel pattern. Following this channel, Apple recently created a textbook +40% move higher. But with the current retest of resistance, we will certainly see another pullback of -30% in the near future.
📝Levels to watch:
$250
SwingTraderPhil
SwingTrading.Simplified. | Investing.Simplified. | #LONGTERMVISION
