Get your 'headset' around Apple's key reversal dayWhat costs $3500 and leaves the user vulnerable to being pranked from ‘friends’ whilst wearing it? Yes, Apple’s augmented reality headset, which comes in ~3x more than one made by Meta. You can read up on all its features and Apple’s latest announcements elsewhere. As what we’re focussing on today is that Apple’s stock closed lower on the day it unveiled its latest anti-social device. And the fact it occurred after a false break to a fresh record high should also serve as a ‘reality’ check to bulls. At least over the near term.
Sure, the daily chart is clearly in an uptrend. But it has hit a stumbling block at its previous record highs set in 2022. Moreover, RSI has reached overbought and the day closed with a key reversal bar – which is a bearish outside / engulfing candle on high volume, which suggests all is not well at these highs. Furthermore, the OBV indicator (on balance volume) has failed to break above its own cycle high despite prices continuing north which suggests potential weakness to the underlying trend.
From here, bears could either seek to fade into minor rallies within the key reversal day, and set an initial downside target around 157.77 gap support. A break beneath which brings the 170 handle / 172.15 HVN (high volume node) into focus for bears.
Applesignals

APPLE Made a new All Time High! Can it extend the gains?Apple Inc. (AAPL) just made a new (historic) All Time High (ATH) today by breaking above $183.00 and is simply extending the rise on the Channel Up pattern that started on the January 03 2023 market bottom. At the same time it has already hit our short-term target (165.00) and is near completing our final target of 190.00. This is the target set we called for on our last Apple analysis on March 06 (see chart below):
The basis of this target is the 2.0 Fibonacci extension from the Right Shoulder of the Inverse Head and Shoulders (IH&S) pattern that priced the January bottom. The 1D RSI however has reached a level, the 76.50 Resistance, which since last August has caused two rejections. We do expect a rebound on the 4H MA50 (yellow trend-line) but if broken, be ready to add buys on the 1D MA50 (blue trend-line) which has been holding as Support since January 25. The long-term Support from now on is the 1W MA50 (red trend-line), which is traditionally the Support on new multi-month rallies such as the current one.
-------------------------------------------------------------------------------
** Please LIKE 👍, FOLLOW ✅, SHARE 🙌 and COMMENT ✍ if you enjoy this idea! Also share your ideas and charts in the comments section below! **
-------------------------------------------------------------------------------
💸💸💸💸💸💸
👇 👇 👇 👇 👇 👇

APPLE BUYHello, great opportunity to invest in Apple shares. There is a high probability of going up. With breaking the strong resistance at 156. With a model forming. bullish flag.Note: If you like this analysis, please give your opinion on it. in the comments. I will be happy to share ideas. Like and click to get free content. Thank yo

💥 AAPL 4H-TIMEFRAME ANALYSIS💥 AAPL 4H-TIMEFRAME ANALYSIS
💗Hello ladies and gentlemen
This is my new idea for 💥Apple inc
I hope my idea is clear
Support me by like and share thank you
Stay Safe💯💲💲💲
Good luck💰😍

Apple -> Could It Be More Obvious?Hello Traders,
welcome to this free and educational multi-timeframe technical analysis .
On the weekly timeframe Apple stock is currently retesting a quite obvious previous resistance area which is turned resistance once again.
Just recently we also had a bullish ema crossover, which is always considered a bullish sign, so from here I do expect a short term rejection away from the support zone and then the longer term continuation towards the upside.
On the daily timeframe it seems like today's candle will close with a massive rejection wick, indicating selling pressure so it is quite likely that we will see at least a short term rejection away from this resistance area.
Thank you for watching and I will see you tomorrow!
You can also check out my previous analysis of this asset:

APPLE Inverse Head and Shoulders give a new All Time HighApple Inc. (AAPL) has just completed an Inverse Head and Shoulders pattern, with its Head being the January 03 market Bottom. The Bear Cycle isn't technically over for Apple as the Channel Down that started back on the October 04 2021 Low hasn't yet been broken. In fact since the last two Lower Highs sequences have been +31.11% and +36.78%, the current rally is limited within the red Triangle Zone. As a result we have a short-term target at $165.00.
With the Inverse Head and Shoulders though technically aiming much higher, supported also by a 1W MACD Bullish Cross, if Apple closes a 1W candle above the Channel Down, we will re-buy and target $190.00 on the long-term, which is just below the 2.0 Fibonacci extension level.
-------------------------------------------------------------------------------
** Please LIKE 👍, FOLLOW ✅, SHARE 🙌 and COMMENT ✍ if you enjoy this idea! Also share your ideas and charts in the comments section below! **
-------------------------------------------------------------------------------
💸💸💸💸💸💸
👇 👇 👇 👇 👇 👇n

APPLE SELLPeace be upon you, merchants. Apple stock is negative. with a fracture. Double BOTTOM. It is a strong model and was unable to break a very strong resistance. At the price of 156. There is the possibility of re-testing. The price is 150. And re-disembarkation. to the level of 143. what do you think

AAPL Bears Stepping Back IN?Apple's market structure appears to be making lower lows indicating bearish sentiment. Leaving a major area of chop and a long rally up could be indicating the start of a mark-down period of bearish price action.

Apple Analysis 24.01.2023Hello Traders,
welcome to this free and educational analysis.
I am going to explain where I think this asset is going to go over the next few days and weeks and where I would look for trading opportunities.
If you have any questions or suggestions which asset I should analyse tomorrow, please leave a comment below.
I will personally reply to every single comment!
If you enjoyed this analysis, I would definitely appreciate it, if you smash that like button and maybe consider following my channel.
Thank you for watching and I will see you tomorrow!
You can also check out my previous analysis of this asset:

Apple Analysis 11.01.2023Hello Traders,
welcome to this free and educational analysis.
I am going to explain where I think this asset is going to go over the next few days and weeks and where I would look for trading opportunities.
If you have any questions or suggestions which asset I should analyse tomorrow, please leave a comment below.
I will personally reply to every single comment!
If you enjoyed this analysis, I would definitely appreciate it, if you smash that like button and maybe consider following my channel.
Thank you for watching and I will see you tomorrow!
You can also check out my previous analysis of this asset:

Apple: Detour 🗺️Wrong turn! Although we expect the Apple stock to drop further into the grey target zone between $126.62 and $109.22, our little friend chose a detour in the opposite direction and is heading North. Imminently, the stock should get back on track and finish off the grey superior wave IV, before getting to rise up North for good. Since the course already completed all requirements and hit the grey zone, there's a slight change that the upwards trend might continue, without turning back down to fulfill the grey wave IV.

Apple Analysis 03.01.2023Hello Traders,
welcome to this free and educational analysis.
I am going to explain where I think this asset is going to go over the next few days and weeks and where I would look for trading opportunities.
If you have any questions or suggestions which asset I should analyse tomorrow, please leave a comment below.
I will personally reply to every single comment!
If you enjoyed this analysis, I would definitely appreciate it, if you smash that like button and maybe consider following my channel.
Thank you for watching and I will see you tomorrow!
You can also check out my previous analysis:

AAPLNot financial advice. The essence of investing & trading is the intelligent and patient preying on the greed, fear, impatience, addiction and ignorance of the majority. It's definitionally Darwinian.

Apple Analysis 21.12.2022Hello Traders,
welcome to this free and educational analysis.
I am going to explain where I think this asset is going to go over the next few days and weeks and where I would look for trading opportunities.
If you have any questions or suggestions which asset I should analyse tomorrow, please leave a comment below.
I will personally reply to every single comment!
If you enjoyed this analysis, I would definitely appreciate it, if you smash that like button and maybe consider following my channel.
Thank you for watching and I will see you tomorrow!
You can also check out my previous analysis:

Apple Analysis 14.12.2022Hello Traders,
welcome to this free and educational analysis.
I am going to explain where I think this asset is going to go over the next few days and weeks and where I would look for trading opportunities.
If you have any questions or suggestions which asset I should analyse tomorrow, please leave a comment below.
I will personally reply to every single comment!
If you enjoyed this analysis, I would definitely appreciate it, if you smash that like button and maybe consider following my channel.
Thank you for watching and I will see you tomorrow!
You can also check out my previous analysis:

Apple Analysis 14.11.2022Welcome to the BasicTrading channel.
My name is Philip and in todays analysis I quickly go over the situation which we currently have on Apple.
I will analyse the asset both from a weekly and daily timeframe to show you the best possible trading opportunities.
If you enjoyed this analysis, let me know in the comment section which asset I should analyse tomorrow.
I will personally reply to every single comment.
Dont forget to smash that rocket and I will see you tomorrow with a new analysis.

APPLE confirmed a bullish extension. Potential for $167.Apple Inc. (AAPL) broke on Friday above the 1D MA50 (blue trend-line) following the strong rebound after Wednesday's big drop on the monthly inflation (down -0.5% to 7.7%), fueled by hopes of a future monetary easing by the Fed. Even though technically the last rejection was made on the 1D MA200 (orange trend-line), it is the 1D MA50 that confirmed the bullish extension during both July 07 but mostly March 22, which is the fractal that resembles the price action since mid-August the most.
With the RSI sequences between the two quite similar, it appears that we are in that final phase that will form the new Lower High on the Lower Highs trend-line since January 03, which has been basically the Resistance of this whole Bear Cycle. The March 2022 rally topped above the 0.786 Fibonacci retracement level. That is now on $167.45, with the January Lower Highs trend-line extending even above $170.00. Solid medium-term buy opportunity for Apple.
-------------------------------------------------------------------------------
** Please LIKE 👍, SUBSCRIBE ✅, SHARE 🙌 and COMMENT ✍ if you enjoy this idea! Also share your ideas and charts in the comments section below! This is best way to keep it relevant, support me, keep the content here free and allow the idea to reach as many people as possible. **
-------------------------------------------------------------------------------
You may also TELL ME 🙋♀️🙋♂️ in the comments section which symbol you want me to analyze next and on which time-frame. The one with the most posts will be published tomorrow! 👏🎁
-------------------------------------------------------------------------------
👇 👇 👇 👇 👇 👇
💸💸💸💸💸💸
👇 👇 👇 👇 👇 👇

Buy signal for AAPL Green outlines possible areas of resistance, but at the same time, they are the targets.

🟢 AAPL - 3D (06.10.2022)🟢 AAPL
TF: 3D
Side: Long
SL: $137.69
TP 1: $152.38
TP 2: $156.92
TP 3: $161.46
Apple should show some growth in the coming weeks with the support of the 200D EMA.
RSI and MACD look like they could support the movement. 1M time frame also looks good to make way for the growth.

Apple stonks possible roundtripI checked M1 and W1 timeframes in chart just to set possible next supports and resistances in order to trace a roundtrip to long-term invest for Apple stonks.
We can also see in chart that squeeze momentum has a bearish divergence BUT we can also see that CRSI is overselled which makes me think about current bearish trend has not enough strength to imagine (for now) a big price fall.
Also Wyckoff gives us a clue about future moves for Apple stonks because we can expect SOW in Phase B after ST (not confirmed yet) but it seems a typical Wyckoff’s Distribution Schema.
As per expected moves are bearish and bullish ones so i decide to tag this idea NEUTRAL.

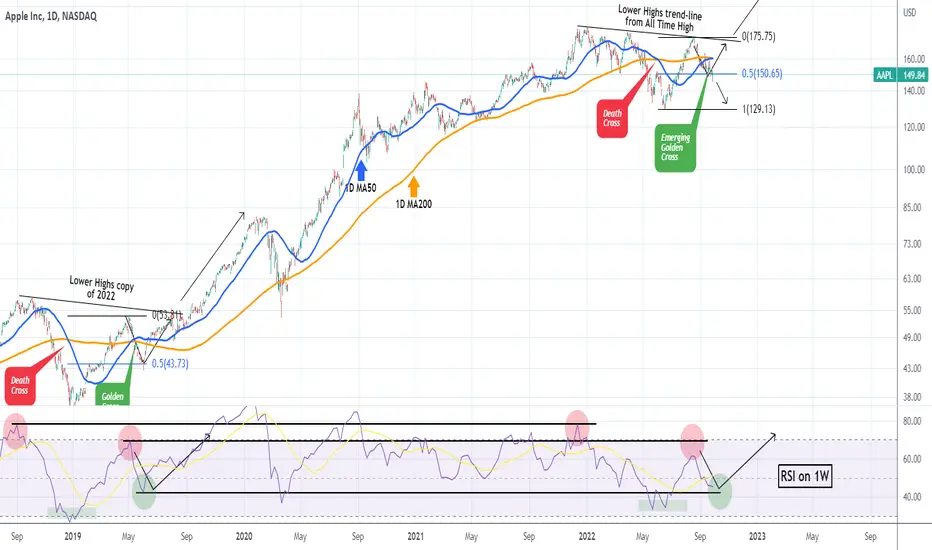
AAPLE -50% of June rally lost. Will it recover on the 2019 fractApple (AAPL) has fallen more than -17% from the mid-August High, losing more than half of the gains made on the June 16 rally. Right now it is exactly on the 0.5 Fibonacci retracement level on that High-Low sequence and on top of that a Golden Cross pattern is emerging (when the 1D MA50 (blue trend-line) crosses above the 1D MA200 (orange trend-line)).
We have explicitly outlined this potential fall to the 0.5 Fib if the price got rejected on the Lower Highs trend-line from the All Time High, on our August 17 idea:
As you see the timing couldn't be better as those where the days that the top was formed and the price got rejected. The last time we saw a similar pattern was on the June 03 2019 test of the 0.5 Fib. That was also caused by a rejection near the 2018 Lower Highs but the Golden Cross was formed a little earlier. After a marginal breach of the 0.5 Fib (such as the one we had yesterday), Apple resumed the uptrend and the recovery path.
See also the similarities on the RSI (1W time-frame), though this time it got rejected slightly below the Resistance level it did back in May 2019. This may possibly mean that we can see a rebound slightly higher than the symmetrical Support level. Another closing below it though can initiate an aggressive sell-off towards June's lows. In our view it is critical to see the Golden Cross forming, which should encourage buyers to accumulate.
-------------------------------------------------------------------------------
** Please LIKE 👍, SUBSCRIBE ✅, SHARE 🙌 and COMMENT ✍ if you enjoy this idea! Also share your ideas and charts in the comments section below! This is best way to keep it relevant, support me, keep the content here free and allow the idea to reach as many people as possible. **
-------------------------------------------------------------------------------
You may also TELL ME 🙋♀️🙋♂️ in the comments section which symbol you want me to analyze next and on which time-frame. The one with the most posts will be published tomorrow! 👏🎁
-------------------------------------------------------------------------------
👇 👇 👇 👇 👇 👇
👇 👇 👇 👇 👇 👇
👇 👇 👇 👇 👇 👇
APPL Time to sellafter we have had elliott wave LH '' Low high '' we will see a continuation of the downtrend after a fundamental and techinical analysis

AAPL Long Re posting This as my last one seems to have been blocked for some reason. AAAPL Appears to be approaching oversold territory, $200 price target or a potential continuation below Sl.
