CVD and Open Interest DivergenceOpen Interest answers a simple but critical question: are traders committing new risk, or are they exiting existing positions? When price rises while Open Interest increases, new contracts are being added in the direction of the move. This confirms expansion and signals that the market is willing to fund higher prices. When price rises while Open Interest falls, positions are being closed into strength. That behavior reflects distribution rather than continuation. The same logic applies on the downside. Falling price with rising Open Interest signals aggressive short participation. Falling price with declining Open Interest signals profit-taking, not fresh selling pressure.
Cumulative Volume Delta adds context to this positioning data. It measures whether aggressive market orders are driving price or being absorbed by passive liquidity. When price prints higher highs but CVD fails to confirm, buying pressure is weakening despite higher prices. Participants are lifting offers with less urgency, and absorption is occurring. When price stalls or compresses while CVD continues to rise, it suggests that aggressive buyers are being absorbed by larger passive sellers. The move looks strong on price, but commitment is thinning.
These divergences become most meaningful when they appear at structurally relevant locations. Inside ranges, they frequently expose failed breakouts where price briefly escapes but participation does not follow. At highs and lows, they reveal exhaustion, where liquidity has been collected but no new initiative remains. During established trends, they help differentiate healthy continuation from late-stage rotation, where the trend persists visually but weakens internally.
The highest-quality environments occur when structure and participation align. A clean break of structure followed by expanding Open Interest and confirming CVD indicates that the market has accepted the new direction. Risk is being added, not removed, and aggressive flow supports price discovery. When one of these components is missing, vulnerability increases. Breaks without Open Interest expansion often fade. Moves with Open Interest but no CVD confirmation frequently stall or retrace.
Many traders struggle because they trade direction without measuring commitment. They react to candles instead of assessing whether the move is being funded. CVD and Open Interest shift the focus from where price moved to why it moved. This perspective reduces overtrading, filters false momentum, and clarifies when patience is required.
Used correctly, these tools are not predictive indicators. They do not call tops or bottoms. They expose when a market narrative is weakening before structure fully changes. That awareness improves timing, limits unnecessary exposure, and prevents chasing moves already sustained by trapped or exiting participants. In leveraged markets, understanding participation is not an edge. It is a requirement for survival.
Article

RSI and MACD TogetherRSI and MACD are often paired together under the idea of confirmation. If both indicators point in the same direction, the trade feels safer. In practice, this combination frequently creates confidence without clarity. The reason is simple. Both indicators are derived from the same source, price, and they often respond to the same information at different speeds.
RSI reacts relatively quickly to changes in momentum. MACD responds more slowly, smoothing price action to highlight broader momentum shifts. When traders wait for both to align before entering, they are often reacting to a move that has already unfolded. The result is late entries, compressed risk-to-reward, and increased sensitivity to pullbacks.
Confluence adds value only when each tool is assigned a clear role. RSI can help assess the current momentum environment, showing whether price behavior supports continuation or suggests slowing participation. MACD can help keep traders aligned with the dominant swing, reducing the urge to exit positions prematurely during normal retracements. Used this way, the indicators support decision-making rather than replacing it.
The combination becomes misleading when it is used to anticipate reversals. Divergences lining up across RSI and MACD feel powerful, but they often appear multiple times during strong trends. Momentum can weaken and reaccelerate without price structure ever breaking. Traders who act on indicator-based anticipation usually enter before the market has resolved its internal balance.
Another issue is redundancy. When both indicators are used to trigger entries, they rarely provide independent information. Agreement between them does not necessarily increase probability. It often just reinforces an interpretation the trader already wants to believe.
RSI and MACD work best after structure and location are established. When price has already shown intent, indicators can help manage timing, confidence, and trade duration. When used in isolation, they tend to encourage reaction instead of understanding.

How RSI Actually Works in Trending vs Ranging MarketsRSI behaves very differently depending on how the market is structured. Traders who treat it the same way in every condition usually end up confused, taking trades that look justified on the indicator but make little sense on price.
In a trending market, price moves with intent. Higher highs and higher lows in an uptrend, or the opposite in a downtrend, create sustained directional pressure. In these conditions, RSI tends to stabilize within a higher or lower zone rather than oscillating between traditional extremes. Pullbacks in RSI often reflect pauses in momentum while the trend resets, not signals that the move is ending. Many traders mistake these pauses for reversals and repeatedly trade against the trend.
This is why strong trends often feel “overbought” or “oversold” for long periods. Momentum stays elevated because participation remains consistent. RSI mirrors that persistence. When price structure remains intact, fading RSI extremes usually means fighting the dominant flow.
Ranging markets operate under a different logic. Price rotates between established highs and lows, liquidity is built on both sides, and directional commitment is limited. Momentum naturally expands near the edges of the range and contracts near the middle. In this environment, RSI tends to swing more symmetrically, and extreme readings often align with temporary exhaustion rather than continuation.
Problems arise when traders fail to identify which environment they are in. Applying range-based RSI logic during trends leads to early exits and repeated stop-outs. Applying trend-based logic during ranges leads to overholding and missed rotations. The indicator is not changing. The market is.
RSI becomes meaningful once structure is defined. Start by identifying whether price is expanding or rotating. Then observe how RSI behaves within that context. Over time, patterns emerge that are far more reliable than fixed levels or generic rules. Understanding this relationship turns RSI from a source of noise into a tool for alignment and patience.

A retest framework is a processMost traders know support and resistance, but few have a rule set for when those levels become tradable. In crypto, levels are breached constantly. What matters is not the breach. What matters is what the market accomplishes by breaching it and how it behaves once it returns.
The framework starts by defining a clear swing high and swing low. These are the most recent meaningful extremes where price demonstrably changed direction, not intraday noise. The midpoint between them becomes equilibrium, your objective reference for premium versus discount within that swing. This midpoint is not predictive. It simply organizes the playing field.
Next comes liquidity. Equal highs, equal lows, and inefficient consolidation clusters are not decorations on the chart. They are incentives. Stops pool there. Traders position emotionally there. The market goes there to transact. When price moves into that pocket and leaves a wick that is quickly reclaimed, you have the sweep. This is the first proof that the breakout traders were the liquidity, not the beneficiaries.
A sweep alone is not structure. So the next requirement is transition. In an uptrend, buyers defend higher lows. When the last defended low is violated after a sweep, you get the break of micro-structure. In a downtrend, sellers defend lower highs. When the last supplied high is reclaimed after liquidity is taken below, you have transition in reverse. This is where narrative changes from continuation to rotation.
Then comes displacement. This is the market proving participation through momentum. A structural transition followed by compressed candle ranges or low-volume drift lacks authority. But a transition followed by clean directional movement shows that the opposing side stepped in with urgency. This is not retail FOMO. This is participation.
The retest becomes the execution filter. Price returns to the broken zone or swept liquidity level. It interacts there without hesitation, without sweeping back through the same side, and without expanding candle ranges against the narrative you built. This is where professionals position. Not because it is perfect timing, but because it is permissioned timing. The stop goes beyond the narrative fracture point, not a generic percent. The target goes toward the next liquidity incentive in line, not a vague R:R fantasy.
This sequencing matters even more inside funded evaluations. Prop traders fail most often when they cluster mistakes. A retest framework reduces mistake clustering because it forces the trade to form a story before it forms exposure. It narrows invalidation distance, improves average R:R, and protects daily drawdown math naturally. It also gives you neutrality after streaks. The framework does not amplify confidence.
It anchors confidence to conditions.
The retest framework does not promise that a trade works. It promises that a trade has a reason to work. And having reasons before exposure is the edge that compounds careers in crypto, especially when liquidity and volatility drain fast.

How to audit your own trades like a risk manager would Auditing your trades is not about replaying charts to confirm whether you were right or wrong. A risk manager audits to protect capital durability, reduce mistake frequency, and identify exposures created by process, not emotion. When you adopt this mindset, performance leaks become easy to detect and easier to correct.
A professional audit begins with environment classification. Every trade is labeled by the market phase it was executed in. Volatility is assessed as expanding or compressing. Liquidity incentives are identified before execution, not after it. For example, BTCUSDT and SOLUSDT produce wider candle ranges during expansion and thinner order books when liquidity drains. These are high-invalidation conditions. If you increased size here, you paid an execution tax without a volatility reason. A risk manager never scales into widening ranges. They scale into tightening ranges.
The second step is measuring invalidation distance. Risk officers place stops beyond structure, not arbitrary percentages. A stop below a random 1% or 2% rule means nothing if the structure required 3.5% distance to invalidate the narrative. Your stop must sit beyond the point where the market proves the opposite story. If your invalidation distance widens while volatility expands, that is alignment. If it widens while volatility contracts, that is a process breach.
Next comes execution quality scoring. Professionals deconstruct execution into sequence components: liquidity sweep first, micro-structure break second, displacement third, retest respected fourth, impulse continuation fifth. A trade that triggered on the first touch of a level without displacement is not a good fill. It is the fill the market used for liquidity. Score execution quality based on whether the sequence completed before entry, not whether the P&L was positive.
The fourth layer is correlation risk. Risk auditors measure how many positions were open simultaneously on the same asset or narrative theme. One trade rarely kills a small account. Correlated trades during the same thesis do. Mistake correlation compounds drawdown faster than strategy flaws ever could. Limit correlation by design, not hindsight.
Finally, audit outcomes against process wins. A trade that worked without a reason is not audit approval. A trade that worked because it followed a reasoned sequence is. When you measure behavior instead of candles, you gain intervention points. Intervention points protect capital. Reflection points identify capital already lost.
Small accounts scale when traders audit like capital protection matters more than capturing the entire move. Your audit should produce fewer open questions and more closed rules. The goal is not to defend the trade. The goal is to defend the account.

The one thing that destroys tradersEmotional inflation is a measurable drag on trading performance, particularly in crypto where momentum cycles are short, liquidity is thin, and feedback loops are fast. After a trader strings together strong wins, confidence often expands faster than process. The trader begins to treat recent outcomes as a new baseline for risk. This leads to size increases, earlier entries, or skipping structural confirmation because the mind assumes the market will continue to cooperate. It feels logical in the moment, but it is not rooted in market behavior. The market eventually tests this inflated confidence through liquidity sweeps, compressed volatility, or reclaiming defensive structure. The result is capital giveback, distorted expectations, and emotional volatility that exceeds price volatility.
The cost of emotional inflation is not that it creates bad trades. The cost is that it removes the conditions that made your best trades possible. When confidence accelerates exposure before the market proves continuation through structure and liquidity, you are no longer trading opportunity. You are trading assumption. Crypto punishes assumption faster than most markets because liquidity leaves quickly, bid depth changes abruptly, and breakout traders provide easy fuel for counter moves.
Inflation becomes visible in three repeatable behaviors: increasing size during expansion phases instead of compression phases, entering at the first touch of a level instead of after a structural transition, and treating recent wins as proof of future market cooperation. These behaviors are not personality flaws. They are pattern loops that can be corrected with objective rules and sequencing.
To counter emotional inflation, you need guardrails that do not depend on feelings. The first guardrail is a fixed sizing model tied to volatility conditions, not P&L conditions. Size should increase only when volatility tightens, liquidity aligns cleanly, and structure confirms control. In expansion phases, size must stay anchored to predefined limits because invalidation distance widens when liquidity thins. This keeps risk mathematically stable while confidence psychologically fluctuates.
The second guardrail is daily narrative rebuilding. Bias is constructed from the higher timeframe story, not the previous trade’s outcome. If the weekly and daily structure have not changed, your job is to wait for liquidity incentives and micro-structural permission before expanding exposure. A trader who rebuilds bias every session stays psychologically neutral when the market is structurally neutral.
The third guardrail is retest discipline. A retest is not a candle. It is acceptance. The retest validates participation, reduces invalidation distance, and reveals whether the market internalized the structural break or sweep. Entering before the retest is entering during the liquidity hunt. Entering after the retest is entering after participation is proven. This is where professionals position, not because they are late, but because they are validated. Retests compress emotional cycles because they remove the need to hope a level will hold.
The fourth guardrail is execution quality scoring.
Track trades by sequence: liquidity taken first, structure broken second, displacement confirmed third, retest respected fourth. Grade your execution on fill precision, conditional sizing, and narrative alignment. This shifts confidence from results to behavior, which compounds careers instead of compressing them.
A journal becomes a solution only when it measures variables that lead to intervention, not reflection. Measure session volatility, invalidation distance, average R:R delivered, liquidity incentives present, and whether the entry occurred inside premium or discount relative to equilibrium. This reveals inflation risks before they hit your equity curve.
Emotional inflation loses its power when you treat streaks as feedback, not permission. The best funded crypto traders do not compound because they avoid risk. They compound because they only expand risk when the market contracts volatility, aligns liquidity, and confirms structure. Confidence should drive preparation, not replace it.
Calibration compounds. Inflation decays. Careers are built by traders who stay calibrated longer than they stay confident temporarily.

The Most Common Entry Mistake Traders Never NoticeMost traders do not lose because their strategy is flawed. They lose because they enter trades before the market has actually shown its intent. This mistake is subtle, easy to justify in the moment, and repeated so often that it becomes invisible. Over time, it slowly erodes consistency and confidence.
The problem usually starts with anticipation. Price approaches a key level, a wick forms, or a candle closes in the expected direction. The setup looks familiar, so the trader assumes the market is ready to move. But at that stage, nothing has been decided. The market is still neutral. What feels like early positioning is often just guessing inside uncertainty.
Markets do not move to reward speed. They move to collect liquidity. Before any meaningful expansion, price typically sweeps highs or lows, triggers stops, and tests obvious areas of interest. Traders who enter too early place themselves directly in this process. When price reverses and stops them out, it feels like bad timing, but structurally the market was doing exactly what it needed to do.
A key misunderstanding is believing that a level being touched equals intent. It does not. A reaction alone is not direction. Real intent only appears after the market responds with structure. This means a clear break in micro structure, decisive movement away from the level, and follow through that shows one side has taken control.
Another common trap is confusing speed with strength. Fast candles into a level can feel convincing, but aggressive moves without confirmation often lead to exhaustion rather than continuation. Strength is not defined by how quickly price reaches a level, but by what it does after that level is tested.
Confirmed entries are patient. Liquidity is taken first. Structure shifts second. Momentum expands third. Often, price returns to retest the area and prove acceptance. This sequence lowers risk and removes emotional pressure from execution.
Early entries are built on hope. Confirmed entries are built on evidence. Waiting does not make you late. It keeps you out of trades that were never ready to work.

Why Most Backtests Fail in Live MarketsBacktests often look convincing because they operate in a world that does not exist in live trading. Historical data is clean, fills are perfect, and execution is assumed to be instant. In reality, markets are driven by liquidity, friction, and uncertainty, none of which show up properly in hindsight testing.
The first failure point is liquidity. Backtests assume you can enter and exit at any price shown on the chart. Live markets do not work that way. At key levels, price accelerates, spreads widen, and partial fills occur. What looks like a precise entry in a backtest often becomes slippage or a missed fill in real time, especially during news, session opens, or liquidity sweeps.
The second issue is spread and fees. Many strategies survive on thin margins. A few ticks of spread expansion or commissions per trade are enough to flip a positive expectancy into a losing one. Backtests that ignore realistic costs create false confidence and encourage overtrading systems that cannot survive friction.
Execution timing is the third blind spot. In hindsight, confirmation is obvious. Live, confirmation unfolds candle by candle. Strategies that rely on exact closes, perfect retests, or instant reactions break down when hesitation, latency, or human execution enters the process.
To stress-test ideas realistically, remove precision. Add slippage assumptions, widen stops slightly, delay entries by one candle, and test during different market regimes. If a strategy only works under ideal conditions, it is not robust. Robust strategies survive imperfection.
Backtests are not useless, but they are incomplete. They should test logic, not profitability. Live viability comes from understanding how liquidity, cost, and execution pressure reshape every idea once real money is involved.

Mastering MACDTurning a Popular Indicator Into a Structured Decision Tool
Many traders use MACD as a simple signal generator. They see a crossover, enter a trade, and later realise the result does not match the expectation. MACD becomes useful only when it is applied inside a clear framework built on trend, momentum, and timing. Its real value lies in reading shifts in participation rather than delivering standalone entry signals.
Understanding what the indicator represents is the first step. MACD measures the relationship between two moving averages and reveals how fast price is accelerating or slowing down. The histogram shows the rate of change. When used with intent, MACD helps you read the strength behind a move instead of trying to predict direction. Momentum confirms structure and brings clarity to the decision process.
Define the market environment before looking at MACD. Trending markets and ranging markets produce different behaviours. In a trend, a rising histogram often supports continuation and helps you judge whether a pullback is healthy or the start of a deeper rotation. In a range, the histogram moves around the zero line and highlights areas where momentum is fading. Without this context, MACD signals tend to mislead more than they help.
The next step is aligning MACD with the locations your system already relies on. Use it as part of the confluence, not as a trigger. When price reaches a higher-timeframe level, a liquidity area, or a clear structural pivot, the histogram can show whether momentum is shifting in your favour. You are not asking MACD to discover the trade. You are using it to confirm the logic you have prepared.
With structure and location in place, create specific decision rules for MACD behaviour. Examples include shrinking momentum when price approaches a level, expansion that supports a breakout, crossovers that match the higher-timeframe direction, or divergences that signal exhaustion at important zones. Every rule needs to serve a practical purpose. Reacting to every crossover removes discipline and weakens the system. Well-defined conditions make MACD a reliable filter.
Risk management remains outside the indicator. MACD does not define stops, invalidation, or how much to risk. Those rules come from structure. Stops should respect swing highs or lows, well-defined invalidation areas, or volatility-based distances. Combining this approach with MACD’s momentum read protects you from chasing trades that lack strength and reduces over-engagement during slow conditions.
Validation closes the loop. Backtest the exact behaviours you rely on, not the indicator as a whole. Study how histogram shifts behave at your chosen levels. Compare momentum against structure. Track how timing improves when MACD is used to refine execution instead of generate entries. When the data confirms the rules across different market conditions, the system gains stability.
MACD becomes a valuable asset when integrated into a disciplined process. On its own, it produces too much noise. Inside a structured system, it sharpens momentum reading, filters out weak trades, and builds cleaner execution. Traders who use MACD to support their framework instead of driving it achieve far greater consistency over time.

How to Use VWAP in Confluence with StructureVWAP is one of the few indicators that consistently adds value when used correctly. It does not predict direction and it does not replace market structure, but it provides a powerful reference point for where fair value sits within the current session or trend.
When combined with structural analysis, VWAP helps you filter trades, improve timing, and avoid impulsive entries that fight the underlying flow.
The first step is understanding what VWAP represents. It shows the average price weighted by volume, reflecting where most transactions have occurred. When price trades above VWAP, it signals that buyers are in control of the session.
When price trades below it, sellers dominate. This context becomes meaningful only when it aligns with the higher timeframe structure.
Start by establishing your bias through market structure.
If the higher timeframe is in an uptrend and price trades within a discount zone, VWAP becomes a dynamic confirmation tool. A reclaim of VWAP after a liquidity sweep or after a break of structure is one of the cleanest signals that buyers are stepping back in.
The same applies in reverse for downtrends: a VWAP rejection after a pullback into premium strengthens the short bias.
VWAP also adds clarity during intraday consolidation. Ranges often form around VWAP because it reflects the session’s equilibrium. Breakouts that occur away from VWAP without pullbacks frequently lack durability.
However, a breakout followed by a retest of VWAP shows acceptance and builds confidence in continuation. This combination turns a common indicator into a reliable filter rather than a standalone signal.
Another effective use of VWAP is identifying exhaustion. When price aggressively pushes far above or below VWAP, it often signals that the move is extended. This does not mean you fade the trend, but it does mean you tighten expectations and wait for structure to align before entering. Once price reconnects with VWAP and shows intent, the next move becomes more sustainable.
VWAP becomes particularly powerful when paired with session logic. Trading above VWAP in a bullish higher timeframe environment during London or New York sessions often leads to cleaner impulses.
Trading against VWAP during low-volume hours produces far more false signals. Timing, structure, and VWAP together create a cohesive framework.
Used in confluence, not in isolation, VWAP supports disciplined decision-making.
It aligns entries with momentum, filters low-quality setups, and clarifies whether the market accepts or rejects a level. When you combine VWAP with structure, liquidity, and session context, your trades become more intentional, less emotional, and significantly more consistent.
Journaling For Traders: Turning Random Results Into A Feedback Most traders spend years tweaking indicators and strategies while leaving their process undocumented. Without a journal, every trade feels new, every mistake repeats, and progress stays vague. A structured journal turns experience into data. It shows what you do well, what keeps failing, and which behaviours appear before your best and worst decisions.
The first step is simple: record every trade. Log the setup, market structure, entry reason, risk, and emotional state. Write whether you felt rushed, confident, bored, or frustrated. Do not only record wins or big losses. Incomplete data keeps blind spots alive.
The real value appears during weekly review. Set time aside after markets slow down and go through the trades as a batch. Look for recurring situations. You may notice that late-session entries perform poorly, that you increase size after wins, or that you cut trades early when size feels uncomfortable. These patterns are not visible inside a single session. They emerge only over a cluster of trades.
Next, extract insights. Group trades by setup, session, and emotional state. Identify your highest quality combinations. For example, trend continuation trades in London with fixed risk might show a strong performance profile while countertrend entries in low volume hours consistently underperform. This step separates what you think works from what actually delivers.
Finally, adjust strategy. Turn observations into rules. Reduce or remove the behaviours that repeatedly drain capital. Formalise the conditions that define your best trades. Add small process rules rather than full rewrites, then track the impact in the next review cycle. Over time, your playbook becomes evidence based rather than theoretical.
Journaling is not an extra task for perfectionists. It is the operating system behind professional execution. When you continuously record, review, extract, and adjust, your trading process compounds in quality even when individual weeks are difficult.
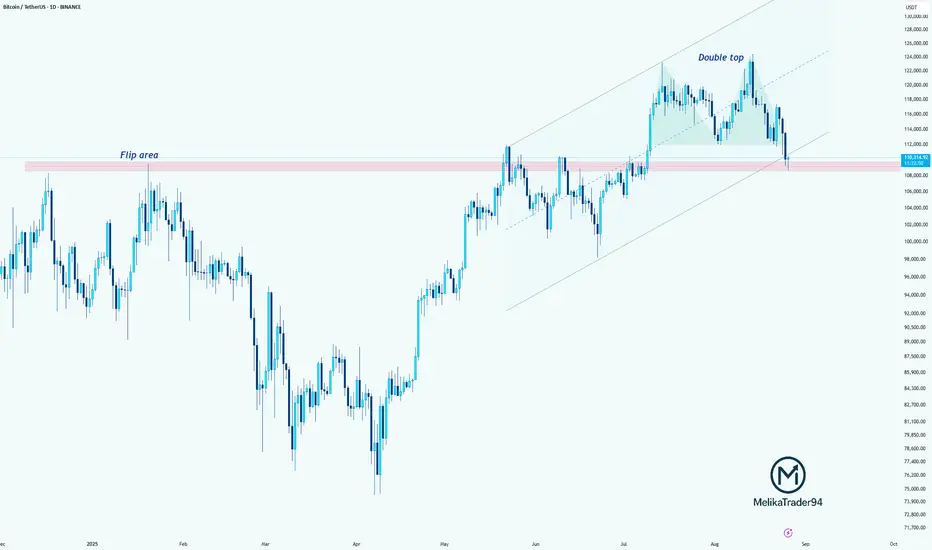
Bitcoin Price Action: Double Top vs. Monthly Flip ZoneHello guys!
Bitcoin’s chart is getting really interesting right now.
First off, BTC recently put in a double top up around the $124K area. Classic bearish signal. Once it lost the neckline, it confirmed the pattern, and at the same time, it broke down out of its rising channel. That’s two bearish signals stacking up.
But here’s the twist... right now, price is sitting right on top of a monthly Flip zone (that pink area on the chart). This level used to be heavy resistance for a long time, and now it’s trying to act as support.
So basically, we’ve got a kind of bottle-neck situation:
- On one side, the double top breakdown is pointing lower.
- On the other side, the monthly Flip is saying “not so fast.”
Personally, I think the Flip zone might carry more weight. When a level holds this strong on the higher timeframe (monthly), it often overrides short-term bearish structures.
If BTC respects this pink zone, we could see another bounce and maybe even invalidate the double top’s bearish follow-through. But if it breaks clean below, then the double top plays out fully and things could get uglier.
For now, this zone is the battlefield.
Why you should never HOLD a boring trade - Rule I followGet in and get out in the shortest time possible.
This is the science of successful trading.
But what happens when a trade turns out to be more like a non-performing investment?
When you hold a long-term trade, there are a few issues that will follow including the:
Opportunity cost
You can find other higher probability trades, instead of having your money tied up aimlessly in a sluggish market.
Unnecessary impatience
You’ll eventually feel rather anxious and frustrated holding onto a long-term trade, when you are better off trading in a market that is moving.
The fake-out
With an ongoing trade, the breakout pattern may fizzle out into a low probability fake-out trade (a trade that turns against you).
I created a rule to avoid this situation from ever occurring again.
I call it a time stop loss...
After 7 weeks of holding a trade, exit the trade and look for a better opportunity.
Worst case you take a smaller loss than you thought.
Best case you take a smaller profit than you expected.
But you'll stop holding trades that aren't performing and stop paying daily costs with trading....
Sound good?
Trade well, live free.
Timon
MATI Trader

Dow Jones daily bearish pattern Dow Jones on a daily timeframe making a bearish pattern called double top aka known as M pattern
The two tops on charts marked with rectangle box
This +500 can be short covering
Wait for Dow Jones to break its double top
If it breaks we may see some good upmove in Indian stock market too
Its bearish pattern can affect the Indian stock market little bit If it's successfully breaks it's top we may see good major upmove

Ripple Lawsuit: ETHThis week is a pivotal moment for cryptocurrency. Ripple Labs is being sued by the U.S. Securities and Exchange Commission (SEC), which has accused it of selling unregistered securities. Ripple is the organization that develops XRP (CRYPTO:XRP), one of the world’s most popular cryptocurrencies. The SEC is accusing Ripple of having conducted a $1.3 billion securities offering by selling XRP to the public. The lawsuit is seeking that Ripple return all the money it raised, plus interest. If the SEC wins, it will establish a landmark precedent, and the implications reach far beyond Ripple itself. In this article, I will explore how the Ripple lawsuit could have wide-ranging implications for other crypto projects — notably Ethereum (CRYPTO:ETH).

The Economist magazine Cover Analysis - Dollar - BTC - GoldThe Economist magazine is always very good at predicting the future. This poster belongs to them. Today, I wanted to analyze what we weren't told. I suggest you read the article about this photo in the magazine.
The Economist Article Click
The analysis will look a bit similar a coffee fortune, but please try reading it without laughing:)
Let's first start with the rabbit ;
Rabbit means luck in many beliefs.
I guess there's no who doesn't know about Easter.
Time clock on The rabbit hand. At the end of time, there is an image as if he will have something or what he expects will come true.
Rabbit eggs were also associated with taxation in ancient times.
Given the details about the money I will explain in the rest of the article, it is possible to think of a tax increase.
The rabbit also symbolizes the resurrection. When we think about the economic problems in post-coronavirus countries, we can interpret this as the end of disease and the revival of the economy.
Easter is important in March and April. If this picture really means anything, we might think the economy will pick up in March and April. Bitcoin's first rise was also in March.
Time: 10: 10 or 22: 10 or 11: 10-23: 10
10/10/2021 or 22/10/2021 I think you have to be careful on those dates.
Because in these pictures, there are no extras drawn unnecessarily.
There's a cat in the picture below. They have excited eyes. I think this cat's a little greedy. In other words, I believe that the greed index will increase for many commodities in the coming days.
I recently did stocks, gold, crypto currency analysis. These commodities said something in common. While I was doing this, the diffusion and simulation analyses pointed to the second week of October.
Taking the cat's view as greed, I think there will be a significant recovery in the economy in October.
Here's our greedy cat
Now let's look at the commodities step by step.
This our normal currency.
It looked worried and scared. At the same time, I see a libra symbol in the symmetry of its eyes. Maybe I'm wrong.
But if it really is the a pair of scales, the stock market will panic while trying to control balance losses due to greed. The countries ' central banks will try to take measures to address this economic imbalance. That's why I mentioned at the beginning of the article that rabbit eggs symbolize tax.
When we look at other currencies;
BTC is out of balance and about to go upside-down.
The Dollar is trying to prevent something, but I guess it can't.
Stocks run downhill
The banks left themselves directly from top to bottom.
Ethereum was the first to jump into the pit.
The reason Ethereum jumped into the hole could be that it lost market control over altcoins.
Another reason is;
As is well known, many tokens are traded on the ethereum network. But it seems that this requirement will disappear for the nft. DUE TO THE HIGH COST OF ETHEREUM GAS FEES, THERE HAVE BEEN ALTERNATIVE SEARCHES.
Alternative networks such as TRX and BSC, which are much cheaper in cost, have begun to be produced. Manufacturers Who Do Not Want To Lose Their Income In Nft Will Turn To These Alternative Models.
Moreover, some NFT producers are required to hold other currencies such as Matic BNB and use their networks.
Given all this, if it does not develop a new solution for itself, it will be the currency that loses its value the most.
Given the terms of BTC; many investors are actually uneasy about BTC controlling the market.
But no force has been created to security that control. The interventions of stock markets, governments and investors could not stand in the way of BTC's strength.
But see by the nftt, it looks like it could stop the force. Currently BTC has no role in NFT trading. If nft becomes the new digital trading model, BTC will stand alone and lose value.
Some big investors of BTC, which we call whales, dominate the market. If they face this risk, they will want to drain all their stock.
This will result in the death of BTC, which the states have failed to achieve. If we think of BTC as a human being, he is nothing but a spoiled old man who must die in my eyes.
BTC , It's a toy in the hands of some big investors acting on their own ambitions. These investors do not understand that their greed brings their own demise.
That's why alternative models have been produced for years.
New coins, especially Ethereum, have been produced. Exchanges invented their own currency against BTC to minimise manipulation. Example Bnb Busd etc.
In particular, this year, the exchanges have begun to manipulate the exchanges themselves, in order to take their losses from btc fluctuations.
They tried to make their lost profits on the BTC by blowing up long order and short order.
Because within 30 minutes, goods don't go up by 20% and lose 30% back in value. It's a greedy move that covets the small investor's money.
There can be no such manipulation in the NFt.
There's a product in the market . The owner is known and the price is known.
No one can change the price until the end of the ad period.
Owner might refuse to sell, but have nothing wrong with doing so. You don't have to trade in BTC or dollars. There will be many currency models.
Most importantly, big investors will not be able to manipulate the NFT market too much.
All the power will be with investors. Few people will be able to decide what happens. Countries will see it as digital art and use it as a weapon against BTC. They will give full support to the NFT.
That's why we see that BTC has upside-down and is going to fall.
We will experience digital transformation for primitive ages. So I can explain it this way;
in the past, we used to buy flour by giving wheat and you used to make a living by selling the wheat you bought to someone else.
That's exactly what the NFT will do. For example, you will get Matic. The holder investor will win.
You will get MATIC NFT, the NFT manufacturer will win.
You sell the NFT you bought, you make a profit.
I should also note that; the robot software will be minimal. Because art appreciation here is work done with human emotions. Big investors will certainly find a new manipulation model with their own algorithms to sell the collections they produce at a more high price. But it doesn't concern us. Because its price no longer affects our money.
If we look at the stock market; they will also be negatively affected. Because to trade a stock, you have to follow a lot of things. Company balance sheets, commercial agreements, public offerings.
There are only two things to follow in the NFT;
1) Your feelings
2) The amount of your money and your purchasing power.
We talked about the fear and prevention efforts of the dollar.
As we know, the dollar is the dominant force in many currencies.
Dollars has the power to turn the country's economy upside down in one day. This is because it disrupts the balance of imports and exports and the socioeconomic structure of dollar-dependent countries is low.
People suffer from crazy hours and low salaries for fear of being unemployed and making a living. But with the proliferation of NFT, just like youtubers, anyone with a computer and the Internet will be able to make money.
The world's economic comfort will grow. Maybe Countries might find solutions to increasing refugee problems in this way. Therefore, the dollar's voice will decrease in countries with increasing economic development. So we see the dollar's expression of panic.
So why are banks jumping down the hill?
There is a new ecosystem to be created. New digital and economic tools. Banks need to track and integrate all these systems. They might even need to integrate into the blockchain network.
Besides, stocks, investment accounts and loans are the banks ' main income. The spread of the digital money culture with NFT will lead to new investors in crypto money.
No-cost and more profitable deposit accounts, more interest, investment opportunities and your money gaining value at all times.
No risk of fraud and bankruptcy,
Quick transfers and easy money-making.
If banks cannot operate like cryptocurrency exchanges, in the future the word bank will be among the unknown words.
There's magic mushrooms in the picture.
As you know, these mushrooms are used both as a drug and as a hallucinogen. It causes more hallucinations than drunkenness.
I interpret it two ways.
1-Since it will be easier for young people to access money, drug addiction may increase.
2-When people get rich financially, they live in fear of disappearing because they don't understand how it happened suddenly. Just like a hallucination.
Can everything be so beautiful?
Of course not!
The crypto money industry's biggest problem is the energy problem. Improvement and development efforts for this problem are still ongoing. However, environmental problems will increase in direct proportion to the increase in the use of digital systems in the future.
If digital transformations can't adapt to energy use and reduce energy costs, it will become a problem that people can't give up but can't find a solution to.
I think the trees cut in the picture express that as well.
Now this picture;
Everything can't be perfect. Due to the nature of blockchain technology, it does not seem possible to be exposed to hacking attacks at the moment.
Also, it is not possible to break the SHA512+sha256 encryption it uses with current technology. It is not possible to drill standard contracts such as solidity and erc20, which have a part-to-whole and a whole-to-part control structure.
But in this image, we see a snake with an crypto walking towards the nft object.
Not everyone can write cryptocurrency software. But anyone can produce nft. With Nft, easy access to blockchain networks and the proliferation of digital wallets will lead to major hacker attacks in the future. Because for the first time, everyone will have easy access to the blockchain network.
If they can find a loophole by creating an algorithm, an entire network could collapse. In this way, institutions and investors integrated into the attacked network lose everything. It leaves almost irreparable damage.
That must be exactly why this snake is trying to dig a hole in this nft. It goes down the rabbit hole and serves other purposes.
I won't comment on our daughter Alice in the photo. We will find out together in the future what it is.
Note: This is not investment advice.

✅CAN GOVERNMENTS BAN BITCOIN?🚀
CAN GOVERNMENTS BAN BITCOIN?
The rise and rise of the payment means that are not under the government control has been a thorn in the butts of all governments for the last 3 or so years. And as the price of bitcoin was storming the new heights during the lockdown rally the chatter of the need to ban/control/confiscate/tax were getting louder and louder
The motivations of the governments for this move are just as transparent as they are despicable for us, the people.
But before I dive into the analysis of the situation, which seems to be far away from butterflies and unicorns, I must reveal my bias, to avid being accused of being a crypto skeptic by the local mob of crypto bugs.
I consider myself a libertarian, which means that I believe in Individualism, limited government, peace, tolerance, and free markets. That makes me a natural crypto enthusiast, as decentralized finance is a path to a freer more open society with the alternative to the fiat money issued by the governments, which might act as a check on their inflationary and spending appetites. I was an early fan of Bitcoin and I hold a crypto portfolio myself.
Now, governments by definition don’t share libertarian values, thus whatever is seen as a benefit from the freedom-loving perspective is evil to the governments. And the lack of surveillance capabilities and the fact that crypto might compete with the precious fiat paper are the reasons why any government will seek to ban crypto at some point in the future. One more serious problem for the state is that crypto, thanks to its relative anonymity might allow people to avoid paying taxes, which causes ire among the officials.
As always, reasons for the ban that will be cited to the public will have nothing to do with reality . Among those, is the need to clamp down on the black market, online drug sales, tax evasion might be mentioned as well and all that will be served under the sauce of protecting us, the little guys.
Interestingly enough, the governments are racing to launch their own electronic currencies , because, just as one might design a coin to be untraceable, one might design it to be 100% traceable as well. In addition to that, if all of us have our bank accounts with the central bank , entirely new forms of previously impossible ways to control the people emerge. Central bank’s Electronic money can be restricted geographically, or in any other way, for example, banning you, personally, from buying burgers, because some bureaucrat thought that you are too fat, while feeding all the info about your speeding directly to the CB . All it will take to leave you penniless is turning off your account with the CB . Absolute control over the economy of the likes of which even the Soviets could not have dreamt of.
But now that we arrived at the obvious conclusion that the governments have more than enough reason to go for a ban, let’s examine whether they have the means to do so and what will that do to the prices.
And unfortunately, I happen to be quite pessimistic on this front. All it would take is a law banning crypto. Of course, If a small country bans Crypto it will affect neither its price nor its usability even for the country’s residents, however, if such a law is passed by the EU, or the USA, it's game over.
You see, most of the technologies that changed our lives in the last 20 years have one thing in common, which is the network effect. The internet, social media, and online platforms such as Uber or Amazon, benefit from the fact that the more people use their service the more valuable the network is and hence even more people join in to use it, while the benefit for those already using It increases.
The same goes for Crypto. In the last years, we’ve seen more and more companies starting to accept bitcoin as payment, while purchasing it got easier and easier. There are even Bitcoin ATMs where I live, that allow customers to buy and sell crypto for cash which is super convenient.
The Bitcoin brand itself is probably worth more than 100 billion dollars , thanks to the fact that even the older people have heard about it by now.
And all that was pushing the price higher, as the expectations of further growth justified 1 million dollars per Bitcoin in the not-so-distant future.
However, if there is a major government such a the US that issues a blanket ban, all companies that accepted crypto will cease doing so immediately, and the crypto marketplaces and exchanges will cease to function and stop accepting payments from that jurisdiction. If it is the US that bans crypto, it would mean a de fact ban on using dollars to buy it, which would make this technology unusable for most of us. The state might take it a step further and make transacting in crypto, or even just holding it a criminal offense, which would reduce the number of people using it to the few shady cartels south of the border. The ban would also make mining impossible, and as we know mining not only creates now coins but is also essential for the functioning of the network. Without it, transactions would be impossible. Therefore, the user base will be limited by the mining capacity left in the world, drying up transaction fees making it even harder to use. Hedgefunds and those who are important to the system will be warned about the ban beforehand, so it will be us, the little guys who will lose our savings. The price will collapse as leveraged players will be trying to exit the asset, causing panic and a massive selloff.
And for those who say that «this is impossible simply because this is impossible»(read, I still trust the government) let me remind you of how unceremoniously gold was essentially banned from using it as means of exchange by the US government with the gold confiscation act of 1933.
The robbery of the century- something that was unimaginable and unheard of previously, was done peacefully with the stroke of a pen and everyone obeyed and traded in their gold for the Fed papers. And keep in mind that gold was far more widespread, used, and relied on that crypto now, which means that if the Ban of crypto came in today, there would be no mass riots on the streets.
So, please, excuse my pessimism when I say that when not if the powerful nations of the world decide to ban our fancy shining coins of liberty, they will succeed . And I am of an opinion that this will happen sooner rather than later, because «they» can not let the whole thing get too big to fail. What I mean is that if the market cap of all the coins is 1-3 Trillion, they can handle the damage of wiping off this wealth. However, if it gets to 10-15 Trillion the consequences of the collapse might destabilize the system itself.
In conclusion, as much as I don’t want this to happen, the ban is not only possible but highly likely and will come sooner rather than later, with the early birds of partial bans being India and China showing us the way. However, that does not mean that we can’t enjoy a couple more of the bullish waves making 100-300% and enriching ourselves hand over fist, which is why we’ve all gathered here, at the end of the day! Just jump off the train before the wheels fall off!
Thanks to all who read the text with so many letters in it.
I am expecting a fiery discussion in the comments!

✅CAN GOVERNMENTS BAN BITCOIN?🏛
CAN GOVERNMENTS BAN BITCOIN?
The rise and rise of the payment means that are not under the government control has been a thorn in the butts of all governments for the last 3 or so years
And as the price of bitcoin was storming the new heights during the lockdown rally the chatter of the need to ban/control/confiscate/tax were getting louder and louder
The motivations of the governments for this move are just as transparent as they are despicable for us, the people.
But before I dive into the analysis of the situation, which seems to be far away from butterflies and unicorns, I must reveal my bias, to avid being accused of being a crypto skeptic by the local mob of crypto bugs.
I consider myself a libertarian, which means that I believe in Individualism, limited government, peace, tolerance, and free markets. That makes me a natural crypto enthusiast, as decentralized finance is a path to a freer more open society with the alternative to the fiat money issued by the governments, which might act as a check on their inflationary and spending appetites. I was an early fan of Bitcoin and I hold a crypto portfolio myself.
Now, governments by definition don’t share libertarian values, thus whatever is seen as a benefit from the freedom-loving perspective is evil to the governments. And the lack of surveillance capabilities and the fact that crypto might compete with the precious fiat paper are the reasons why any government will seek to ban crypto at some point in the future. One more serious problem for the state is that crypto, thanks to its relative anonymity might allow people to avoid paying taxes, which causes ire among the officials.
As always, reasons for the ban that will be cited to the public will have nothing to do with reality. Among those, is the need to clamp down on the black market, online drug sales, tax evasion might be mentioned as well and all that will be served under the sauce of protecting us, the little guys.
Interestingly enough, the governments are racing to launch their own electronic currencies, because, just as one might design a coin to be untraceable, one might design it to be 100% traceable as well. In addition to that, if all of us have our bank accounts with the central bank , entirely new forms of previously impossible ways to control the people emerge. Central bank’s Electronic money can be restricted geographically, or in any other way, for example, banning you, personally, from buying burgers, because some bureaucrat thought that you are too fat, while feeding all the info about your speeding directly to the CB . All it will take to leave you penniless is turning off your account with the CB . Absolute control over the economy of the likes of which even the Soviets could not have dreamt of.
But now that we arrived at the obvious conclusion that the governments have more than enough reason to go for a ban, let’s examine whether they have the means to do so and what will that do to the prices.
And unfortunately, I happen to be quite pessimistic on this front. All it would take is a law banning crypto. Of course, If a small country bans Crypto it will affect neither its price nor its usability even for the country’s residents, however, if such a law is passed by the EU, or the USA, it's game over.
You see, most of the technologies that changed our lives in the last 20 years have one thing in common, which is the network effect. The internet, social media, and online platforms such as Uber or Amazon, benefit from the fact that the more people use their service the more valuable the network is and hence even more people join in to use it, while the benefit for those already using It increases.
The same goes for Crypto. In the last years, we’ve seen more and more companies starting to accept bitcoin as payment, while purchasing it got easier and easier. There are even Bitcoin ATMs where I live, that allow customers to buy and sell crypto for cash which is super convenient.
The Bitcoin brand itself is probably worth more than 100 billion dollars, thanks to the fact that even the older people have heard about it by now.
And all that was pushing the price higher, as the expectations of further growth justified 1 million dollars per Bitcoin in the not-so-distant future.
However, if there is a major government such a the US that issues a blanket ban, all companies that accepted crypto will cease doing so immediately, and the crypto marketplaces and exchanges will cease to function and stop accepting payments from that jurisdiction. If it is the US that bans crypto, it would mean a de fact ban on using dollars to buy it, which would make this technology unusable for most of us. The state might take it a step further and make transacting in crypto, or even just holding it a criminal offense, which would reduce the number of people using it to the few shady cartels south of the border. The ban would also make mining impossible, and as we know mining not only creates now coins but is also essential for the functioning of the network. Without it, transactions would be impossible. Therefore, the user base will be limited by the mining capacity left in the world, drying up transaction fees making it even harder to use. Hedgefunds and those who are important to the system will be warned about the ban beforehand, so it will be us, the little guys who will lose our savings. The price will collapse as leveraged players will be trying to exit the asset, causing panic and a massive selloff.
And for those who say that «this is impossible simply because this is impossible»(read, I still trust the government) let me remind you of how unceremoniously gold was essentially banned from using it as means of exchange by the US government with the gold confiscation act of 1933.
The robbery of the century- something that was unimaginable and unheard of previously, was done peacefully with the stroke of a pen and everyone obeyed and traded in their gold for the Fed papers. And keep in mind that gold was far more widespread, used, and relied on that crypto now, which means that if the Ban of crypto came in today, there would be no mass riots on the streets.
So, please, excuse my pessimism when I say that when not if the powerful nations of the world decide to ban our fancy shining coins of liberty, they will succeed. And I am of an opinion that this will happen sooner rather than later, because «they» can not let the whole thing get too big to fail. What I mean is that if the market cap of all the coins is 1-3 Trillion, they can handle the damage of wiping off this wealth. However, if it gets to 10-15 Trillion the consequences of the collapse might destabilize the system itself.
In conclusion, as much as I don’t want this to happen, the ban is not only possible but highly likely and will come sooner rather than later, with the early birds of partial bans being India and China showing us the way. However, that does not mean that we can’t enjoy a couple more of the bullish waves making 100-300% and enriching ourselves hand over fist, which is why we’ve all gathered here, at the end of the day! Just jump off the train before the wheels fall off!
Thanks to all who read the text with so many letters in it.
I am expecting a fiery discussion in the comments!

How “SIMPLE” it is to Trade for a LivingWe just reached +1K followers here so This article/post is a thank you for each and every one of you.
Short answer: not easy but doable if done the proper way (my story at the end)
Long answer: trading for a living is a fantasy every trader has. however, to be accomplished it requires a strong mindset, a proven record with an objective well-defined trading plan, a trading journal to learn from your mistakes and keep improving, financial stability, consistency…
Forget about these gurus taking pictures driving a Ferrari and partying all year, traveling the world, and trading on the beach. (these so-called gurus use it as a marketing plan to attract people on their pages)
Before I tell how you can trade for a living, let us consider these two aspects:
Psychological Aspect: you shouldn’t depend on your forex account as your main income (to pay your monthly bills) as you will get emotional, make irrational mistakes, and you will end up not following your trading plan objectively. consequently, you will be afraid that you won’t profit this week/month, thus won’t be able to pay your bills.
Technical Aspect: you shouldn’t withdraw from your account frequently (every month/year for example). Let’s say your account is 10 000$ and you managed to make a 100% growth by end of the year. so your account is now 20 000$.
Because you need to pay bills, you will have to withdraw the profits, so you are left with 10 000$ once again. To make another 100% next year to pay your bills again. so you are not getting any further and still stuck in the rat race.
The right way is to keep your profits for your account to grow exponentially. For example, if you have 10 000$ and you make a 100% return this year, your account is now 20 000$, you keep the profits, and your 1% per trade is now 200$ instead of 100$, by end of the second year you also make 100%, now you have 40 000$ and so on…
As per the above two aspects, you shouldn’t withdraw from your account frequently ☝️
how to treat forex then? and how to be able to trade for a living? 👇
You have two options:
1- Have another source of income: like a job or a business that you depend on to pay your monthly bills. This way you won’t get emotional in trading and you won’t withdraw from your account for it to grow exponentially
2- Savings / my story: I quit my job on July 5th, 2018 to trade for a living. My plan was to save an amount of money, enough for me to live the same lifestyle I am used to for 2 years from now, without the need to withdraw from my account.
For example, if my usual monthly expenses are 1000$, then I need to save 24 000$ before I quit my job. this way, I can survive for two years without withdrawing from my account or depending on it.
In conclusion, trading as a career is doable but it requires a lot of dedication and planning in order for it to be successful. The most important aspect you need to focus on is being emotionally stable at all times in order to follow your trading plan in an objective manner.
All strategies are good; if managed properly!
~Rich

FILE : SILVERHello, in this article I will try to evaluate the silver that everyone has been eyeing on lately.
0 - INTRODUCTION
What Is Silver?
Silver, a precious metal, is an element commonly used in jewelry, coins, electronics, and photography. It has the highest electrical conductivity of any metal and is, therefore, a highly valuable substance. In many global cultures and religions, silver is used in traditional ceremonies and worn as jewelry during important occasions.
Silver is a precious metal for many reasons: it has historically been used for coinage and jewelry, and it is also highly conductive, giving it many industrial uses.
Investors and traders buy silver through commodities markets.
Most of the world's silver production in 2015 came as a byproduct from lead-zinc, copper, and gold mines.
Source : www.investopedia.com
Silver as Disinfectant
Silver has been used as an antimicrobial for thousands of years. Over the past several decades, it has been introduced into numerous new venues such as in the treatment of water, in dietary supplements, in medical applications, and to produce antimicrobial coatings and products. Silver is often used as an alternative disinfectant in applications in which the use of traditional disinfectants such as chlorine may result in the formation of toxic by-products or cause corrosion of surfaces. Silver has also been demonstrated to produce a synergistic effect in combination with several other disinfectants. Many mechanisms of the antibacterial effect of silver have been described, but its antiviral and antiprotozoal mechanisms are not well understood. Both microbial tolerance and resistance to silver have been reported; however, the effect of silver has been observed against a wide variety of microorganisms over a period of years. Further research is needed to determine the antimicrobial efficacy of silver in these new applications and the effects of its long-term usage.
Source : pubmed.ncbi.nlm.nih.gov
Another article investigating the antibacterial properties of silver:
www.iecpartners.com
Silver Reserves
A lot of dirty information about silver reserves is floating around.
For example, it looks like it will completely end in 2029 ...
We can't say that's %100 true!
Hubbert's model was run for the period of 6000 BC–3000 AD, the SILVER system dynamics model was run for the time range 1840–2340. We have estimated that the ultimately recoverable reserves of silver are in the range 2.7–3.1 million tonne silver at present, of which approximately 1.35–1.46 million tonne have already been mined. The timing estimate range for peak silver production is narrow, in the range 2027–2038, with the best estimate in 2034. By 2240, all silver mines will be nearly empty and exhausted. The outputs from all models converge to emphasize the importance of consistent recycling and the avoidance of irreversible losses to make society more sustainable with respect to silver market supply.
Source : www.sciencedirect.com
But we should take into account that between 2027 and 2038, there will not be an abundance of supply as before.
Can the Oxidation problem of Silver be Solved?
Yes, I will briefly summarize the information I have obtained from various sources.
Yes, silver tarnished, but this is a problem that can easily be fixed.
There are practical videos about this on social media.
Since silver has an oxidation and tarnishing problem and is widely used in the industry, it is used in the alloy .
1 - GENERAL ANALYSIS
Let's start.
As seen on the chart, while silver speculator positions decreased, their commercial positions increased considerably :
Since March, the price has increased by more than 100%, while the speculator positions have fallen by more than 50%. (Green)
Commercial positions, on the other hand, increased significantly in the last decline before March.
Here the following should not be forgotten;
Commercial positions are much larger than speculator positions.
Lot sizes are different.
With the rising prices, we see that a little bit of a sales trend has entered. (Red )
Both sides are far from historical highs and historical lows.
The fact that speculators are on the net + and the commercials are also net - show that the trend can continue.
But the following phenomenon I mentioned above:
Since March, the price has increased by more than 100%, while the speculator positions have fallen by more than 50%. (Green)
However, the following fact I mentioned above shows that those who will make evaluations should be prepared for hard retractions.
2 -SUPPORT AND RESISTANCES
Fibonacci Supports :
* 26.772
* 21.877
* 13.965
Fibonacci Resistances :
* 30.727
* 34.683 ( Major Resistance)
* 40.316
* 47.49 ( All time high since 2009 Economic Crisis )
3 - CONCLUSION
Pros
There is still a way to the top.
The partial disinfectant effect can lead to an increase in demand during the pandemic period.
Soaring gold prices create an alternative for silver, albeit temporarily.
If new reserves are not discovered after 2027, the supply may drop.
Cons
Much attention should be paid to the content of silver funds and whether they make parallel movements with commodity silver.
Foam may occur due to speculation.
Silver will always remain the half-brother of Gold.
Gold is also expected to decrease in supply in roughly the same years.
Gold is much more practical and common than silver.
It is also much more reliable and famous for inflation protection.
For many years the price may not see old or new peaks.
4 - SUMMARY
Slight percentage sizes can be preferred to diversify the portfolio.
For example ; 5% - 10% of the ratio given to gold can be divided into silver.
What I write in this section is my personal opinion and is not intended to be investment advice.
I tried to stick to enough sources in the articles.
Hopefully it will benefit investors and traders.
Regards.

Commitment of traders reportWHAT IS IT
The Commitment Of Traders (CoT) is a report issued by the Commodity Futures Trading Commission (CFTC) , one of the most important trading insitutionsof the American government. The report has the purpose of transparently showing market dynamics to the all the people involved or interested in the matter.
The COT report show all currently open positions (open interest) of the future and options market, where 20 or more traders hold positions for an amount greater or equal to the minimum amount amount established by the CFTC .
The report is issued every Friday at 3:30 P.M. (Eastern Standard Time, hence UTC-5). Each report normally contains data until previous Tuesday. CFTC usually receives data on Wednesday morning from the reporting firms (i.e.: Future Commission Merchants, Financial Insititutions, Brokers or International Stock Exchanges). After some verifications, CFTC publish data the following Friday. For each market, data are provided in terms of existing (still open) LONG and SHORT positions.
TYPES OF REPORTS
There are 4 types of report:
1) Legacy
It contains data split by stock exchange. This report has two different variants: "futures only", that contains data related to the futures market only, and "combined", that contains aggregated data for futures and options market. All the reported positions in this report are split in two main market actors categories: Commercials (or Large Speculators) and Non-Commercials
2) Supplemental
It includes contracts related to 13 selected agricultural market commodities. This kind of report split positions in 3 market actors categories: Commercials (or Large Speculators), Non-Commercials and Index Traders. Differently from Legacy report, the Supplemental is provided in the "combined" format only, hence contains data for both futures and options market
3) Disaggregated
This report contains the same data issued in the Legacy report, but with a more detailed drill down in terms of representation. First of all, it presents data split in 5 macro-categories: Agriculture, Petroleum and Products, Natural Gas and Products, Electricity, Metals and Other. Moreover, the report shows open positions/interests of 4 market actors categories: Producer/Merchant/Processor/User, Swap Dealers, Managed Money e Other Reportables. Aggregating data of this report, it is possible to obtain same data of Legacy report, hence this is a detailed view of data contained in the Legacy report. The Disaggregated, as well as the Legacy one, is available as "futures only" and "combined" variants
4) Traders in Financial Futures (TFF)
This report includes contracts related to currencies, US Treasury Bonds, Eurodollar deposits, VIX shares and Bloomberg Index only. The reports shows open interests of 4 market actors categories: Dealer/Intermediary, Asset Manager/Institutional, Leveraged Funds e Other Reportables. Last, also this report is available as "futures only" and "combined" variants
REPORT FORMATS
Legacy and Disaggregated reports are provided in two formats: short (synthetic) and long (extended). Both these formats contain same data, but long format contains also the concentration of open positions in the hands of the major 4 and 8 market investors at the moment of data collection, while short format does not contains any data about concentration.
TFF report is available in long format only, while the Supplemental is available in the short format only.
Report type Scope Format
Futures Combined Long Short
Legacy ✓ ✓ ✓ ✓
Disaggregated ✓ ✓ ✓ ✓
TTFF ✓ ✓ ✓ X
Supplemental X ✓ X ✓
Legacy report
As said above, market actors in Legacy report are divided in 2 categories:
Non-Commercials , or Large Speculators : they are market speculators as well as hedge funds. This category normally uses financial leverage to amplify variation of derivative asset and has an aggressive behavior in the market. They use rigid stop loss policies and, when the market falls below certain levels, they reverse positions on the other side. The main purpose of Large Speculators is not the asset they buy or sell, but to obtain a net profit from the buy/sell cycle. They normally have a trend following behavior.
Commercials buy futures just because they are interested in the underlying asset and try to hedge their financial exposition related to the commercial activity with the assets they are interested in. These market actors hold more than 50% of open positions in the US futures market and normally they go against the price trend: they sell when the market goes higher and they buy when the market goes lower. Their positions on underlying assets normally anticipate market trend, hence they should be carefully monitored
Non-Reportable : are the open position of small investors/traders that normally are on the wrong side of the market. This investors category is usually confused and not disciplined. They do not follow precise rules and are usually dragged by the trend, but they are slow to reverse positions when the market trend reverses.
The following example contains data about "futures only" market for BUTTER, coming from Chicago Mercantile Exchange.
BUTTER (CASH SETTLED) - CHICAGO MERCANTILE EXCHANGE Code-050642
FUTURES ONLY POSITIONS AS OF 03/17/20 |
----------------------------------------------------------------------------------| NON-REPORTABLE
NON-COMMERCIAL | COMMERCIAL | TOTAL | POSITIONS
--------------------------------|---------------------|--------------------------|-----------------
LONG | SHORT |SPREADS | LONG | SHORT | LONG | SHORT | LONG | SHORT
--------------------------------------------------------------------------------
(CONTRACTS OF 20,000 POUNDS) OPEN INTEREST: 11,597
COMMITMENTS
0 2,473 453 10,401 8,149 10,854 11,075 743 522
CHANGES FROM 03/10/20 (CHANGE IN OPEN INTEREST: 753)
0 -127 101 675 796 776 770 -23 -17
PERCENT OF OPEN INTEREST FOR EACH CATEGORY OF TRADERS
0.0 21.3 3.9 89.7 70.3 93.6 95.5 6.4 4.5
NUMBER OF TRADERS IN EACH CATEGORY (TOTAL TRADERS: 47)
0 12 10 28 22 38 34
It is possible to see as in the report is provided the total amount of LONG and SHORT positions for Non-Commercial, Commercial and Non-Reportable actors. Variations from previous week are moreover reported.
In addiction to LONG and SHORT positions, Legacy report contains also the SPREAD amount, that is available for Non-Commercial only, and refers to contracts that are opened LONG and SHORT at the same time. Normally a growing SPREAD value means a high level of uncertainty.
If we calculate NET POSITIONS (NP) for the 3 actors categories, as it's easy to check, the report show a zero-sum scenario:
NP Non-Comm = 0 – 2,473 = - 2,473
NP Comm = 10,401 – 8,149 = 2,252
NP Non-Rept = 743 – 522 = 221
NP Non-Comm + NP Comm + NP Non-Rept = -2,473 + 2,252 + 221 = 0
OPEN INTEREST value is the grand total resulting as the sum of LONG, SHORT and SPREAD positions:
Open Interest = 0 + 453 + 10,401 + 743 = 11,597
Supplemental report
Even the Supplemental report (called also Commodity Index Traders - CIT) shows data in the same manner of Legacy report, but the market actors are 3: Non-Commercial, Commercial and Index Traders.
Non-Commercial and Commercial actors are the same, while Index Traders category has appeared for the first time in January 2007. Before that date, investors that are now reported in this category were scattered in the two existing categories (Non-Commercial and mostly in the Commercial). The creation of Index Traders category has had the purpose to separate that category from Commercials, because Index Traders are not involved in the buy/sell cycle of underlying assets, and are usually managed funds, institutional investors or swap dealers. Index traders are normally interested in passive and longstanding LONG positions, while are not interested in the short-term price fluctuations. It's not unusual that this category start buying when price is falling and technical analysis says that the price falling will be even more deep. Index Traders are hence a counter-part of speculators, who have usually a contrarian habit.
Supplemental report is provided for 13 commodities:
• WHEAT-SRW - CHICAGO BOARD OF TRADE
• WHEAT-HRW - CHICAGO BOARD OF TRADE
• CORN - CHICAGO BOARD OF TRADE
• SOYBEANS - CHICAGO BOARD OF TRADE
• SOYBEAN OIL - CHICAGO BOARD OF TRADE
• SOYBEAN MEAL - CHICAGO BOARD OF TRADE
• COTTON NO. 2 - ICE FUTURES U.S.
• LEAN HOGS - CHICAGO MERCANTILE EXCHANGE
• LIVE CATTLE - CHICAGO MERCANTILE EXCHANGE
• FEEDER CATTLE - CHICAGO MERCANTILE EXCHANGE
• COCOA - ICE FUTURES U.S.
• SUGAR NO. 11 - ICE FUTURES U.S.
• COFFEE C - ICE FUTURES U.S.
Disaggregated report
Market actors of Disaggregated report are:
Producer/Merchant/Processor/User : they are involved in production, handling, packaging or transport of physical assets that is underlying to the future instrument or option. These actors use futures to cover/hedge risks associated to the activities they are involved in that are strictly related to the production of the assets
Swap Dealers : they are subjects that are involved in trading swap contracts related to the commodity and uses futures market to cover/hedge risks associated with swap transactions. The counterpart of a Swap dealer could be a speculative traders, as well as an hedge fund, or a more traditional Commercial subject that is interested in managing risks associated with the commerce activities of the asset
Money manager : to this category belong Commodity Trading Advisor (CTA), Commodity Pool Operator (CPO) or an unregistered fund identified by the CFTC. These subjects are delegated from their clients to do financial operations in their behalf
Other Reportable : all speculative traders that are not belonging in the three previous category are included in this category
Even in this case, the report shows LONG, SHORT and SPREAD positions.
Comparing this kind of report with Legacy, we can see that:
COMMERCIAL = PRODUCER/MERCHANT/PROCESSOR/USER + SWAP DEALERS
NON-COMMERCIAL = MONEY MANAGER + OTHER REPORTABLE
This explains why the report is called "disaggregated". It shows the same data but with a more level of detail especially regarding the actors that hold open positions.
If we take the Disaggregated report about BUTTER for the "futures only" market coming from Chicago Mercantile Exchange (equivalent to the previous example that is showed under the Legacy report section, we see:
:------------------------------------------------------------------------------------------------------------------------------------------------------ :
: Producer/Merchant : : : :
: Processor/User : Swap Dealers : Managed Money : Other Reportables :
: Long : Short : Long : Short : Spreading : Long : Short : Spreading : Long : Short : Spreading :
--------------------------------------------------------------------------------------------------------------------------------------------------------
BUTTER (CASH SETTLED) - CHICAGO MERCANTILE EXCHANGE (CONTRACTS OF 20,000 POUNDS) :
CFTC Code #050642 Open Interest is 11,597 :
: Positions :
: 8,893 6,326 1,048 1,363 460 0 301 180 0 2,172 273 :
: :
: Changes from: March 10, 2020 :
: 244 648 324 41 107 0 -12 -8 0 -115 109 :
: :
: Percent of Open Interest Represented by Each Category of Trader :
: 76.7 54.5 9.0 11.8 4.0 0.0 2.6 1.6 0.0 18.7 2.4 :
: :
: Number of Traders in Each Category Total Traders: 47 :
: 24 18 . . 4 0 . . 0 10 9 :
---------------------------------------------------------------------------------------------------------------------------------------------------------
If we take the categories Producer/Merchant/Processor/User and Swap Dealers and we sum all LONG positions and then subtract all SHORT positions, we obtain an overall NET positions like this:
NP = (8,893 +1,048 + 0 + 0) - (6,326 + 1,363) = 2,252
Now, if we do the same calculation for Commercial category of the correspondent Legacy report (see above) we obtain:
NP = 10,401 - 8,149 = 2,252
This is the confirmation that Disaggregated report contains the split of data reported in the Legacy report, where Commercial category is divided in Producer/Merchant/Processor/User and Swap Dealers. Same calculation would demonstrate that Non-Commercial category in the Legacy report is spitted here in Managed Money and Other Reportable categories.
If we now consider the Disaggregated report and we sum all LONG positions and then we subtract all SHORT positions for each actors category, we obtain:
(8,893 + 1,048 + 0 + 0) – (6,326 + 1,363 + 301 + 2,172) = 9941 - 10162 = -221
Given that the grand total should represent a zero-sum scenario, e can deduce from Disaggregated report that net position of Non-Reportable subjects should be +221, hence a net LONG of 221 contracts, and that is correct, in fact it is possible to obtain the same result from correspondent Legacy report (see above) by subtracting net SHORT position for Non-Reportable actors to the amount of net LONG positions for the same actors. Hence Disaggregated report allow us to calculato also net position of Non-Reportable, even if the data do not explicitly report the value.
Traders in financial futures report
This report is a further view on the market and split market actors in two sides (SELL and BUY) and 4 categories:
SELL SIDE
Dealer/Intermediary : are financial intermediaries who earn by the commissions related to the sell of financial products. Big banks and other financial entities are involved in this activities
BUY SIDE
Asset Manager/Institutional : they are insitutional investors, including pension funds, insurance companies and investment portfolio managers whose clients are mainly institutional entities
Leveraged funds : these are typically speculative funds (hedge funds) and various types of money managers, including the Commodity Trading Advisors (CTA) and the Commodity Pool Operators (CPO) not necessarily registered by CFTC. These subjects can be involved in hedging strategies and arbitrages on their own capital, or even third parties capital
Other reportable : these are all the traders that are not included in previous categories
Differently from Disaggregated report, the TFF report the positions of the mentioned actors categories are not an exact disaggregation of Commercial and Non-Commercial positions reported in the Legacy report. Here each actor belonging to one of the categories mentioned above could belong to the Commercial or the Non-Commercial category in the Legacy report, basing on the decision that CFTC takes during the report creation, that can be different time after time (i.e.: a subject that has already been considered a Commercial one in the beginning, can be shifted to Non-Commercial after a while, depending on the specific activities he is involved during the time, that can change as well). The TFF report is moreover available only in the LONG format
REPORT ANALYSIS
If we properly analyze data in the Commitment of Traders legacy report, we can determine the expectations of each market actor category regarding the market future.
The possibility to know the net positions of Commercial subjects (institutional investors) is the basis to understand the market sentiment. Their influence is, in fact, between 50% and 75% of the entire futures market of S&P500 and from 40% and 60% of Nasdaq100.
It is useful to point out that Commercial subjects, as well as the Non-Commercial, can take arbitrage or hedging positions, or, alternatively, put in place an active management of their portfolios by buying or selling futures on foreign (not US) markets, or, again, have open position on the futures' underlying assets and protect themselves from risks of price variations by taking opposite positions on the futures market. Hence the Commitment of Traders Report is an important thermometer to measure US stock exchange sentiment, but it isn't a tool that, alone, can allow us to predict how financial markets will move. It should be used (as usual) together with other indicators, tools, analysis and perspectives to have a better understanding of what is happening and a good approximation of what is going to happen (most likely).
Commercial subjects are active actors in the futures' underlying asset market and generally sell when the market (price) grows and buy when the price is more convenient (low), hence their activities are contrarian to the logic of speculators. For this reason the Commercial actors are often responsible of market moves and trends. They drag prices and the market with their activities, hence they anticipate and determine the market trends.
Non-Commercial subjects, viceversa, have opposite interests. They want to make money by price variations, hence they buy when the market shows growing prices and sell in the opposite conditions. This behavior is what we call "trend following" approach.
Here are some typical scenarios that we can find by analyzing the Commitment of Traders report:
1) If Non-Reportable actors (small/retail traders) are LONG and Commercial are SHORT, the Non-Reportable actors are most likely going to loose money because the price will go to to the side where Commercial are pushing it (down)
2) On the maximum levels of an asset price (i.e. near significant RESITANCE levels), Non-Reportable are likely pushed to SELL their positions. Then stop loss levels are likely hit and only after the price starts his falling stage
3) If Non-Commercial are LONG and Non-Reportable are SHORT, we are likely in the middle of an UPTREND and there is more space for the price to gro further
4) If Non-Commercial are LONG and also Non-Reportable are LONG, we are likely in the "euphoric" phase of the trend, hence the trend is going to finish soon
5) If Non-Commercial are SHORT, Non-Reportable are upgrading their SHORT positions and Comemrcial slow down their LONG positions, e re likely in the terminal phase of a downtrend
If we accept the hypothesis that Commercial traders hold better information on the market than the others just because they are active actors of the futures' underlying assets (it's their own business!), it is very important to monitor their behaviour in order to understand how they are evaluating the situation related to the specific commodity that is at the center of our interest.
Commitment of Traders Index
An interesting approach to have effective insights from the Commitment of Traders report can be obtained by calculating an index using the report data. Normally Comemrcial net positions are used to calculate the index as follows:
NP (Net Position) = Long Positions – Short Positions
Usually, an interval of 26 periods (weeks) is selected and the calculation to determine the index value is:
COT Index = * 100
The index, expressed as a pecentage value from 0 to 100, reflects net position of Commercials on the basis of last 26 periods. It can be used as an indicator of overbought and oversold zones and can be a good tool to understand where investors are moving.
The index can be also calculated for Non-Commercial or Non-Reportable positions.
Last, but not least, remember that Commitment Of Traders report is released every Friday evening, but contains data up until previous Tuesday, hence a "lagging" effect should be seriously considered in all the analysis that involves it.
The content of this article has solely education purposes and should be not considered trading or investement advise.

Significant level reachedThis pair is on a downtrend and it has just hit a horizontal significant level at 137.663. Either a slight bounce up to the previous high, however a triangle formation indicates that it might break lower past the significant level. RSI looks to be on a downtrend towards the 30.

Top 5 Risk Management RulesTop 5 Risk Management Rules:
1. Only Trade with Risk Capital
-Risk Capital is the amount of money you are willing to lose and do not include your living capital into your trading account!
2. 2% Risk Management
-The 2% Rule prohibits you from risking more than 2% of your account equity on each trade you are entering.
3. 6% Risk Management
-The 6% Rule prohibits you from opening any new trades when your current open risks in your open trades reach 6% of your account equity.
4. 10% Risk Management
-The 10% Rule prohibits you from opening any new trades for the rest of the month when the sum of your losses for the current month and the risks in open trades reach 10% of your account equity.
5. Risk to Reward Ratio
-Only take the trades which provide you at least 1:2 Risk to Reward Ratio
