The 2nd Phase of AI Technology is UnderwayThis tutorial is about discovering how new technologies such as AI have several phases over many years which create growth and speculation in the leading companies.
There are always 3 top contenders for a new technology sub industry. A sub industry is an industry that is within the primary industry.
For example, NASDAQ:GOOG , Open AI, and Anthropic are currently the top contenders for the subindustry: Medical Diagnostics AI. This is just one of many sub industries that will emerge over the next decade and longer.
All 3 companies have the potential to dominate. The #1 will be the most dominant, #2 will be a close second, and #3 will be a distant 3rd. However, all 3 will have potential for excellent swing trading, position trading and also investing.
I discourage day trading as it is extremely challenging and there are now new regulations and a change of the rules governing retail day trading that will be soon announced and implemented by all retail brokers. This has become necessary as many retail brokers are at risk of default when numerous retail day traders and smaller funds managers have margin calls but have no money to meet those margin calls. This problem is so extensive that major changes are coming to retail day trading on the public exchanges. Save yourself a lot of trouble and simply shift to swing trading instead. It is easier, more profitable, and more fun, takes less time and effort and it's far less stressful.
GOOG is NOT a sure thing for dominance in the AI Medical Diagnostics sub industry. However, the chart shows that there is an increase in Buy Side Giant Institutions, aka Dark Pools, investing in Google at this time. This can lead to speculative price action that is ideal for swing trading. GOOG reports on February 4th but there is now a risk that HFT AI may misinterpret the report or the CEO statement as HFT AI did for MSFT. Thus, trading it at this moment has very high risk.
Artificial_intelligence

NVDA Hagia Sophia CRACKING! CAUTION!NVDA is starting to fall apart. Nice rounding top followed by mini towerspike (as shown in the picture) that is now starting to roll over.
The price was rejected after the first crack that bounced lower. That's the big warning CRACK! Now we wait for the bigger CRACK! to occur.
Despite how small it looks on the chart, the reality is that NVDA has lost 20% or 1/5 of its total value already.
There is only so much B.S. they can come out and say to pump the stock. Eventually, that dies off along with the stock.
Remember! Circular financing is flat-out illegal because it fabricates the appearance of real demand, real capital, or real creditworthiness when none actually exists. It’s the financial version of forging a signature. This administration has gutted the SEC, and no one will dare call it out for what it is in AI. But the markets will always correct for theivery in the end.
NVDA should never have gotten this high. But that is the beauty of Reflexivity. We should all be used to it by now.
Eventually, it will all come crashing down. I hope not with you in it. I urge caution to the bulls!
THANK YOU for getting me to 5,000 followers! 🙏🔥
Let’s keep climbing.
If you enjoy the work:
👉 Boost
👉 Follow
👉 Drop a solid comment
Let’s push it to 6,000 and keep building a community grounded in truth, not hype.

Microsoft | MSFT | Long at $421.50Technical Analysis
Microsoft's NASDAQ:MSFT stock price entered its historical simple moving average area last week. This regression to the mean for high-growth companies with forward momentum is often, but not always, an area of support (currently between $407 and $435). I suspect ongoing near-term weakness may occur given market conditions, though. A continued dip into the $390's or even $360's may occur to really put the fright in investors, but I can't see it going much lower than that in the near-term unless market conditions or company fundamentals chnage. My longer-term hypothesis here is that given its AI / market cap dominance, the price will inevitably replicate that of Google NASDAQ:GOOGL (dip then skyrocket). In fact, I hope it dips to the $300's so I can accumulate a significant stake. But for now, a starter position exists at $421.50 - right at the historical mean.
Growth
Earnings-per-share anticipated to increase by 63.5% between 2026 ($16.37) and 2029 ($26.76).
Revenue anticipated to increase by 59.6% between 2026 ($327 billion) and 2029 ($522 billion).
Health
Debt-to-equity: 0.3x (very healthy)
Quick ratio / short-term debt: 1.4 (can successfully pay today's bills)
Altman's Z score / bankruptcy risk: 9+ (extremely low risk)
Dividend: 0.85%
P/E: 27x (broader software industry median ~24.65x)
Action
While short-term weakness is likely to enable large institutions to build greater positions, the long-term outlook is extremely bullish. Any dip below $400 is a continued personal buying opportunity, but for now, a starter position exists at $421.50.
(Conservative) Targets into 2029
$500.00 (18.6%)
$600.00 (42.3%)

Vistra Corp (VST) – Base‑Load Power for AI & PPAsVistra is another name tied directly into the AI power theme, with nuclear and gas assets plus power purchase agreements (PPAs) signed with big tech, including Meta, to supply long‑term baseload power. It has also been active in financing markets, issuing secured notes to fund expansion, which has kept it in the M&A/infra headlines.

[LOI] - SK Hynix - SK Hynix
Key Points :
Bullish Outlook on SK Hynix : The company dominates the high-bandwidth memory (HBM) market with over 50% share, driven by AI demand from clients like NVIDIA. Record 2025 profits suggest continued growth in 2026, with analysts forecasting undervaluation and potential 20-50% stock upside amid a memory supercycle.
CHIPS Act Benefits : SK Hynix secured up to $458M in direct grants and $500M in loans, plus 25% tax credits, supporting its $3.87B Indiana investment. This funding accelerates U.S.-based AI chip packaging, enhancing domestic supply chains.
On-Shoring Advantages : The West Lafayette facility marks SK Hynix's first U.S. advanced packaging plant, creating 1,000 jobs and reducing reliance on Asian production. It aligns with U.S. efforts to bolster national security and AI leadership.
Company Overview :
SK Hynix Inc. (KRX: 000660), a top-tier South Korean semiconductor firm, focuses on DRAM, NAND flash, and HBM chips essential for AI, data centers, and consumer devices. As of January 2026, it holds about 33% global DRAM market share and 21% in NAND, with a market cap around $383B and stock at ~$554. Recent developments include launching a U.S.-based "AI Company" in February 2026, showcasing 16-layer HBM4 at CES, and investing $13B in a new South Korean packaging plant.
Notes on how I personally use my charts/NFA:
Each level L1-L3 and TP1-TP3 (Or S1-S3) has a deployment percentage. The idea is to flag these levels so I can buy 11% at L1 , 28% at L2 and if L3 deploy 61% of assigned dry powder. The same in reverse goes for TP. TP1: 61%, TP2:28% and TP3:11%. If chart pivots between TP's, in-between or in Between Sell levels these percentages are still respected. I like to use the trading range to accumulate by using this tactic.
Just my personal way of using this. This is not intended or made to constitute any financial advice.
This is not intended or made to constitute any financial advice.
NOT INVESTMENT ADVICE
I am not a financial advisor.
The Content in this TradingView Idea is for informational purposes only, you should not construe any such information or other material as legal, tax, investment, financial, or other advice. Nothing contained within this idea constitutes a solicitation, recommendation, endorsement, or offer to buy or sell any securities or other financial instruments in this or in in any other jurisdiction in which such solicitation or offer would be unlawful under the securities laws of such jurisdiction.
All Content on this idea post is information of a general nature and does not address the circumstances of any particular individual or entity. Nothing in the idea/post constitutes professional and/or financial advice, nor does any information on the idea/post constitute a comprehensive or complete statement of the matters discussed or the law relating thereto. You alone assume the sole responsibility of evaluating the merits and risks associated with the use of any information or other Content on the idea/post before making any decisions based on such information.
Sir. Galahad - QUANT
Disclaimer
The information and publications are not meant to be, and do not constitute, financial, investment, trading, or other types of advice or recommendations supplied or endorsed by.

[LOI] - WolfSpeed - WolfSpeed Inc.
Key Points:
Bullish Outlook on Wolfspeed : Research suggests Wolfspeed is well-positioned for growth in silicon carbide (SiC) demand, driven by EVs, AI data centers, and renewables, with potential margin expansion as new fabs ramp up. However, financial risks like debt and dilution temper absolute confidence.
CHIPS Act Benefits : Wolfspeed has secured significant support, including nearly $700M in tax refunds received and up to $750M in grants, enabling U.S. expansions that enhance domestic supply chains.
On-Shoring Advantages : U.S. semiconductor reshoring efforts align with Wolfspeed's investments in North Carolina and New York facilities, potentially bolstering national security and economic resilience amid global competition.
Key bearish insiders :
- November 14, 2025: Soros Fund Management added new put positions in NYSE:WOLF , part of a portfolio update including other hedges like NASDAQ:SMH puts.
Notes on how I personally use my charts/NFA:
Each level L1-L3 and TP1-TP3 (Or S1-S3) has a deployment percentage. The idea is to flag these levels so I can buy 11% at L1 , 28% at L2 and if L3 deploy 61% of assigned dry powder. The same in reverse goes for TP. TP1: 61%, TP2:28% and TP3:11%. If chart pivots between TP's, in-between or in Between Sell levels these percentages are still respected. I like to use the trading range to accumulate by using this tactic.
Just my personal way of using this. This is not intended or made to constitute any financial advice.
This is not intended or made to constitute any financial advice.
NOT INVESTMENT ADVICE
I am not a financial advisor.
The Content in this TradingView Idea is for informational purposes only, you should not construe any such information or other material as legal, tax, investment, financial, or other advice. Nothing contained within this idea constitutes a solicitation, recommendation, endorsement, or offer to buy or sell any securities or other financial instruments in this or in in any other jurisdiction in which such solicitation or offer would be unlawful under the securities laws of such jurisdiction.
All Content on this idea post is information of a general nature and does not address the circumstances of any particular individual or entity. Nothing in the idea/post constitutes professional and/or financial advice, nor does any information on the idea/post constitute a comprehensive or complete statement of the matters discussed or the law relating thereto. You alone assume the sole responsibility of evaluating the merits and risks associated with the use of any information or other Content on the idea/post before making any decisions based on such information.
Sir. Galahad - QUANT
Disclaimer
The information and publications are not meant to be, and do not constitute, financial, investment, trading, or other types of advice or recommendations supplied or endorsed by.

Is Tesla Evolving from Automaker to an AI Superpower?The fourth quarter of 2025 marked the definitive end of Tesla’s era as a traditional car manufacturer. The company has officially shed its automotive skin to emerge as a "Physical AI" powerhouse. This pivot is not mere marketing; it is a fundamental restructuring of capital and industrial strategy.
The Financial Paradox of Q4 2025
Tesla’s Q4 2025 earnings revealed a striking contradiction that defied traditional valuation models. Total sales fell 3.1% year-over-year to $24.9 billion, missing Wall Street expectations. In a conventional growth model, such top-line contraction often triggers a sell-off.
Yet, the market rewarded Tesla’s efficiency narrative. Earnings per share (EPS) hit $0.50, beating forecasts by over 11%. Gross margins surged to 20.1%, their highest level in two years. Investors now prioritize automation's unseen potential over tangible vehicle delivery metrics.
Executing the Legacy: The Death of S and X
In a "burn the ships" strategic move, Tesla will cease Model S and Model X production by Q2 2026. These flagship vehicles defined the brand but now occupy valuable floor space at the Fremont factory. Tesla is clearing the deck to prioritize mass-producing humanoid robots.
Management aims for one million Optimus units annually. The logic is brutal: robots address a larger labor market than luxury sedans. While this alienates early adopters, Tesla is trading 50,000 human customers for a million profitable machines.
Optimus: A "Death Punch" to Global Industry
The Optimus program represents an aggressive challenge to Chinese manufacturing dominance. China’s leverage relies on labor arbitrage, which a $20,000 robot effectively destroys. American factories using Optimus can run 24/7 without benefits or breaks.
However, the "death punch" faces a significant geopolitical bottleneck. China has restricted exports of rare earth magnets essential for robotic actuators. Without neodymium and dysprosium, the 2026 production timeline remains at risk. Tesla is now scrambling for export licenses while redesigning motors to bypass this blockade.
Technology Breakthroughs: 4680 and Silicon Anodes
Tesla’s 4680 battery cell has finally emerged from "yield hell". A December 2025 patent revealed a breakthrough in dry electrode production using silicon composite anodes. Silicon stores more lithium than graphite, significantly boosting energy density.
This innovation is critical for the physical AI fleet. Robots require high energy density to perform tasks for eight-hour shifts. Furthermore, the "tabless" design facilitates 15-minute charging, which is vital for high-utilization Robotaxi operations.
T he AI Infrastructure Pivot: From Dojo to AI6
Tesla has effectively disbanded its custom "Dojo" supercomputer project. The D1 chip proved a capital-intensive dead end. Instead, Tesla is pivoting to the "AI6" chip, manufactured by Samsung.
This new architecture unifies the software stack across cars, robots, and training clusters. By leveraging Samsung’s supply chain, Tesla avoids the capacity constraints of TSMC. The focus has shifted from custom training hardware to massive edge-case inference power.
The Robotaxi Economy and Autonomous "Hives"
The "Cybercab" rollout in 2026 aims to turn vehicles into cash-generating assets. Tesla estimates an operating cost of ~$0.20 per mile, creating a massive profit spread over traditional ride-sharing.
To solve the cleaning bottleneck, Tesla patented a "Self-Cleaning Apparatus" using UV light and sanitization vapor. Automated "hives" will use robot hands to remove debris and wipe surfaces. This integrated ecosystem creates a moat that competitors like Uber cannot easily replicate.
Militarization and the "STING" Cybertruck
Tesla is diversifying into defense through a partnership with Archimedes Defense. The "STING" package adds military-grade armor and a multi-fuel generator to the Cybertruck. This transforms the vehicle into an Armored Personnel Carrier capable of silent watch missions.
The US Air Force is already testing Cybertrucks for structural integrity and weapons integration. While this militarization may alienate eco-conscious buyers, it opens lucrative, recession-proof government contracts.
Risk Management: Cybersecurity and Insurance
Tesla’s greatest existential threat is a fleet-wide hack. With Robotaxis lacking steering wheels, the traditional "hardware disconnect" for brakes is gone. Tesla is implementing a Vehicle Security Operations Center (vSOC) to monitor for anomalies.
Simultaneously, Tesla Insurance is maturing, with a loss ratio improved to 92.5%. As Full Self-Driving (FSD) reduces accidents, these margins will likely widen. Tesla’s real-time data allows it to price risk more accurately than traditional insurers using demographics.

$NET: The $464 Vision - Betting on the Edge AI Supercycle🌐🚀
Most analysts are looking at $249, but they are missing the forest for the trees.
Cloudflare isn't just protecting websites anymore; it’s the operating system for global AI inference.
The Setup: We are currently consolidating after a massive 3X run from the April 2025 lows.
I’m looking for a reclaim of $215 to confirm the move back to the ATH $260 range.
The Target: If the $5B ARR target is pulled forward by AI demand, a $464 price point represents a realistic 2027/2028 'blue sky' valuation.
Entry: $185 - $195 zone. Invalidation: A weekly close below $168 (200-day SMA).
#NET #Cloudflare #AIStocks #Breakout #TechStocks #CloudComputing

Wait for Liquidity. Then Execute.CAPITALCOM:US100 Overall structure remains bearish on both HTF and LTF.
Price is trading around 25,000, holding below key resistance zones. No structural shift confirmed yet.
VANTAGE:NAS100 In the short term, price may attempt a corrective
pullback toward 25,300–25,400, where prior imbalance and resistance sit.
As long as there is no acceptance above 25,400, this move is corrective only, not a trend reversal.
🎯 Key Levels & Scenarios
Upside (Corrective only)
• 25,300–25,400
→ Liquidity grab / short term pullback zone
→ Preferred area to look for short setups on rejection
Downside targets
• 24,800
→ Immediate intraday support (currently in play)
• 24,600
→ First clean downside objective
• 24,000
→ Major HTF liquidity pool / extended bearish target
⚡ Scalp Ideas (LTF)
Scalp Short
• Rejection from 25,250–25,400
• Weak bullish momentum or lower high on LTF
• Targets:
→ 25,000
→ 24,900
Scalp Long (counter trend, quick only)
• Strong reaction from 24,900–24,850
• Clear displacement and acceptance on LTF
• Targets:
→ 25,050–25,150
• Reaction trades only, not swing longs
⚠️ Invalidation
• Sustained acceptance above 25,400
→ Weakens immediate bearish continuation
→ Requires reassessment of short bias
Until invalidation occurs, rallies are sell side opportunities, not reversals.
Bias stays bearish. 📉🦈
🧠 Execution Reminder
Higher time frame first.
Lower time frame execution second.
Not investment advice. Always manage your own risk.

Alight | ALIT | Long at $1.68Alight NYSE:ALIT is a cloud-based human capital technology provider that specializes in helping large organizations manage employee benefits, health, wealth, wellbeing, and related HR functions. It uses AI, data analytics, and personalized insights to improve employee experiences, boost engagement, and drive better outcomes for both employers and workers.
Technical Analysis:
The stock price entered, for the second time, my historical "crash" simple moving average zone. This area (green lines) is often a key location for share accumulation during algorithmic trading. While the lowest band is currently near $1.30 and trending lower (i.e. this is likely not officially bottom), it's a key zone for traders to consider entry for a potential bounce while leaving the emotions and guesswork at the door. But nothing is for certain in the stock market.
Insiders:
Significant buying and no selling through 2025: openinsider.com
Growth:
Modest rise in earnings per share and revenue expected between 2026 and 2028: tradingview.com
Health:
Debt-to-equity: 1x (just okay)
Quick ratio / ability to pay today's bills: 1.2 (just okay)
Altman's Z score / bankruptcy risk: 0.1 (high...)
Fair value: $8.00
Action:
While the price is at risk for heading into the low $1 range, I believe it is currently oversold based on the estimated fair value ($8), insider buying, and technical analysis. It's a risky play based on the financials and changing workforce, but it's a gamble that caught my attention. Thus, at $1.68, NYSE:ALIT is in a personal buy zone /starter position with potential for further declines near $1 - $1.30 in the near-term. Time will tell.
Targets into 2029
$2.00 (+19.0%)
$3.00 (+78.6%)

Teva 2026: The Biopharma Titan of the AI Protein Era
Teva Pharmaceutical Industries has moved far beyond its origins as a generics giant. Under the "Pivot to Growth" strategy, the company recorded its 11th consecutive quarter of growth in late 2025. As of January 2026, Teva stands as a revitalized biopharma leader. The company’s transformation focuses on innovative medicines, biosimilars, and high-tech manufacturing.
Geostrategy and Macroeconomics: A Resilient Foundation
Teva utilizes its massive global footprint to navigate complex geopolitical shifts. With over 50 manufacturing facilities, it maintains the industry's largest fully integrated network. This scale provides a critical buffer against global supply chain disruptions. Furthermore, Teva has successfully managed the impacts of the U.S. Inflation Reduction Act. The company’s strategic pricing and market access ensure steady revenue from blockbuster assets like Austedo.
Industry Trends: The Biologics Pivot
The pharmaceutical industry is rapidly shifting toward complex biologics. Teva anticipated this trend by divesting its small-molecule active pharmaceutical ingredient (API) business. This move reallocates billions in capital toward high-margin innovative therapies. The company’s biosimilar portfolio is expanding aggressively, with plans for over 30 products by 2027. This shift significantly improves operating margins and strengthens Teva’s competitive moat.
Management and Leadership: The Francis Era
CEO Richard Francis has redefined Teva’s corporate culture. His "Pivot to Growth" framework focuses on four key pillars: growth engines, innovation, generics, and business focus. Analysts praise his disciplined capital allocation and focus on pipeline maturity. Under his guidance, Teva has stabilized its debt and regained the trust of institutional investors. The company is now a lean, innovation-first organization.
Innovation and Patent Analysis: Protecting the Future
Teva’s innovation engine is delivering record results. Branded drugs like Austedo, Ajovy, and Uzedy showed 33% growth in recent cycles. The company actively secures patents for long-acting injectables and next-generation delivery systems. These intellectual property assets prevent competition and ensure long-term profitability. Teva’s patent strategy focuses on high-value therapies that will remain exclusive well into the 2030s.
The Premier "Fab" for AI Protein Folding
The surge in AI-driven protein folding companies creates a massive need for manufacturing capacity. Teva is perfectly positioned to become the "Fab" (fabrication) partner for these digital biotech firms.
* World-Class Bioreactors: * Teva operates one of the most sophisticated mammalian cell-culture networks globally.
* Teva Rise Platform: This open innovation hub directly connects AI startups with Teva's manufacturing expertise.
* The Bridge to Scale: Protein folding companies design molecules digitally but lack the factories to produce them. Teva provides the physical infrastructure to turn AI designs into life-saving medicines.
* Bioprocess Expertise: Teva’s scientists excel at the complex folding and purification of recombinant proteins.
By acting as the manufacturing backbone for the AI revolution, Teva secures a dominant role in the future of biotechnology.
Digital Frontier: Cyber and Science
Teva integrates "Industry 4.0" technologies across its entire production line. The company uses AI to predict product quality and optimize supply chain logistics. This scientific approach reduces waste and accelerates the delivery of medicine to patients. Robust cyber-resilience protocols protect Teva’s valuable proprietary data from evolving threats. These advancements solidify Teva's status as a modern high-tech leader.

SoftBank's $4B AI Gamble: The DigitalBridge VerdictJapan's SoftBank recently committed $4 billion to acquire DigitalBridge (DBRG) in an all-cash deal. This move marks a pivot toward Masayoshi Son's vision of Artificial Super Intelligence (ASI). For investors, the question remains: is the $16-per-share price a ceiling or a launchpad?
Geopolitics and the Race for AI Sovereignty
AI infrastructure has transitioned from a corporate luxury to a national security asset. The United States and Asia are currently locked in a race for AI dominance. DigitalBridge controls the physical layer of this race data centers and fiber networks.
SoftBank’s acquisition secures a geostrategy foothold in Western and Asian digital assets. The deal integrates DigitalBridge into global AI infrastructure initiatives. This partnership aims to build hyperscale computing sites to ensure Western AI sovereignty.
Leadership and the "Fronthaul" Innovation
CEO Marc Ganzi successfully transformed the firm from a traditional real estate player into a digital powerhouse. His leadership focuses on "fronthauling" the network. This strategy prioritizes dense fiber and software-defined networks over older, slower architectures.
DigitalBridge’s innovation extends beyond physical towers. The firm recently partnered with KT Corporation to develop gigawatt-scale AI data centers in South Korea. This venture represents a rare crossover where an infrastructure manager dictates the hardware standards driving AI demand.
Macroeconomics and the Valuation Gap
By traditional metrics, DigitalBridge appears expensive. The stock recently traded at 250 times trailing earnings, far exceeding the industry average of nine. However, SoftBank is not buying current earnings; it is buying future capacity.
The $16 offer provides a 15% premium but effectively anchors the stock price until late 2026. High-interest rates previously pressured infrastructure REITs, but the AI boom has decoupled DBRG from standard economic cycles. SoftBank is betting that physical "bottlenecks" like power and land will make existing assets priceless.
Technical Moat: Fiber and Cyber Security
DigitalBridge manages $108 billion in assets, focusing on high-density compute and low-latency fiber. These assets form the "connective tissue" for AI. Unlike cloud software, physical fiber routes are difficult to replicate and offer a natural competitive moat.
The firm also emphasizes edge computing, placing data processing closer to the user. This reduces latency, which is critical for real-time AI applications and autonomous systems. As cyber threats evolve, owning the physical fiber provides an additional layer of hardware-level security that software providers cannot match.
---
Summary for Investors:
SoftBank’s buyout likely caps short-term stock gains at $16. However, the deal validates the immense value of the physical AI backbone. Investors should view this as a signal that the "hardware phase" of the AI revolution is just beginning.

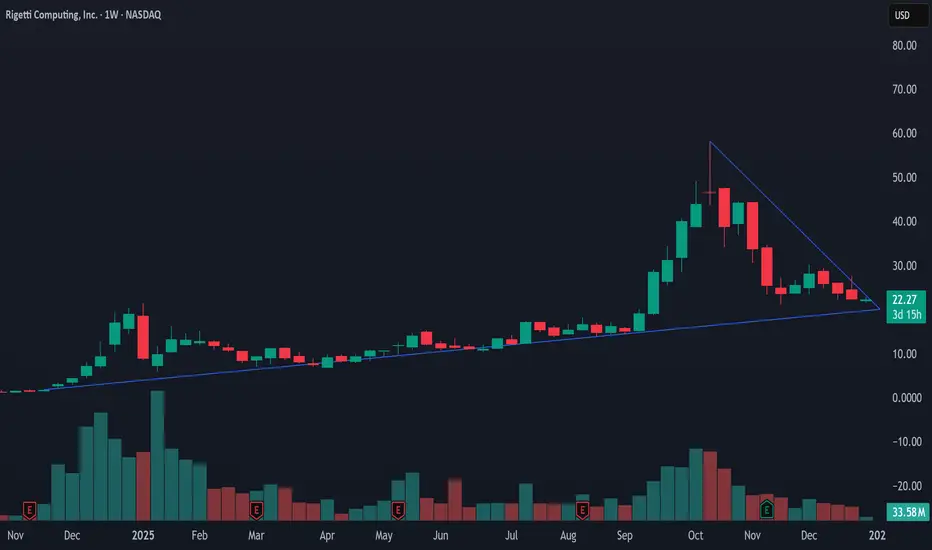
Understanding Rigetti ComputingRigetti Computing is a high-tech company that builds Quantum Computers. While normal computers (like your phone or laptop) use "bits" (0s and 1s), quantum computers use "qubits." This allows them to solve mathematical problems that are too complex for even the world's fastest supercomputers.
In 2025, Rigetti’s stock price became a "hot topic" because it grew by thousands of percentage points. However, as a new trader, it is important to understand why the price moved and why many experts are now careful.
Why the Stock Rose: The "Quantum Hype"
Several factors pushed Rigetti’s stock higher during the AI boom:
* Technology & Innovation: Rigetti is "vertically integrated." This means they make their own chips and their own software. This is a very professional and efficient way to build a company.
* Geopolitics: The United States government wants to win the "Quantum Race" against other countries. Because of this, companies like Rigetti often receive government support and contracts.
* Industry Trends: As Artificial Intelligence (AI) grows, it needs more power. Quantum computing is seen as the next step to make AI even smarter.
The Risk: Is the Price Too High?
When a stock grows too fast without having enough sales (revenue), traders call it " overbought." Here is the current situation for Rigetti:
* The Valuation Gap: Rigetti’s "Price-to-Sales" ratio is very high. This means the stock price is much higher than the actual money the company is making.
* High Cash Burn: Building quantum computers is very expensive. The company spends a lot of money on science and research, but does not yet have many paying customers.
* Market History: Professional traders remember the "Dot-Com" bubble of the year 2000. Back then, many internet stocks rose quickly and then crashed by 90%. Some experts fear Rigetti might follow a similar path.
Market Impact and 2026 Prediction
If you are trading this stock, you should expect high volatility. This means the price can go up or down 10% or 20% in a single day.
What to expect by the end of 2026:
Many analysts believe the "hype" will slow down and the price will return to a more realistic level. Predictions suggest the stock could settle between $3 and $7 by the end of 2026. This would be a "correction," where the market moves from trading on "dreams" to trading on "real financial results."
BESI Bullish ContinuationAfter a period of movement within this bull flag pattern, BESI looks ready for bullish continuation after retesting the upper trendline of the bull flag.
Fundamentally this adds up given the increasing demand in chips used for different technologies including AI.
What Besi Does:
- Designs & Builds Machines: They create the specialized equipment that semiconductor manufacturers use to build and package chips.
- Focuses on Advanced Packaging: Their technology supports traditional leadframe packaging, substrate-based packaging, and cutting-edge wafer-level packaging (like hybrid bonding) for complex chips.
- Provides Key Processes: Their equipment handles tasks like die bonding, molding the chip, trimming the leads, and marking the final package.
- Serves High-Growth Markets: They are crucial suppliers for consumer electronics, mobile internet devices, automotive systems, and increasingly, AI and high-performance computing.
I believe this will be a good stock to hold for 2026.

WDC Joins Nasdaq-100: The AI Storage RenaissanceMacroeconomics and Market Rotation
Western Digital (NASDAQ: WDC) is the standout technology story of 2025. The stock has surged approximately 195% year-to-date. It trades near $175 per share. On December 22, 2025, WDC joins the Nasdaq-100 Index. This event replaces retailer Lululemon. This swap signals a massive macroeconomic rotation. Capital is fleeing consumer discretionary sectors. Investors are prioritizing essential technology hardware. In an inflationary era, hard assets trump soft goods. WDC represents the critical physical layer of the digital economy.
Economics: The Index Effect
Inclusion in the Nasdaq-100 triggers a powerful financial phenomenon. Passive funds like Invesco QQQ must buy WDC shares. They need to match the benchmark perfectly. This creates forced institutional buying. This demand ignores daily operational news. It establishes a technical floor for the stock price. Simultaneously, the company is shrinking its own supply. WDC repurchased $553 million of stock recently. Demand is spiking while supply contracts. Basic economics dictates a price increase.
Business Models: The Strategic Pivot
Management executed a masterstroke in February 2025. They separated the Flash memory business. Western Digital is now a pure-play Hard Disk Drive (HDD) manufacturer. This move eliminated conglomerate discounts. The market now values the company correctly. WDC focuses entirely on mass data storage. This clarity attracts specialized investors. It aligns the business model with hyperscale data center needs. Operational efficiency has improved significantly.
Technology and Science: The AI Engine
Artificial Intelligence is the primary growth driver. AI models require massive datasets. Storing this data on Flash is cost-prohibitive. "Nearline" HDDs are the only viable scientific solution. WDC provides this essential infrastructure. It is no longer a legacy tech firm. It is an AI utility. Cloud revenue grew 31% to $2.51 billion. The company shipped 204 exabytes of storage in one quarter. This volume confirms the physics of data gravity.
Management and Leadership
Executive leadership has prioritized profitability over market share. This discipline is paying off. Gross margins expanded to 43.9%. This is a sharp rise from 37.3% last year. Earnings per share hit $1.78. They beat analyst expectations efficiently. The Board also raised the dividend by 25%. This signals robust confidence in free cash flow. Management secured firm orders through 2026. This visibility mitigates volatility risks.
Innovation and Patent Analysis
The HDD industry is effectively a duopoly. High barriers to entry protect WDC. The science of high-density storage requires immense R&D. WDC utilizes complex magnetic recording technologies. Their intellectual property portfolio forms a defensive moat. Competitors cannot easily replicate this "patent thicket." This ensures long-term pricing power. Innovation is now focused solely on density. This drives margins higher on every unit sold.
Future Outlook: 2026
The trajectory for Western Digital remains bullish. The HDD market is supply-constrained. Scarcity equals pricing leverage. Analyst targets now reach as high as $250. The AI storage cycle is in its early innings. WDC has secured its role as the digital vault of the future. The company combines growth, income, and stability. It is positioned as a top-tier technology holding for 2026.

Pinterest | PINS | Long at $26.20Pinterest's NYSE:PINS continued user growth is quite impressive, especially among Gen Z. Factoring in global expansion, the revenue and earnings projections caught my attention. Currently trading around a 9x price-to-earnings, it's kind of a sleeper in the tech world *if* the user numbers and forecasts are accurate. Annual EPS is expected to almost double by 2028, going from $1.29 in 2024 to $2.46 in 2028. Projected revenue growth is almost the same, growing from $3.6 billion in 2024 to $6.3 billion in 2028. Also, the company has a very low Debt-to-Equity Ratio (4%) and very strong cash flow. Projections .
From a technical analysis angle, it's in a consolidation phase - trading sideways and confusing investors. The price is having a hard time staying above or below its historical mean, but there are plenty of gaps above and below the current price to fill. A company like NYSE:PINS can benefit significantly from AI utilization and capturing a share of the great wealth transfer, but the news is harping on a bad economy / reduced ad revenue.
Personally, this is one of those "why doesn't the price reflect the fundamentals" plays. Yes, there is competition, but the user growth continues to be impressive. Insiders are selling at an alarming rate ( openinsider.com ), though. Something doesn't add up. So, personally, a decision based on the numbers (as reported today) is the only way to go. Thus, at $26.20, NYSE:PINS is in a personal buy zone. If this ticker truly tanks and fishy company news emerges, it's going to drop near $12 or below.
Targets into 2028
$32.00 (+22.1%)
$50.00 (+90.8%)

Gartner | IT | Long at $240.25Technical Analysis
The stock price for Gartner NYSE:IT recently fell below my selected "crash" simple moving average zone (green lines) and touched off the "major crash" area in August 2025. It's been consolidating since. This could signal a near-term bottom. However, if the next earnings aren't up to expectations, I foresee a tumble into the $180s. At a current P/E of 20x, a tumble that low (if long-term guidance remains high vs a near-term outlook is weak) would signal another personal entry.
Insider Trading
December 10, 2025, a Director purchased $9.9 million at $229.57.
In the last 6 months, more buying than selling.
openinsider.com
Growth
Annual EPS is expected to rise from $12.80 in 2025 to $15.03 by 2027 (+19.53%)
Revenue is expected to grown from $6.5 billion in 2025 to $7.2 billion is 2027 (+10.8%)
www.tradingview.com
Action
While there are near-term risks of further decline into the $180's, the recent $9.9 million insider purchase (plus the technical analysis and continued growth) makes me bullish for the longer-term. Thus, at $240.25, NYSE:IT is in a personal buy-zone with further entries possible if there is a drop (but long-term outlook is bullish).
Targets into 2028
$300 (+24.9%)
$329 (+36.9%)

Micron’s AI Pivot: A 2025 Strategic & Geopolitical AnalysisThe “AI Supercycle” has finally matured from a buzzword into a tangible balance sheet reality. As of mid-December 2025, Micron Technology (MU) stands at a critical inflection point. With the Federal Reserve lowering rates to 3.75% and the semiconductor industry grappling with an unprecedented divergence between enterprise boom and consumer stagnation, Micron has aggressively repositioned itself. The upcoming fiscal Q1 2026 earnings report on December 17 represents more than a financial update; it is a referendum on CEO Sanjay Mehrotra’s high-stakes gamble on High Bandwidth Memory (HBM).
Business Model Transformation: The Enterprise Pivot
Micron is executing one of the most radical structural pivots in its history. The decision to deprioritize, and in some regions effectively sunset, its consumer-facing Crucial brand by early 2026 signals a ruthless allocation of capital. Management has correctly identified that the consumer PC market is a low-margin drag. Instead, production capacity is being violently swung toward enterprise-grade DRAM and AI-centric storage. This moves Micron from a commodity volume player to a specialized, high-margin infrastructure partner for hyperscalers like Microsoft and AWS.
Technology & Innovation: The HBM Wars
Technological supremacy is now defined by the roadmap to HBM4. While SK Hynix initially led the HBM race, Micron’s aggressive rollout of HBM3E has closed the gap. The company’s 1-beta and upcoming 1-gamma nodes utilize extreme ultraviolet (EUV) lithography to deliver power efficiency metrics that rival Asian competitors. Patent analysis reveals a surge in filings related to 3D-stacking architecture and advanced packaging, confirming that Micron is building a defensive IP moat around its high-performance compute capabilities.
Geostrategy & Geopolitics: Navigating the Fracture
Micron operates on the fault line of the US-China chip war. The lingering effects of Beijing’s 2023 ban on Micron products have accelerated the company’s "China-Plus-One" strategy. In response, Micron has doubled down on domestic manufacturing, leveraging the US CHIPS Act to fund mega-fabs in New York and Idaho. This is not just expansion; it is geopolitical insurance. By embedding itself into the US national security apparatus, Micron mitigates the risk of losing Chinese market share while securing subsidized capital that lowers its long-term cost of production.
Macroeconomics: The Rate Cut Tailwind
The Federal Reserve’s cut to 3.75% this November provides a specific, quantifiable benefit to Micron. Semiconductor manufacturing is arguably the most capital-intensive industry on earth. Lower borrowing costs directly improve the Net Present Value (NPV) of Micron’s multi-billion dollar fab projects. Furthermore, a softer dollar environment boosts the competitiveness of US exports, providing a tailwind for Micron’s international revenue recognition in fiscal 2026.
Cybersecurity & Supply Chain Integrity
In an era of state-sponsored cyber espionage, hardware security is a premium feature. Micron has elevated its cybersecurity posture by securing ISO/SAE 21434 certification for automotive memory, a critical requirement for modern SDVs (Software-Defined Vehicles). This focus extends to the supply chain; rigorous "Zero Trust" protocols now govern raw material sourcing, addressing the vulnerabilities exposed by recent global logistics disruptions. This security-first branding allows Micron to charge a premium to defense and automotive clients who cannot afford compromised hardware.
Management & Leadership
Sanjay Mehrotra’s tenure has been defined by discipline. Unlike previous cycles where memory makers flooded the market, causing price crashes, current leadership has shown remarkable restraint in CapEx spending. The 2025 strategy focuses on "bit growth discipline"—matching supply strictly to demand. This oligopolistic behavior, shared tacitly by competitors, has successfully engineered a favorable pricing environment, driving gross margins back toward the 40%+ range.
Conclusion: The Verdict
Micron Technology in late 2025 is no longer just a cyclical memory stock; it is a derivative play on the AI infrastructure build-out. The risks—ranging from HBM yield issues to renewed geopolitical friction—are real. However, the company’s strategic withdrawal from low-margin consumer markets and successful capture of CHIPS Act incentives position it favorably. As investors look to December 17, the question is not if AI demand exists, but if Micron can manufacture fast enough to satisfy it.

SOFTBANK can drop another 50%Softbank Group shares took a nosedive on Thursday, dragging down Japanese markets as mixed earnings and guidance from cloud giant Oracle raised fresh worries about excessive spending on artificial intelligence.
#Softbank (TYO:9984) dropped 7.7% to a one-week low of 17,210.0 yen by 22:34 ET (03:34 GMT), making it the biggest loser on the Nikkei 225 index, which fell by over 1%.
The decline in Softbank followed a more than 10% drop in Oracle (NYSE:ORCL), which plummeted after its fiscal second-quarter earnings report. Although the company exceeded market expectations for its net income, it fell short on revenue and provided a weaker-than-anticipated outlook for the upcoming quarter.
#Oracle also raised its fiscal 2026 capital expenditure forecast to $50 billion from $35 billion. The mixed earnings, along with expectations of increased capex, reignited concerns about how Oracle intends to profit from its substantial AI data center spending plans. There are also worries about the company’s debt load, following billions in issuances this year, and its significant exposure to OpenAI, which negatively impacted sentiment towards the stock.
BMO analysts pointed out that Oracle’s ties to OpenAI pose some long-term risks, considering the scale of the startup’s spending commitments and uncertainties about how it plans to fulfill those promises.
These worries spilled over to Softbank, which has a heavy investment in OpenAI. Softbank CFO Yoshimitsu Goto recently mentioned to Nikkei that the tech conglomerate is firmly focused on OpenAI and has no interest in funding its rivals.

Pine Script v6: The AI-Assisted Coding RevolutionAI Isn't Replacing Pine Script Developers, It's Creating More of Them
For years, if you wanted custom tools on $TRADINGVIEW, you had two options:
Spend months learning to code, or
Settle for whatever public indicators were available
The era of AI assisted Pine Script changes that. You don't have to choose between "coder" and "trader" anymore, you can be both, with AI as your quiet co‑pilot.
Why Pine Script + AI Is a Big Deal
In the new AI trading era, edge comes from:
Being able to test ideas quickly
Turning those ideas into rules
Automating those rules in a language the platform understands
AI can't give you edge by itself. But it can remove almost all of the friction between the idea in your head and a working NYSE:PINE script on your chart.
Instead of:
Googling syntax
Copy‑pasting random snippets
Debugging mysterious errors at 2am
you can describe your logic in plain language and let AI handle the boilerplate, while you stay in control of the trading logic.
The Modern Pine Script Workflow (AI Edition)
Old workflow:
Learn programming basics from scratch
Read documentation line‑by‑line
Write every line of code yourself
Fix every typo and bug manually
New workflow:
Define the strategy in plain English
Ask AI to draft the first version in Pine Script v6
Review and understand what it wrote
Refine, test, and harden it on your charts
The difference isn't "AI does everything" it's AI accelerates everything . You move from "How do I code this?" to "Is this idea actually good?" much faster.
What AI Is Great At in Pine Script
Syntax and Structure - Getting the small details right:
`indicator()` declarations
`strategy()` settings
Inputs, colors, line styles
Common functions like `ta.sma`, `ta.rsi`, `ta.crossover`
Boilerplate Code - The parts that repeat across almost every script:
Input sections
Plotting logic
Alert conditions
Explaining Code Back to You - You can paste a snippet and ask:
"What does this variable do?"
"Why is this `if` statement here?"
"Can you rewrite this more clearly?"
This is how you learn Pine Script by doing , instead of from a dry textbook.
What AI Is NOT Good At (If You Rely on It Blindly)
Designing Your Edge - AI doesn't know your risk tolerance, timeframe, or style. You still have to define the actual trading idea.
Protecting You From Over‑Optimization Ask it to "improve" a strategy and it may add 20 inputs that look perfect on past data and fail live.
Understanding Market Context - It can code the rules, but it doesn't "feel" what a trend, rotation, or macro regime shift means to you.
Use AI as a smart assistant, not an oracle.
Core Pine Script Concepts You Still Need
Even in the AI era, a few fundamentals are non‑negotiable. Think of them as the alphabet you must know, even if AI writes the sentences:
1. Data Types
float // prices, indicator values
int // bar counts, lengths
bool // conditions (true/false)
string // labels, messages
color // styling
2. Series Logic
Every variable in Pine is a time series . You don't just have `close`, you have `close `, `close `, etc.
close // current bar close
close // previous bar close
high // high from 5 bars ago
3. Built‑In Indicator Functions
You don't need to reinvent moving averages and RSI:
ma = ta.sma(close, 20)
rsi = ta.rsi(close, 14)
longCondition = ta.crossover(close, ma)
If you understand what these do, AI can handle how to wire them together.
A Clean AI‑Assisted Workflow to Build Your Next Indicator
Write the idea in plain language
"I want a trend filter that only shows long signals when price is above a 200‑period MA and volatility is not extreme."
Ask AI for a first draft in Pine Script v6
Specify: overlay or separate pane, inputs you want, and what should be plotted.
Read every line
Use AI as a teacher: "Explain this variable", "Explain this block".
Test on multiple markets and timeframes
Does it behave the way you expect on CRYPTOCAP:FOREX , $CRYPTO, and stocks?
Does it break on higher timeframes or very illiquid symbols?
Iterate, don't chase perfection
Tweak one idea at a time.
Avoid adding endless inputs just to fix old trades.
The Bigger Picture: Coders, Traders, and the AI Era
The old split was:
"Coders" who could build things but didn't trade
"Traders" who had ideas but couldn't code them
In the AI era, that wall disappears. The trader who can:
Describe ideas clearly
Use AI to generate Pine code
Understand enough to test and refine
…gets a massive edge over both pure coders and pure discretionary traders.
You don't need to be perfect. You just need to be dangerous, one well‑tested script at a time.
Your Turn
If you could build one custom tool this month with AI's help, what would it be?
An entry signal? A dashboard? A risk overlay?
Drop your idea below and consider this your sign to finally turn it into code.
How AI is Revolutionizing Risk ManagementIn a world where bots can fire off hundreds of orders in the time it takes you to sip your coffee, risk management isn't a checkbox at the end of your plan it's the core operating system.
AI has given traders incredible leverage:
Faster execution than any human
Exposure to more markets and instruments
Complex position structures that would be impossible to manage manually
But that same leverage cuts both ways. When something breaks, it doesn't trickle it cascades.
The traders who survive this era won't be the ones with the most aggressive models. They'll be the ones whose risk frameworks are built to handle both human mistakes and machine speed.
Why Old-School Risk Rules Aren't Enough Anymore
For years, the standard advice looked like this:
"Never risk more than 1–2% per trade"
"Always use a stop loss"
"Diversify across assets"
Those principles still matter so much. But AI and automation helped improve and changed the landscape:
Orders can hit the market in microseconds your "mental stop" is useless
Correlations spike during stress what looked diversified suddenly moves as one
Multiple bots can unintentionally stack risk in the same direction
Feedback loops between algos can turn a normal move into a cascade
In other words: the classic rules are the starting point , not the full playbook.
How AI Supercharges Risk Management (If You Let It)
Used well, AI doesn't just place trades it monitors and defends your account in ways a human never could.
Dynamic Position Sizing
Instead of risking a flat 1% on every trade, AI can adjust size based on:
Current volatility
Recent strategy performance
Correlation with existing positions
Market regime (trend, range, chaos)
When conditions are favorable, size can step up modestly.
When conditions are hostile, size automatically steps down.
The goal isn't to swing for home runs.
It's to press when the wind is at your back, and survive when it's in your face.
Smarter Stop Placement
Fixed stops at round numbers are magnets for liquidity hunts.
AI can analyze:
ATR-based volatility bands
Clusters of swing highs/lows
Liquidity pockets in the book
Option levels where hedging flows are likely
Stops get placed where the idea is broken, not where noise usually spikes.
Portfolio-Level Heat Monitoring
Most traders think in single trades. AI thinks in portfolios.
It can continuously measure:
Total percentage of equity at risk right now
Sector and theme concentration
Correlation clusters (everything tied to the same macro factor)
Worst-case scenarios under shock moves
If your "independent" trades are all secretly the same bet, a good risk engine will tell you.
The 4-Layer Risk Stack for AI Traders
Think of your protection as layered armor:
Trade Level
Clear stop loss
Defined target or exit logic
Position size tied to account risk, not feelings
Strategy Level
Max number of open positions per strategy
Daily loss limit per system
"Three strikes" rules after consecutive losing days
Portfolio Level
Total open risk cap (for example: no more than 2% at risk at once)
Limits by asset class, sector, and narrative
Rules to prevent over concentration in one theme (AI stocks, crypto, etc.)
Account Level
Maximum drawdown you're willing to tolerate
Hard kill switch when that line is crossed
Recovery plan (size reductions, pause period, review process)
AI can monitor all four layers at once every position, every second and trigger actions the moment a rule is violated.
Kelly, Edge, and Why "More" Is Not Always Better
The Kelly Criterion is a famous formula that tells you how much of your account you could risk to maximize long‑term growth.
Kelly % = W - ((1 - W) / R)
Where:
W = Win probability
R = Average Win / Average Loss
Example:
Win rate (W) = 60%
Average win is 1.5× average loss (R = 1.5)
Kelly = 0.60 - (0.40 / 1.5) ≈ 0.33 → 33%
On paper, that says "risk 33% of your account each trade." In reality, that's a fast path to a margin call.
Serious traders and any sane AI risk engine treat Kelly as the ceiling , then scale it down:
Half‑Kelly (≈ 16%)
Quarter‑Kelly (≈ 8%)
Or even less, depending on volatility and confidence
AI can recompute W and R as fresh trades come in, adjusting risk when your edge is hot and cutting risk when your edge is questionable.
Designing Your AI‑Era Risk Framework
You don't need hedge‑fund infrastructure to think like a pro. Start with five questions:
What is my absolute pain threshold?
At what drawdown (%) would I stop trading entirely?
Write that number down. Build backwards from it.
How many consecutive losses can I survive?
If you want to survive 10 straight losses at 20% max drawdown, your per‑trade risk must be ~2% or less.
How will I shrink risk when volatility spikes?
Tie your size to ATR, VIX‑style measures, or your own volatility index.
What are my circuit breakers?
Daily loss limit
Weekly loss review trigger
Conditions where all bots shut down automatically
Is everything written down?
If it's not in rules, it's just a wish.
Rules should be clear enough that a bot could follow them.
Four AI Risk Mistakes That Blow Accounts Quietly
Over‑optimization - Training models until the backtest is perfect… and live trading is a disaster.
Ignoring tail risk - Assuming the future will look like the backtest, and underestimating rare events.
No true kill switch - Letting a "temporary" drawdown turn into permanent damage.
Blind trust in the model - Assuming "the bot knows best" without understanding its logic.
AI should be treated like a high‑performance car: powerful, fast, and absolutely deadly if you drive it without brakes.
Discussion
How are you handling risk in the age of automation?
Do you size positions dynamically or use fixed percentages?
Do you cap total portfolio risk, or just think trade by trade?
Do your bots or strategies have clear kill switches?
Drop your thoughts and your best risk rules in the comments. In the future of trading AI will be the one watching your back.....
AI Trading: The Revolution You Can't IgnoreThe Era of AI Trading Has Arrived And It's Only Getting Started
Forget the movie version of AI glowing red eyes flawlessly predicting every tick. The real story is colder, quieter, and way more powerful:
We are moving from a world where humans look at charts to a world where machines digest every tick, every candle, every flow of data… and feed you the edge you couldn't see on your own.
Right now, as you read this, AI is already sitting inside:
Execution algorithms routing institutional orders across venues
Risk engines stress testing portfolios in milliseconds
News and sentiment scanners parsing thousands of headlines a minute
Retail tools that turn a paragraph of English into working NYSE:PINE Script
This isn't science fiction. This is the baseline. And the baseline is rising.
The traders who survive this decade won't be the ones fighting AI. They'll be the ones partnering with it.
So What Exactly Is "AI Trading"?
At its core, AI trading is simply using algorithms that can learn from data to make parts of the trading process smarter.
That can mean anything from a small script that filters charts for you, all the way up to full stack systems managing billions. The spectrum looks like this:
AI Assisted Analysis You still click the buttons, but AI does the heavy lifting.
Pattern recognition on charts (trend, ranges, breakouts)
Scanning hundreds of symbols for your exact conditions
Sentiment analysis on news and earnings headlines
Idea generation: "Show me all large‑cap stocks breaking out with above‑average volume"
AI‑Generated Signals The machine tells you what it would do; you decide whether to listen.
Multi‑indicator models that output clear long/short/flat signals
Quant models that score each asset from 0-100 based on your rules
Bots that push alerts when high‑probability setups appear
Fully Automated Trading The system trades end‑to‑end while you supervise.
Execution from signal → order → risk control with no manual clicks
Self adjusting position sizing and risk controls
Strategies that re‑train on fresh data as regimes shift
Wherever you are on that spectrum, you're already in the AI game. The question isn't "Will I use AI?" it's "How deeply will I let it into my process?"
How AI Actually "Sees" the Market
Humans see a chart. AI sees a dataset.
Human view:
One instrument at a time
A couple of timeframes
A handful of indicators you like
Heavily filtered through emotion and bias
AI view:
Thousands of symbols at once
Dozens of timeframes and derived features
Years of historical data compressed into patterns
Zero fear, zero FOMO, zero boredom
Feed a model clean data and it can uncover:
Regimes you feel but can't quantify (trend, chop, grind, panic)
Relationships between assets that hold statistically
Behavioral patterns like "late‑day reversals after gap‑up opens"
Execution patterns in the order book around key levels
But here's the crazy part: AI is completely unforgiving about your assumptions.
If the data is noisy, biased, or poorly structured, the model will happily learn the wrong thing and apply it with perfect discipline. "Garbage in, garbage out" gets amplified at machine speed.
The Era We're Entering: Human + AI, Not Human vs AI
Over the next decade, expect three shifts to accelerate:
From Intuition First → Data‑First
Traders will still have hunches, but they'll validate them against hard data.
Instead of "this looks extended", you'll ask the system: "How often do moves like this actually continue?" and get an answer in seconds.
From Single‑Indicator Thinking → Multi‑Signal Models
No more worshiping one magic oscillator.
AI will blend technicals, fundamentals, flows, and sentiment into a unified view.
From Static Systems → Adaptive Systems
Instead of one set of parameters forever, models will adapt as volatility, liquidity, and structure change.
Think of it as a trading playbook that rewrites itself when the game changes.
Technologies like larger language models, specialized chips, and eventually quantum‑accelerated optimization won't magically "solve" markets, but they will make it cheaper and faster to test ideas, build systems, and manage risk.
The edge shifts from "Can I code this?" to "Can I ask the right questions, define the right constraints, and manage the risk around what the models tell me?"
Where You Fit In As a Trader
In the era of AI, your job becomes less about staring at every tick, and more about designing the rules of the game your tools play.
You define what "good" trades look like.
You choose which markets, timeframes, and risks matter.
You decide when a model is behaving, and when it's time to shut it off.
AI gives you:
Speed: scanning what you could never cover alone
Consistency: executing the plan without emotional drift
Feedback: showing you what really works in your own data
You bring:
Context: macro, narrative, and common sense
Values: what risks you refuse to take
Adaptability: knowing when to step back or switch regimes
Put together, that's where the edge lives.
Getting Started in the AI Era (Without Getting Overwhelmed)
You don't need a PhD, a server rack, or a lab full of quants. You can start small and intelligent:
Audit Your Current Process
Where are you slow? (Scanning, journaling, testing?)
Where are you emotional? (Entries, exits, sizing?)
Those are prime targets for AI assistance.
Add One AI Tool at a Time
Maybe it's an AI screener.
Maybe it's an NYSE:PINE Script assistant that helps you code and backtest.
Maybe it's a journaling tool that tags your trades automatically.
Learn to Read the Data Behind the Magic
Look at win rate, drawdown, expectancy.
Compare AI filtered setups to your old ones.
Keep what clearly improves your edge; drop the rest.
Respect the Risks
Over‑fitted models that look perfect on the past.
Black‑box systems you can't explain.
Over‑reliance on automation with no kill switch.
Is AI Going to Take Over Trading Completely?
In some corners of the market, AI and automation already dominate . High‑frequency execution, index rebalancing, options market‑making, these domains are machine territory.
But markets are more than math. They are human fear, greed, regulation, politics, liquidity constraints, structural changes and unexpected shocks. That messy mix is exactly where human oversight still matters.
The most realistic future isn't "AI replaces traders" it's AI replaces undisciplined, unstructured traders who bring nothing but guesses to the table.
Traders who can think in systems, understand risk, and collaborate with machines? They don't get replaced. They get leverage.
Your Turn
Where are you right now in this evolution?
Still fully manual, doing everything by hand?
Using a few AI assisted tools but not trusting them yet?
Already running bots and systematic strategies?
What part of AI trading are you most curious or skeptical about?
And the big question: Do you think the future of trading belongs to AI, or to traders who know how to use it?
Drop your thoughts in the comments this era is just beginning.

Confluent Inc | CFLT | Long at $20.55 Technical Analysis
Confluent's NASDAQ:CFLT stock went through a wild decline after its IPO, dropping 84.5% from its high to the recent low. It is currently in a consolidation / "share accumulation" phase (i.e. trading sideways, overall), and the price is riding just below its historical simple moving average. Often, the price will bounce along this area until momentum picks up and then it's off to the races to fill all the open price gaps above on the daily chart. Given the niche this company has in the AI market, I suspect this is the eventual direction the stock price will move. Time will tell, though, and more major downside isn't a non-possibility.
Market Niche
The explosive growth of AI, particularly agentic and generative models, demands real-time data streaming at scale. NASDAQ:CFLT 's Kafka platform addresses this indispensable AI infrastructure demand - accounting for an estimated 35% of market share in the platform segment as of 2025. While AWS and Azure challenge it in their ecosystems, NASDAQ:CFLT is growing and leading the space, overall.
Revenue and Earnings Growth into 2028
122.2% earnings-per-share growth expected between 2025 ($0.36) and 2028 ($0.80).
53.9% revenue growth expected between 2025 ($1.15 billion) and 2028 ($1.77 billion).
www.tradingview.com
Health
Debt-to-Equity: 1x (good)
Altman's Z-Score/Bankruptcy Risk: 2.6 (very low risk, but over 3 is best)
Insiders
Warning: A LOT of selling and no buying.
openinsider.com
Action
The projected growth of NASDAQ:CFLT as the world moves toward agentic AI makes sense. I think the drop in price after the IPO was calculated and there may be a lot of room to run in the next 1-3 years. Insiders selling and the competitive landscape are red flags, but from the technical analysis to the fundamentals, this looks like a promising growth stock. Thus, at $20.55, NASDAQ:CFLT is in a personal buy zone.
Targets into 2028
$28.00 (+36.3%)
$41.75 (+103.2%)
