BTCFDUSD:Support and Resistance Levels Indicate Potential Move
Title:
BTCFDUSD: Key Support and Resistance Levels Indicate Potential Moves
Greetings, Traders!
🌟 Hello everyone,
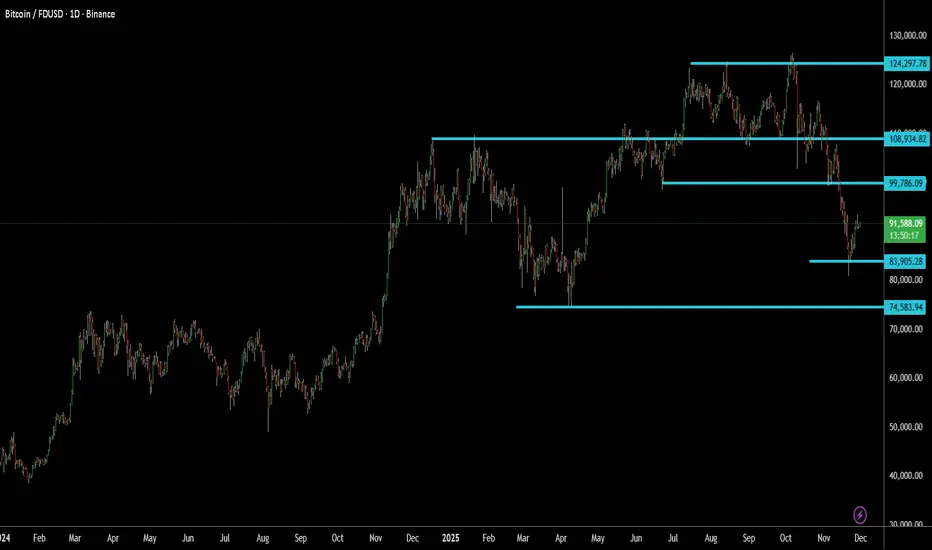
As we analyze BTCFDUSD, we observe critical support and resistance levels that could shape the upcoming price action. Understanding these levels can help traders navigate the market effectively.
BINANCE:BTCFDUSD
Key Observations:
- The strongest support level is identified at 74583 , with an immediate support level at 83905 . Currently, the price stands at 91635 , suggesting a potential pullback towards the immediate support before any upward movement.
- On the higher side, the initial resistance is at 99786 . If BTCFTRUSDT breaks through this level, the next target would be 108934, followed by a potential high of 124297 .
- Traders should monitor these key levels closely to identify optimal entry and exit points, as well as potential trend shifts.
Technical Analysis:
Technical indicators and price patterns indicate that BTCFTRUSDT may consolidate around the immediate support level of 83905 before attempting to move higher. The upward trajectory beyond 99786 could lead to significant gains, provided the price maintains bullish momentum.
Fundamental Factors:
While technical levels are crucial, it's also important to consider broader market sentiment, news, and events that could impact BTCFTRUSDT. Keeping an eye on major developments in the crypto space will help in making informed trading decisions.
Trading Strategies:
Given the current price levels, traders might consider short-term strategies such as buying near the immediate support at 83905 and holding for a potential breakout above 99786. Risk management, including setting appropriate stop-loss levels, is essential to mitigate potential downsides.
In Conclusion:
BTCFTRUSDT's price action is guided by key support and resistance levels. Traders should remain attentive to these levels and adapt their strategies as the market evolves. Patience and vigilance will be key in navigating the potential moves ahead.
Engage with Us:
🟢 If you find this analysis insightful, please give it a LIKE.
🟡 Don't forget to FOLLOW for more updates.
🔵 SHARE with fellow traders who might benefit from this information.
🔴 Feel free to COMMENT with your thoughts and insights!
Your active participation enriches our trading community, fostering knowledge exchange and collective growth. Share your feedback and ideas in the comments below or by boosting this post.
Looking forward to connecting with you in the next post.
Happy trading!
Artificial_intelligence
Decision Time!It's decision time for this AI stock.
Symmetrical patterns tend to lean continuation, which means lower in this case.
Simply Wall Street is showing a lot of inside buying, which tells me the bottom might be close... or we're being fooled.
These tiny stocks are so dangerous. However, could be a good one to throw a few hundred dollars at.

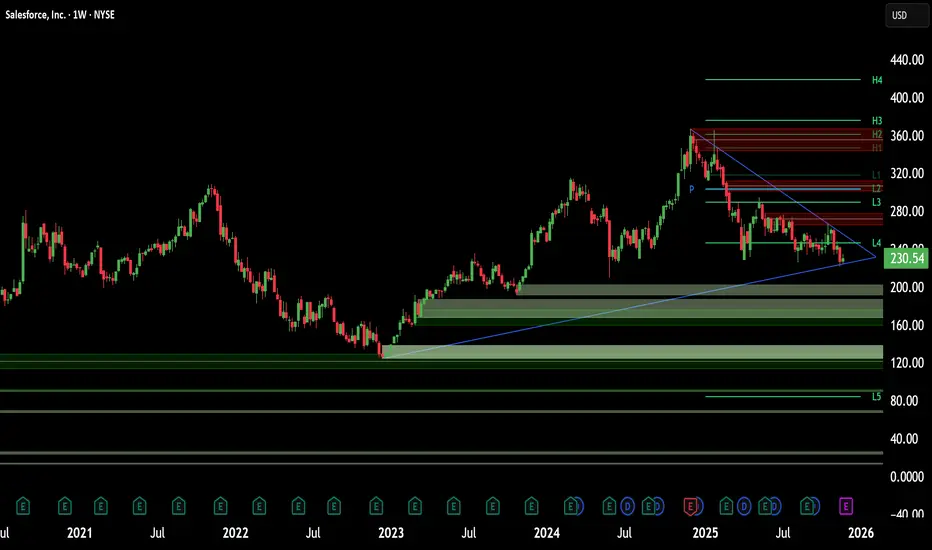
Salesforce’s AI Pivot: The Rise of the Agentic EnterpriseSalesforce (CRM) stands at a pivotal intersection of software legacy and artificial intelligence innovation. Despite a year-to-date stock correction of 32%, the company’s fundamentals tell a story of aggressive evolution. The cloud pioneer is systematically re-engineering its DNA to dominate the "Agentic Era." Investors focusing solely on the current share price of $227 may miss the underlying structural shift. With Q3 earnings approaching, we analyze the multi-domain drivers fueling Salesforce’s fundamental ascent.
Financial Resilience: Economics & Business Models
The subscription economy remains Salesforce's financial fortress.
In Q2 Fiscal 2026, the company generated $10.2 billion in revenue, a 10% annual increase. Crucially, $9.7 billion of this flowed from stable subscriptions and support. This recurring revenue model insulates the company against macroeconomic volatility. Furthermore, management’s focus on operational efficiency drove adjusted earnings per share (EPS) to $2.91, beating prior periods. This discipline balances aggressive R&D spending with shareholder returns, a vital equilibrium in high-interest rate environments.
High-Tech & Science: The "Agentic" Shift
Salesforce is redefining the science of work. CEO Marc Benioff envisions an "Agentic Enterprise" where human workers and AI agents collaborate seamlessly. This is not theoretical; the Data & AI division’s revenue more than doubled to $1.2 billion last quarter. The company’s proprietary platform, Agentforce, utilizes advanced Large Language Models (LLMs) to automate complex workflows. This moves beyond simple chatbots to autonomous agents capable of executing multi-step tasks in sales and service.
Patent Analysis: We anticipate a surge in IP filings regarding "autonomous agent orchestration" as Salesforce builds a legal moat around this technology.
Strategic M&A: Technology & Cyber
Data is the fuel for AI, and Salesforce just bought a bigger pipeline. The recent acquisition of Informatica secures critical cloud data management infrastructure. This strategic move allows Salesforce to ingest, clean, and secure vast datasets from disparate sources.
Cybersecurity Implication: By controlling the data layer, Salesforce offers a "walled garden" for enterprise clients. This reduces cyber risk and ensures data governance, a primary concern for Fortune 500 CIOs adopting AI.
Geopolitics & Geostrategy: Middle East Expansion
Salesforce is aggressively diversifying its geographic footprint. The recent launch of an Arabic version of Agentforce signals a strategic pivot toward the Middle East. This region is currently investing heavily in digital transformation to diversify away from oil dependence. By providing localized, AI-driven automation, Salesforce embeds itself into the infrastructure of emerging economic powers. This reduces reliance on Western markets and taps into sovereign wealth capital flowing into technology.
Management & Leadership: Culture of Innovation
Leadership is driving a forced evolution. Benioff is pivoting the company culture from "Cloud First" to "Agent First." This cultural shift is difficult but necessary to avoid obsolescence. The integration of Informatica and the push for $60 billion in revenue by 2030 demonstrate a long-term commitment to growth. Management is willing to sacrifice short-term margins for long-term dominance in the AI application layer.
Outlook: The December Catalyst
All eyes turn to Wednesday, December 3. Salesforce will release its Q3 2025 earnings after the bell. Analysts expect revenue of $10.27 billion and further EPS growth. The market will scrutinize the adoption rates of Agentforce and cloud subscription metrics. A positive report could validate the "Agentic" strategy and reverse the stock's recent bearish trend. For the strategic investor, Salesforce represents a disconnect between current sentiment and fundamental reality.
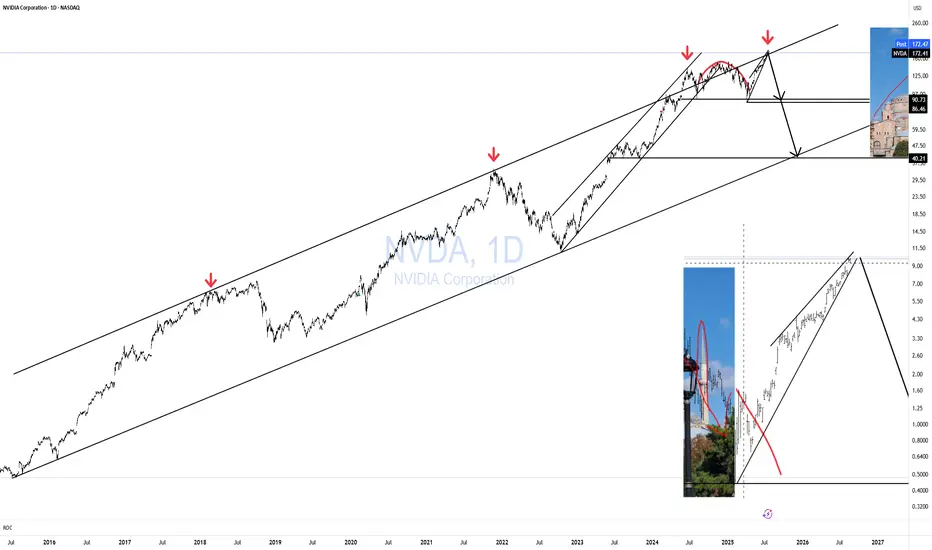
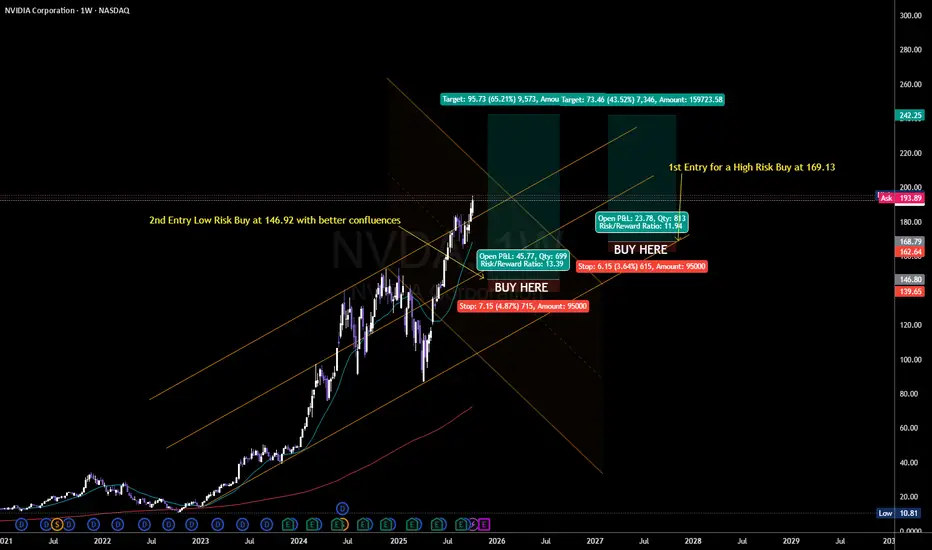
NVDA HAGIA SOPHIA!The Hagia Sophia pattern has now fully formed; it just needs the crack! and the Hook!
No matter what your vague hunches and feelings are about AI, the charts will always win.
You can't "buy the dip" unless you know when to "Sell the Rip"!
If you can't see this resistance area, I don't know what to tell you.
Everyone is bullish at the top of a bubbliotious market without exception!
Click boost, Like, Subscribe! Let's get to 5,000 followers. ))
$SMH: HOLDING THE KEY FOR THE SHORT TERM MARKET DIRECTION NASDAQ:SMH : The direction of the stock market this week hinges significantly on the performance of $SMH. Please note that NVDA will release its earnings report on Wednesday.
Currently, the weekly chart for SMH looks good, as it remains within the channel established since the April low and is above its 10-week simple moving average (SMA). However, the upward momentum has stalled following the weekly shooting star pattern observed three weeks ago, suggesting we may be entering a digestion phase to address the extremely overbought RSI14.
That said, we should not discount the possibility of a topping phase if the 10-week SMA does not hold. The stakes are high, and how the market responds to NVDA's numbers on Wednesday will be crucial.

RENDER: Slightly higherRENDER recently managed to push higher once again. Currently, within the larger turquoise wave Y—which is developing as a five-wave move in magenta—it is expected to continue its upward momentum in the near term. As a key initial step, price should break above resistance at $5.51.

Opendoor Technologies Big Correction coming ? Part 2 In this video I cover what was originally anticipated in the first Opendoor video that i published in October and what we can expect moving forward .
I still have the same targets as specified in the first video with alerts set .

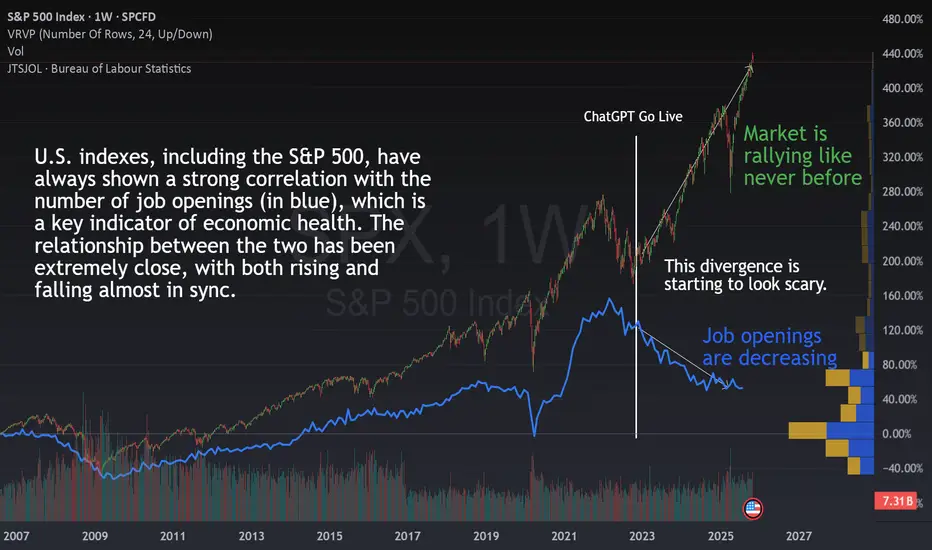
The Scariest Divergence In the MarketThe Scariest Divergence In the Market
If you look at the chart, you’ll see the TVC:SPX (candles) and U.S. job openings (in blue) plotted together since 2001.
Historically, these two metrics have been highly correlated , both rising and falling almost in sync as the economy expanded or contracted.
But something changed dramatically in November 2022.
That’s when ChatGPT went live, marking the start of the AI boom that has reshaped entire industries and mindsets. From that point on, we can see a massive divergence, the kind we’ve never seen before.
While job openings have kept declining steadily, the market has rallied like never before. This is not logical from a historical point of view.
🤖 Is AI Replacing Workers?
One possible explanation is that the market sees AI as a reason for optimism:
“If companies can do more with less labor, that means higher margins and better efficiency.”
So, fewer job openings might not scare investors anymore, it could even be seen as a sign of progress.
But that raises two key questions:
Is AI really replacing workers ?
If so, what happens to the broader economy and ?
📊 What the Data Says So Far
Surprisingly, unemployment in the U.S. has increased only slightly since AI went mainstream.
It’s a slow, healthy rise not a surge. So i t doesn’t seem like AI is replacing workers at scale just yet.
That’s good news in one sense, if unemployment remains low, consumer demand stays healthy, and the economy keeps running.
However, it also means that companies’ fixed costs haven’t really improved, and their productivity gains from AI are still very moderate , far from the exponential growth that the market seems to be pricing in.
💡 My current View
From my perspective, this chart makes one thing very clear.
The benefits of AI , as of today, are still much smaller than what the market is assuming.
Yes, AI will improve margins and efficiency over time. But if everyone implements it, competition will eventually push prices down again, and margins with them. The very same than internet with the online sales.
The real challenge won’t be for companies that adopt AI, but for those that don’t adapt fast enough , or for those that overspend on AI tools that fail to deliver meaningful returns.
☄️Some AI Stocks Are Starting to Show Doubt
Several major AI-related stocks are also showing concerning patterns . We don’t have confirmation yet , but it’s time to stay alert and be prepared in case the market starts breaking key support levels among the main players.
And the main index, S&P 500 is still in the bull zone but are key levels to watch closely:
🤔 What Do You Think?
Is AI truly transforming company performance as fast as investors believe?
Or are we witnessing a global over-excitement where expectations are running far ahead of reality?
The New Trading Era: From Machine Intelligence to Human EdgeThe Oracle That Doesn’t Think but Mirrors
Everyone’s talking about the “rise of artificial intelligence” in trading, algorithms replacing traders, neural networks predicting the next move, machines that seem to think.
But the most extraordinary thing about machine intelligence isn’t its brilliance. It’s its astonishing ability to mirror, to absorb vast amounts of past data and recreate patterns it has already seen. A gigantic echo chamber of past realities.
In other words, what we call “intelligence” in these systems is not understanding, it’s reproduction. They don’t reason; they recognize. They don’t imagine; they approximate.
And yet, that ability to reflect a million past environments can feel almost magical, especially when it responds with coherence that seems human.
But here’s the quiet paradox: one the industry rarely talks about: What we’re witnessing isn’t a new form of intelligence; it’s a new kind of mirror, one that reveals how little we truly understand about our own decision-making.
When Machines Need to Learn the Market Every Day
For most of us, our first real encounter with AI came through models like ChatGPT, tools that belong to a specific subgroup of machine learning known as Large Language Models (LLMs), designed to simulate human-like conversation. That’s where our perception of AI as “brilliant and almost magical” was born. LLMs seem capable of answering anything, from trivial questions to complex reasoning.
Their power, however, doesn’t come from understanding the world. It comes from an extraordinary ability to predict language, a task that, despite its apparent complexity, is remarkably stable and mathematically manageable. The rest is simply scale: access to a massive database of accumulated knowledge, allowing the model not only to predict the next word but also to recreate an entire response by recognizing and recombining patterns it has already seen a million times before.
To understand this better, think of your phone’s autocomplete as a miniature version of ChatGPT, it guesses your next word based on your previous conversations. In such a stable environment, consistency is easy. That’s why language models achieve such high accuracy: their elevated “win rate” comes from playing a game where the rules rarely change.
They may look brilliant, but it’s better to say they’re simply hard-working machines in a stable world.
Trading, however, exists on the opposite side of the spectrum. It lives in a non-stationary world, one where the rules constantly evolve. Today’s conditions will be different tomorrow. Or in five minutes. Or in five seconds. No one knows when or how the shift will happen.
Here lies the crucial difference: a model that “understands” English doesn’t need to relearn grammar every week. A model that trades must relearn market reality every day.
Machine learning thrives on repetition. Markets thrive on surprise.
The Real Disruption: Human Understanding + Machine Power
By truly understanding the capabilities and limitations of machine learning in trading or more broadly, artificial intelligence, we realize that the future isn’t about removing humans from the equation. It lies in understanding how machine power compounds in the right hands.
The next era of trading won’t be about replacing human judgment but amplifying it.
Human contextual reasoning, our ability to interpret uncertainty, adapt, and make sense of nuance, can be combined with the machine’s immense capacity for data processing and execution.
Machines bring speed, scale, and memory. Humans bring intuition, flexibility, and judgment.
The synergy happens when both play their part: the trader designs the logic; the machine executes it flawlessly.
Machines cannot think, but they can learn, replicate, and act at a scale humans simply can’t compete with. When contextual thinking meets computational power, that’s not artificial intelligence, that’s real intelligence.
The trader who treats AI as a tool builds an edge. The one who treats it as an oracle builds a trap.
A Simple Manual for Thinking Right About AI in Trading
Never delegate understanding.
Let the machine calculate, but you must know why it acts. You can outsource the coding of a model, but never the architecture of your trading logic. The logic, the “why,” must remain human.
The basics still apply.
Machine learning doesn’t replace the foundations of trading, it only amplifies them. Risk management, diversification, position sizing, and discipline remain non-negotiable. A model can process data faster than you ever could, but it can’t understand exposure, capital allocation, or your personal tolerance for risk. Those are still your job.
Stay probabilistic.
The use of ML in trading doesn’t erase the hardest lesson of all: predicting prices is a false premise. The right question isn’t “Where will the market go?” but “How should I respond to what it does?” Now imagine the power of machine intelligence working within that probabilistic framework: a system designed to maximize your account’s expected value, not to guess Bitcoin’s price next month. That’s where the real explosion of potential lies.
Build systems that can evolve.
The future won’t belong to the trader with the smartest model, but to the one with the most adaptive one. And remember, you must be the most adaptive asset in your system. Markets evolve; your models must too. There’s no such thing as “build once and deploy forever.” In trading, anything that stops learning starts dying.
From the Illusion of Machine Intelligence to the Power of Human-Driven ML
Machine intelligence isn’t a new oracle, it’s a new instrument. In the wrong hands, it’s noise. In the right hands, it’s leverage. It can multiply insight, scale execution, and compound returns, but only when driven by an intelligent trader who understands its limits.
The trader understands, the machine executes. The trader teaches the machine; the latter amplifies the former’s reach.
In the end, it’s never the algorithm that wins, it’s the human who knows how to use it. And when both work together, one thinking, one learning, that’s not artificial intelligence anymore.
That’s compounded intelligence.
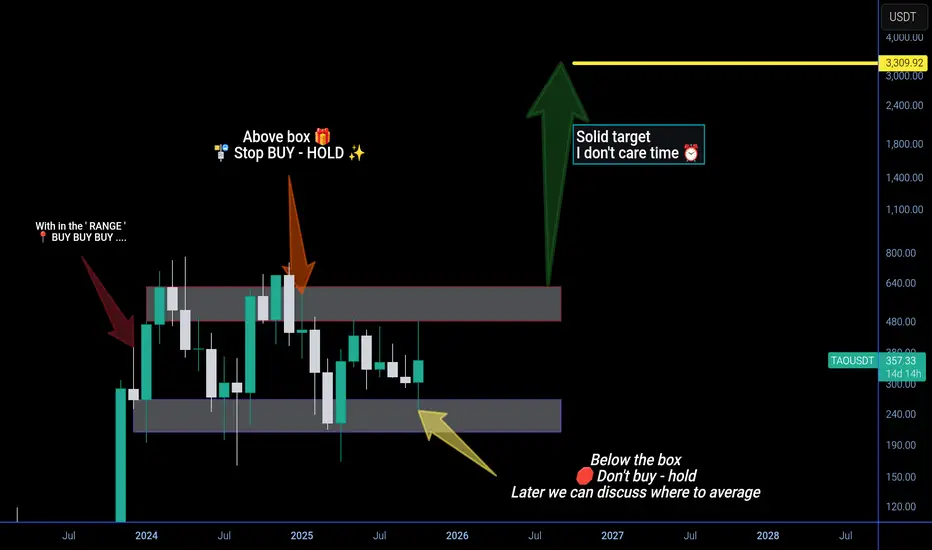
Future is AI - win or lose but I hold and support it upto $3k" DYOR / NFA " ⚠️
i support BINANCE:TAOUSDT for future strong project , i don't care about time but I care only one target $3000 above for one COINBASE:TAOUSD .
Note - time and future price candle change the price forecast ,
so pls be updated by following the post 📯 .
With in range always BUY
‼️ Stop buy above _&_ below the box ☑️
1TAO = $3000+
Teradyne Inc $TER | Precision in Every Robot Move BUYTeradyne delivers precision testing and automation hardware that keeps industrial robots running at peak performance. Perfect execution starts with NASDAQ:TER at the core of manufacturing and assembly lines worldwide.

Honeywell Int $HON | Industrial Automation Titan STRONG BUYHoneywell has long been a powerhouse in the automation space, and with its portfolio of robotics solutions, it is reshaping how assembly lines and industrial environments work. Expect big moves as robotics adoption accelerates.

NVDA : The Engine of Robotic Intelligence More BUYSNvidia's chips and AI platforms power the nervous system of modern robotics, enabling real-time processing, deep learning, and autonomous decision-making for next-gen machines.
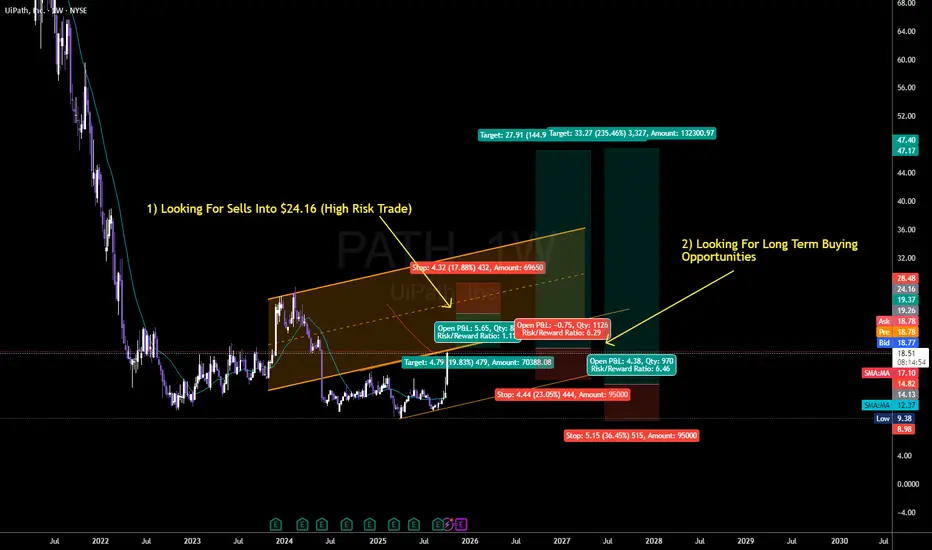
UiPath : Unleashed Potential SELL Then BUY It!UiPath redefines enterprise automation, freeing human potential with advanced RPA and process orchestration. Their software is the traffic controller that coordinates robotic fleets in modern business.
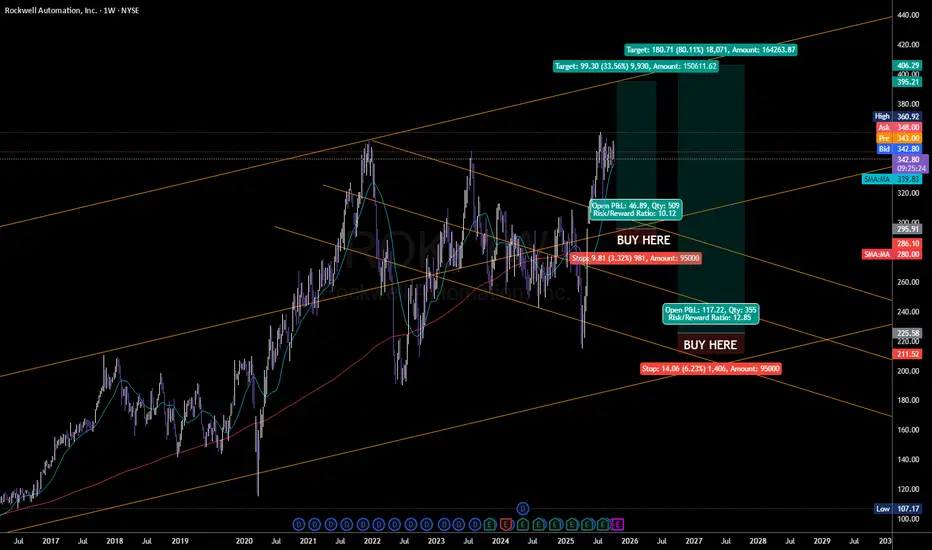
Rockwell: Powering the Pulse of Smart Automation BUYRockwell Automation stands at the heart of industrial transformation, driving efficiency with cutting-edge automation tech. Their comprehensive solutions empower global factories to automate, scale, and compete in the age of intelligent robotics.
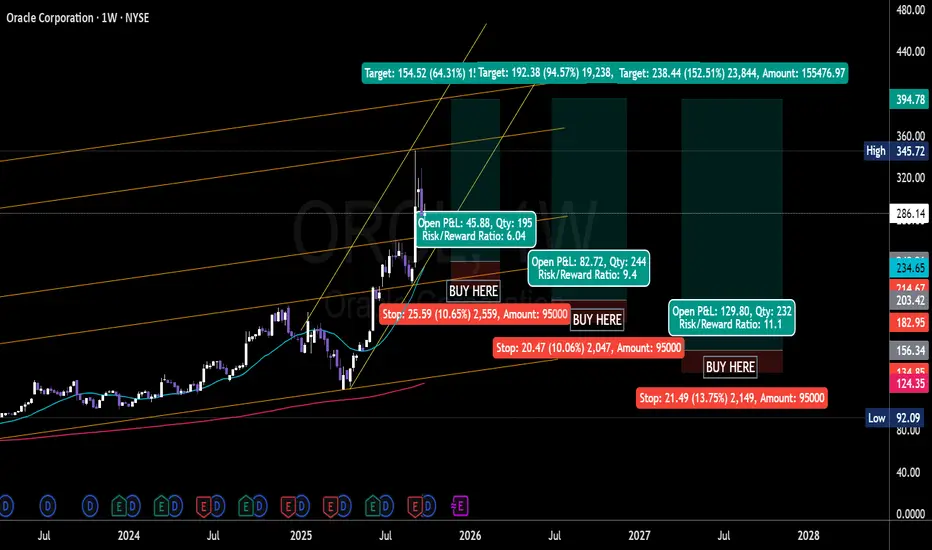
Oracle’s $1 Trillion Quest: Can AI Power the Next Big Move? BUYOracle’s stock has soared nearly 88% in 2025, approaching a $1 trillion market cap, driven by massive demand for its AI cloud infrastructure and multi-billion-dollar contracts with leading tech firms. With a record $138 billion in contracted AI business and industry-leading cloud integrations, Oracle’s unique enterprise-first AI strategy sets it apart from hyperscale rivals. In this analysis, explore technical signals, growth forecasts, and key risks as Oracle seeks to cement its place among the world’s top AI powerhouses. Is a fresh breakout on deck, or is the trade getting crowded? Let’s break down the setup and what traders need to watch now
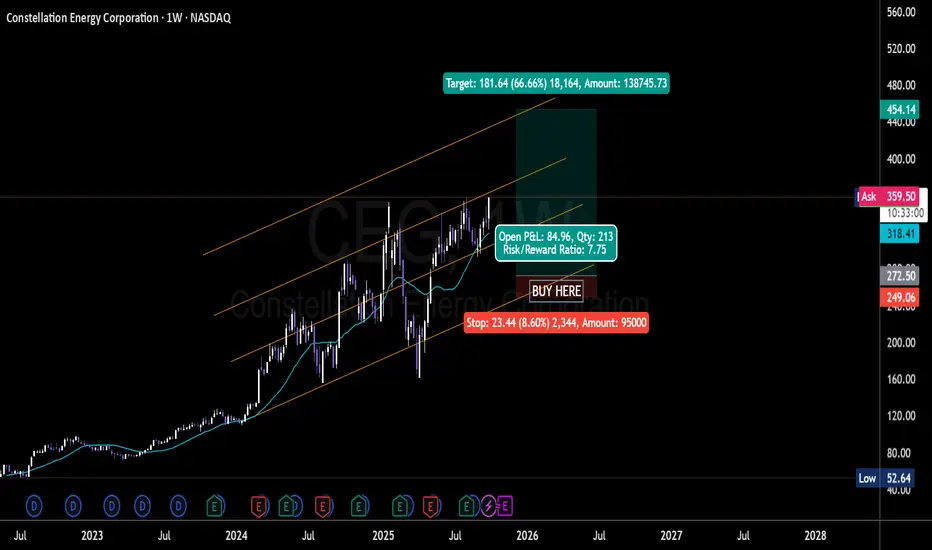
Constellation Energy CEG Clean Energy Utility Leader BUYConstellation Energy is the largest producer of carbon-free energy in the U.S., leading in nuclear, wind, solar, and hydro power generation. With utilities shifting to renewable solutions, CEG offers investors a stable yet growth-oriented play on the clean energy transition.
NEARUSDTNear Protocol (NEAR) is a layer-1 blockchain designed to be fast, scalable, and user-friendly. It uses a unique sharding technology called Nightshade, which allows the network to process thousands of transactions per second with low fees. NEAR focuses on developer and user experience—wallets can use human-readable names instead of complex addresses, and apps are built to feel like Web2 platforms.
Its token NEAR is used for transaction fees, staking, and governance. The ecosystem is strong in DeFi, NFTs, and Web3 apps, and it positions itself as a competitor to Ethereum, Solana, and Avalanche.

Globant | GLOB | Long at $55.00Globant NYSE:GLOB - an IT and software development specializing in AI-driven digital transformation and engineering. The company has partnerships with AWS, Google Cloud, Unity, and Slack, while collaborating with clients such as Google, Electronic Arts, Santander, and Rockwell Automation to deliver enterprise AI and custom software services.
Technical Analysis:
Price for NYSE:GLOB has fallen into my "crash" simple moving average zone. This often, but not always (still a "major" crash zone further down), signals a bottom. The current crash zone extends to $45 and there is a high possibility the price may dip that low in the near-term. Long-term, given the potential earnings and revenue growth, it looks undervalued at its current price.
Earnings and Revenue Growth Between 2025 & 2028
Projected Earnings Growth: ~17% increase (from ~$2.4B in 2025 to $2.8B in 2028)
Projected Revenue Growth: ~96% increase (from ~$157M in 2025 to $309M in 2028, at 28.7% CAGR).
Health
Debt-to-Equity: 0.25x (very good)
Altman's Z-Score/Bankruptcy Risk: 3.5 (excellent/very low risk)
Quick Ratio/Ability to pay current bills: 1.7 (great, low risk)
Action
Due to the good growth potential of NYSE:GLOB , the connections / partnerships it currently has with major companies, and solid financial health, I am personally going long at $55.00. More shares will be gathered if the price reaches the $40's and the fundamentals remain the same.
Targets in 2028
$75.00 (+36.7%)
$100.00 (+81.8%)

Wix | WIX | Long at $124.35NASDAQ:WIX is a company with steady growth projections driven by AI adoption, market expansion, user acquisition, and a focus on profitability. For example, earnings are forecast to grow 28.24% per year. Analysts project NASDAQ:WIX to achieve approximately $1 billion in free cash flow by 2028. While the current P/E is around 47x, its Forward P/E ratio is approximately 18x (potentially undervalued). I truly believe the changing economy will shift individuals into more entrepreneurship (what else can they do?) and that will be the driving force behind user growth.
From a technical analysis view, the price recently bounced off from my historical simple moving average band (often an area for share accumulation / consolidation). While it may trickle down to close the price gap on the daily chart near $110 in the near-term, I think the outlook needs to be long-term here given the projections. The only issue I see is the current high debt for NASDAQ:WIX , but interest rates are absolutely coming down soon which will help ease the strain.
Thus, at $124.35, NASDAQ:WIX is in a personal buy zone.
Targets into 2028:
$175.00 (+40.7%)
$250.00 (+101.1%)

Adobe | ADBE | Long at $347.44Adobe NASDAQ:ADBE
Technical Analysis:
Trend is, overall, moving sideways. The price gap on the daily chart between $303.29 and $317.87 is likely to be closed in the near-term. The stock may reach the $280's to $290's to form a double bottom before a move up, so short-term investors should note the near-term risks. Long-term, however, if growth projections are accurate, all of those price gaps above the current price are likely to be filled...
Earnings and Revenue Growth
Expected annual revenue growth between 2025-2028 is ~41% (cumulative), growing from around $23.7 billion in 2025 to $33.3 billion in 2028.
EPS growth from $20.7 in 2025 to $26.2 in 2028.
www.tradingview.com
Health
Debt-to-Equity: 0.53x (very good)
Altman's Z-Score/Bankruptcy Risk: 10.2 (excellent/very low risk)
Quick Ratio/Ability to pay current bills: 1.02 (okay, but some risk)
Insiders
Warning: Selling heavily outweighs buying.
openinsider.com
Action
Due to the high-growth potential of NASDAQ:ADBE related to AI and its current "value" (compared purely to the rest of tech), solid health, etc., I am personally going long at $347.44. More shares will be gathered if the price reaches the low $300's or between $280-$300 and the fundamentals remain the same. Only major warning is the amount of insider selling.
Targets in 2028
$450.00 (+29.5%)
$645.00 (+85.6%)

Atlassian Corp | TEAM | Long at $180.12Atlassian Corp NASDAQ:TEAM
Technical Analysis:
Currently trading withing my historical simple moving average zone (i.e. reversion to the mean). This area is typically reserved for share accumulation. Many gaps above to close (as high as $420.80. I anticipate the price to stairstep up over the next few years as the company moves to AI.
Earnings and Revenue Growth
3x EPS growth by 2028 and revenue growth from ~$5 billion to ~$9 billion.
www.tradingview.com
Health
Debt-to-Equity: 0.73x (good)
Altman's Z-Score/Bankruptcy Risk: 6.8 (excellent/very low risk)
Insiders
Warning: Tremendous amount of selling.
openinsider.com
Action
Due to the high-growth potential of NASDAQ:TEAM and solid health, I am personally going long at $180.12. Only major warning is the amount of insider selling.
Targets in 2028
$223.00 (+23.8%)
$380.00 (+111.0%)

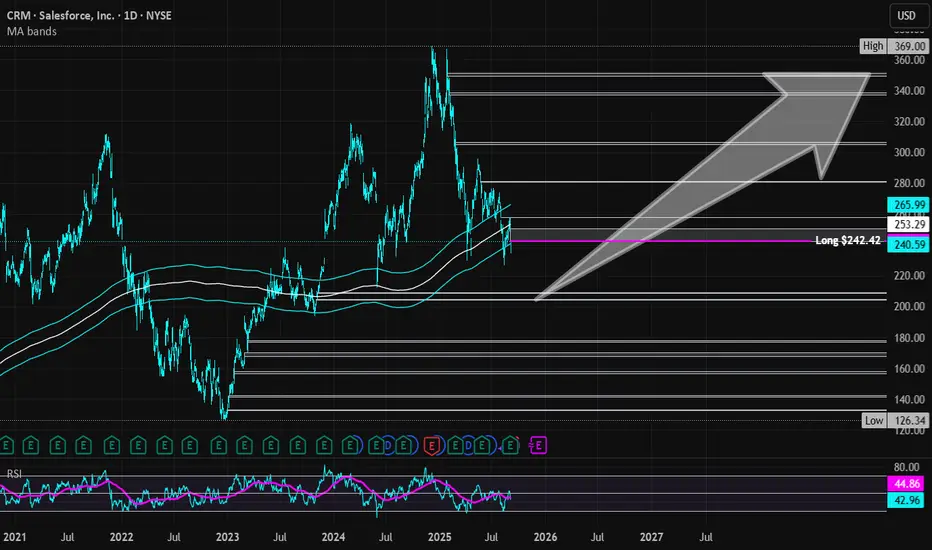
Salesforce | CRM | Long at $242.42Salesforce NYSE:CRM : firing their workforce... migrating toward an AI-driven Agentforce platform, instating a $20 billion increase to its share buyback program (now totaling $50 billion), and strong growth in regions like the UK, France, Canada, and Asia Pacific (particularly among small and medium businesses). The CEO recently declared significant productivity gains (e.g., 30% in engineering) through digital labor and expressed optimism about supporting U.S. government efficiency with Agentforce.
What's good for business isn't necessarily good for the common people. Welcome to AI, folks!
It looks like NYSE:CRM is moving toward a future of full AI. Even if revenue dips due to a slowing economy, I except earnings to soar higher and higher by dropping the humans from the payroll...
Thus, at $242.42, NYSE:CRM is in a personal buy zone as it bounces within my historical simple moving average band. Near-term, I think the price may dip into the low $200's if the US economy continues to show signs of weakening. But AI is only going to boost returns... fortunately for investors, but unfortunately for the workforce...
Targets into 2028:
$306.00 (+26.2%)
$350.00 (+44.3%)