GOLD - Correction after the rally. Focus on support!FX:XAUUSD , after hitting a new all-time high of 5597, is entering a correction phase due to profit-taking triggered by local news. Overall, the structure is bullish, and the market will be able to return to growth after the pullback.
Fundamental situation
Trump's threats against Iran and Tehran's response. The active conflict between Russia and Ukraine generally supports interest in hedge assets.
Fed : Rates remain unchanged, investigation against Powell and pressure on the Fed undermine confidence in the regulator's independence. The market still expects two Fed rate cuts in 2026.
Near-term indicators: US jobless claims data (today). Any further weakening of the dollar or escalation of geopolitical tensions will resume gold's growth.
Gold's correction is a natural pause after a sharp rise. The combination of geopolitical risks, pressure on the Fed, and a weak dollar supports the uptrend. Pullbacks to $5475 - 5391 can be seen as a buying opportunity.
Resistance levels: 5515, 5595, 5597
Support levels: 5475, 5453, 5391
After strong growth, the market may form a correction of 50-70% relative to the momentum formed within the trading session. All attention is on the support zones: 5475, 5453, 5391. A long squeeze will provide an opportunity for growth.
Sincerely, R. Linda!
Ascending Triangle

GOLD - Correction ahead of the Fed meeting. What next?FX:XAUUSD hit a new high of 5311 and entered a correction phase (profit-taking) ahead of the Fed's interest rate meeting...
Fundamental situation
Tensions between the US and NATO over plans for Greenland. Trump's threats to impose 100% tariffs on goods from Canada. Fruitless negotiations between Russia and Ukraine
Fed:
Expectations that rates will remain unchanged at the January 31 meeting. Powell's tone and the appointment of a new Fed chair (announcement possible today) could increase volatility. However, the market is pricing in two Fed rate cuts in 2026, despite a possible pause in the near term.
US consumer confidence index fell to an 11.5-year low (84.5), supporting demand for gold
Resistance levels: 5285, 5310, 5350
Support levels: 5250, 5230, 5190
Gold maintains its upward momentum thanks to geopolitical risks and expectations of a soft Fed policy. However, news volatility could trigger a correction before the growth continues. Focus on key (marked) support levels.
Best regards, R. Linda!

GBPUSD - The hunt for liquidity before the trend continues FX:GBPUSD entered a local correction phase amid a pullback in the dollar after a strong rally. The main trend is bearish, and growth after the correction may continue.
A correction has been forming since the opening of the session. The dollar is recovering slightly, while the pound is correcting towards the daily level of 1.377 and the Fibonacci area of 0.5-0.6. If the bulls hold back the correction, the market may return to the trend.
The main/medium-term trend is bullish. The correction and false breakout of support may shift the imbalance of forces towards buyers, which could trigger growth from strong levels.
Resistance levels: 1.3831, 1.38688
Support levels: 1.377, 1.3748
A false breakdown of support and the upward trend line could trigger growth within the main trend
Best regards, R. Linda!

GOLD - The market bought the dip. ATH retest. 5150?FX:XAUUSD , after an aggressive rally, faced a correction (profit-taking) near 5100. However, the market is quickly buying back the decline and is once again storming the ATH with the aim of continuing its growth.
Fundamental situation
- Trump continues to escalate relations with Canada (new tariffs) and maintains tensions with the EU...
- Russia-Ukraine negotiations in Abu Dhabi ended without result, which maintains geopolitical risks.
- The Fed meeting (decision on January 31) will be the main event of the week. Rates are expected to remain unchanged, but Powell's tone could cause volatility. However, the market expects two Fed rate cuts in 2026.
Technically, the market has the potential to continue its movement due to fundamental support.
Resistance levels: 5100, 5111, 5125, 5150
Support levels: 5075, 5055
In the current situation, it is logical to consider two scenarios:
- steady growth without pullbacks and a storming of resistance could lead to a breakout of 5100 and an upward momentum. Local target 5125-5150
- retest of the liquidity zone (long-squeeze) 5075 - 5055 before continuing growth
Best regards, R. Linda!

Beautiful Breakout of Ascending Triangle.OBOY Analysis
Closed at 12.69 (09-01-2026)
Beautiful Breakout of Ascending Triangle.
10.90 - 11.55 seems to be a very Important Support.
Upside resistance is around 16, however mid way
resistance still lies around 12.50 - 13.50
Breaking 10 may bring the price towards 9 -9.10

GOLD - Waiting for a pullback to enter a long position...FX:XAUUSD continued its record growth for the sixth consecutive day, reaching $5,110. The driving forces behind this are geopolitical uncertainty, expectations of a softening of Fed policy, active purchases by central banks, and an outflow from the dollar...
Fundamental drivers
Geopolitics: Russia-Ukraine, Trump's threats of 100% tariffs on Canada, and the risks of further escalation with the EU...
The dollar fell to its lowest level since September 2025 due to interventions by the Bank of Japan and expectations of interest rate cuts. At the same time, central banks in many countries continue to show high interest in the metal.
The Fed's interest rate meeting is coming up (January 31 - February 1). The tone of the regulator is important; there are doubts about further rate cuts, and if this is confirmed, the market may enter a correction...
Resistance levels: 5110, 5150
Support levels: 5080, 5055, 5031
Technically, it is quite risky to open long trades from the current price position (in the 5090 zone). I recommend waiting for a correction to the specified support zones to find more profitable and safer entry points!
Best regards,

AUDCAD higher bullish for expect
OANDA:AUDCAD we are have break of long PA, currently price in zone and we have ASCENDING TRIANGL, from here expecting higher bullish push.
SUP zone: 0.92800
RES zone: 0.94000

GOLD - Test $5000... Will the rally continue?FX:XAUUSD closes Friday's session with a new record and consolidation after the rally. Focus on 4988 - 4968. The session closed quite favorably for continued growth, everything depends on Asian traders...
Fundamentals:
The tense situation between Trump and the EU over Greenland and tariffs is still present. The Bank of Japan intervened (which strengthened the yen), triggering a fall in the dollar, which in turn is affecting the price of gold. Overall, the market remains aggressively bullish.
New session:
- Fed meeting (January 31) – focus on Powell's tone. Softening rhetoric on inflation could weaken the dollar and support gold.
- Selection of a new Fed chair (announcement possible by the end of January) – candidates Waller or Warsh are perceived as more “dovish,” which could put pressure on the dollar.
- Geopolitics – any escalation with Iran will trigger a new influx into gold
Resistance levels: 4988, 5000, 5024
Support levels: 4967, 4958, 4945
Gold maintains its upward momentum, driven by a weak dollar and geopolitical risks. Any correction is likely to be limited.
Asian traders may buy up all the supply. A breakout and close above 4988 could trigger a continuation of the rally to 5025-5050. However, it is possible that the market may test support at 4958-4945 before rallying...
Best regards, R. Linda!

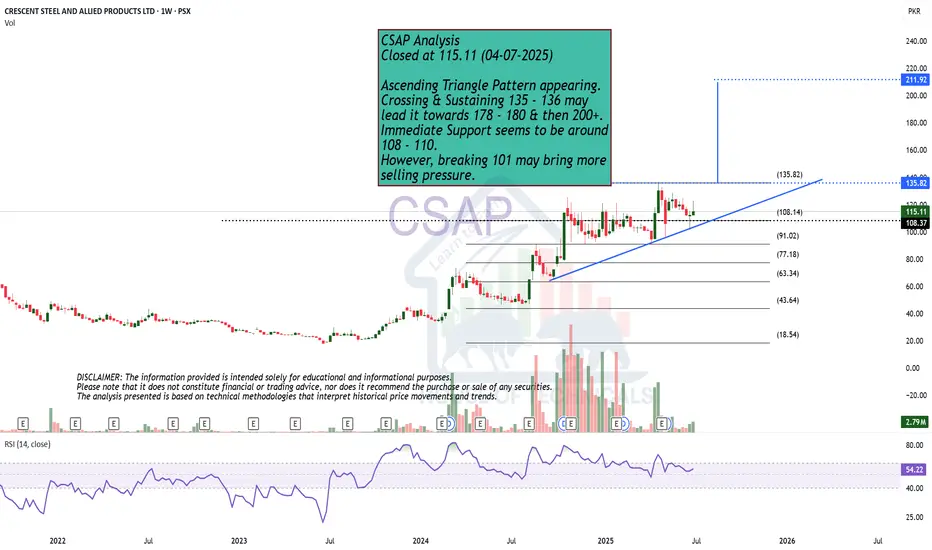
Ascending Triangle Pattern appearing.CSAP Analysis
Closed at 115.11 (04-07-2025)
Ascending Triangle Pattern appearing.
Crossing & Sustaining 135 - 136 may
lead it towards 178 - 180 & then 200+.
Immediate Support seems to be around
108 - 110.
However, breaking 101 may bring more
selling pressure.
Ascending Triangle appearing.ATRL Analysis
Closed at 764.18 (08-01-2026)
Ascending Triangle appearing.
Immediate resistance is around 765 - 790.
Crossing & Sustaining this range may give
a breakout towards 1200+
Breaking 645 may bring more selling pressure towards
560 - 600.

GOLD - Correction to 4900. Is there a chance it will reach 5000?FX:XAUUSD continues to update historical highs. New 4967, bears appeared (profit-taking). The market has moved into correction, but the overall fundamental (geopolitical) background is still complex...
Expectations of further easing of Fed policy remain the main factor supporting gold.
Trump's reversal on Greenland temporarily improved sentiment, but did not stop the flow into defensive assets.
Economy : GDP for the third quarter has been revised upward to 4.4%. Core PCE (inflation) rose to 2.8% y/y. Jobless claims (200,000) were better than expected.
Despite strong indicators, the dollar is weakening amid the general trend of de-dollarization .
Today, preliminary PMI (business activity) data for key regions will be released.
The figures may affect global sentiment, but are unlikely to change the main upward trend for gold.
Resistance levels: 4935, 4967, 5000
Support levels: 4900, 4888, 4870
The current correction is a distribution of the formed consolidation 4935 - 4967. In the context of the current movement, the market may test the key support area (liquidity zone) 4900 - 4888. I do not rule out a deep long squeeze (to 4870) before renewed interest in growth. In the current cycle, there is a possibility of a retest of 5000!
Best regards, R. Linda!

GBPUSD - Readiness for a breakthrough and rally FX:GBPUSD breaks through the resistance conglomerate and enters a long zone. Consolidation is forming (due to bullish activity), and we have a chance for a local rally...
The long squeeze of the key support zone at 1.3400 forms distribution and growth towards the intermediate resistance at 1.3486. The trend is bullish, there is support in the market (weak dollar).
The currency pair breaks through resistance with an impulsive movement, after which the bulls try to keep the price above 1.3486. A breakout of the local base will give a chance for continued growth to 1.3562 - 1.3671
Resistance levels: 1.3486, 1.3507, 1.3562
Support levels: 1.3486, 1.3456
Consolidation above 1.3486 - 1.3500 will be a strong signal of readiness to continue growth within the bullish trend
Best regards, R. Linda!

EURUSD - Retest of support at 1.170 on a bullish trendFX:EURUSD is in a bullish trend phase and is forming a correction to retest the key psychological support level. Bulls may influence the situation...
The dollar has fallen sharply due to economic problems, which has triggered a rise in the euro, which is trying to stay above 1.170.
After rallying and updating the interim high to 1.1768, the currency pair entered a correction phase and is testing 1.170, an important technical and psychological support level.
Support levels: 1.1700, 1.1672, 1.1685
Resistance levels: 1.1763, 1.1804
A false breakdown and the bulls holding the price above 1.170 could form a reversal pattern and give a chance for growth within the local bullish trend
Best regards, R. Linda!

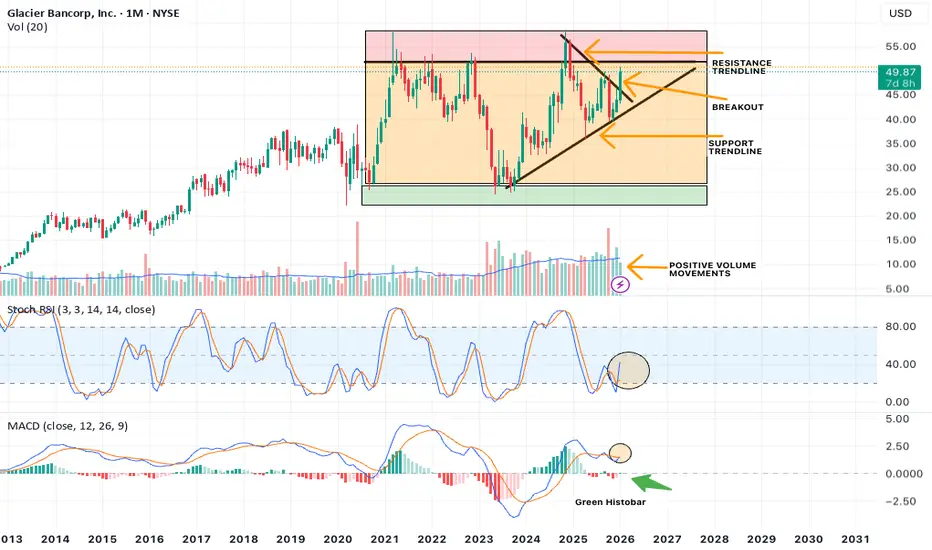
MACRO Bullish Case for GBCI on 1 MonthGlacier Bancorp (GBCI) has some Macro develops that have caught my eye on the 1 Month timeframe.
With the right lower timeframe signals, there may be a trade at some point.
Ill be looking at price action, chart patterns, indicators, candle configurations and more to continue my assessment on this.
NOTE: Being that this initial assessment is on 1 Month, keep in mind we still have 8 days for this month's candle close.
Also being that this is on 1 Month, price movements can showcase strong macro level trends, with potential long duration.
WHY this stock has caught my fancy?
Note price action, we are in a clear uptrend, maintaining the support trendline.
We are also currently breaking out of a Resistance trendline that was responsible for the declines from its top at roughly $58.00.
Though breakout seen, we are still in need of confirmation. Which we maybe able to gauge at in the 1 week.
The candle responsible for breakout is a massive Engulfing Bullish Candle.
We are also getting close to the Resistance Zone depicted by the red rectangle placed. WHich is an extreme Supply zone. It won't be easy to get past this so keep in mind potential push back.
Areas to consider Support test on the Resistance trendline and the Uptrend Support trendline.
Also we may be in a Ascending Triangle Pattern created by Support trendline + Horizontal Resistance.
Other Signs:
VOLUME: Positive Volume Uptrend, will need to see Volume Continue upward especially during breakout through resistance.
MOMENTUM Indicators:
If we maintain current trajectory of indicators at the close of this Months candle, Momentum will be on our side.
With Stoch RSI showcasing Bullish Cross above 20 lvl and MACD attempting to Cross ABOVE 0 lvl with Green histobar print.
All positive signs.
Such developments supports attention and observation on GBCI.
Look to more updates on this.
GOLD - Pullback before growth after Asian momentum FX:XAUUSD is correcting after hitting a historic high ($4,900), due to the de-escalation of tensions between the US and the EU. Profit-taking is observed, but the trend remains bullish...
Fundamental background:
- Trump has cooled down: tariffs are temporarily suspended, as is the forceful seizure of Greenland. Negotiations are likely to continue. The market reacted quite aggressively to yesterday's “swings” led by Trump.
Today, data on PCE inflation and US GDP for the third quarter will be released, which may provide new momentum.
Further dynamics will depend on inflation data: weak indicators may renew interest in defensive assets, while strong ones may increase pressure.
Resistance levels: 4838, 4850, 4880
Support levels: 4813, 4800, 4777
Technically, after the Asian momentum, gold may form a correction of 50% of the total movement. I consider the 4813-4800 area (liquidity area) to be a zone of interest. And as zones of interest at the top, I consider the 4850 area — the liquidity pool.
Best regards, R. Linda!

GOLD - Consolidation after the rally. Target 5000FX:XAUUSD continues to hit new record highs (the latest being 4888) amid escalating geopolitical tensions, global risk aversion, and a falling dollar...
Fundamental drivers:
Trump's pressure on the Fed and uncertainty over the appointment of a new chair are undermining confidence in US monetary policy.
Trade threats are increasing the risks of escalating conflict with the EU.
Today, PCE inflation data (October-November) and US GDP for the third quarter will be released.
Gold maintains its upward momentum thanks to political uncertainty and pressure on the Fed. Short-term corrections are possible after the data release, but the trend will remain bullish until geopolitical risks subside.
Resistance levels: 4877, 4888, 4900
Support levels: 4845, 4834, 4816
Gold has strengthened by 2.6% since the opening of the session and, having exhausted its intraday ATR, may move to local consolidation or retest key support zones before growth: 4845, 4834, 4816. The medium-term growth potential remains intact. The market is heading towards 5000...
Best regards, R. Linda!

GOLD - Aggressive bullish trend. Test of the 4725 zone...FX:XAUUSD continues to update its historical maximum, currently testing the 4725 zone, against the backdrop of escalating geopolitical risks and declining risk appetite...
Fundamental situation
Trump's threats to impose new tariffs on goods from the EU and the union's retaliatory measures have heightened fears of a trade war.
Escalation of the Russia-Ukraine conflict
The economic backdrop is contributing to the decline of the dollar, which in turn is supporting gold.
The key events of the week will be the US PCE inflation data (Thursday) and the revised GDP report for the third quarter.
Gold continues to rise due to geopolitical uncertainty and the weakening of the dollar. Further dynamics will depend on US inflation data — weak figures could strengthen the upward momentum, while strong figures could trigger a correction.
Resistance levels: 4725, 4750
Support levels: 4707, 4700, 4691
Growth has been halted by the psychological resistance zone of 4725. Since the opening of the session, the market has exhausted its intraday potential and may form a correction (profit-taking) and test the key support zones of 4710-4700 before continuing to grow.
Best regards, R. Linda!


Silver Forming an Ascending TriangleIn my previous analysis I thought Silver could possibly be forming a bull flag, but since the passage of time progressed I think it is forming an ascending triangle instead. Which is still bullish. Target price is approximately $95. Not financial advice, just a pattern I see potentially forming

GOLD - Consolidation after the rally before the rally...FX:XAUUSD started the week with growth, hitting a new all-time high amid geopolitical risks and threats of new tariffs from the US, and is now consolidating around $4,700...
Fundamental situation
Trump threatened to impose tariffs on eight European countries over the issue of buying Greenland.
Escalating tensions around Ukraine and Iran.
Fed:
Expectations of policy easing are supporting gold, but the appointment of a new Fed chair could slow down aggressive rate cuts. The investigation into Powell continues...
This week, PCE inflation data (Thursday) and US GDP for the third quarter are important.
Gold's rise since the beginning of the year has been independent of the strengthening dollar, underscoring the strength of internal drivers. However, a confident breakout to $5,000 will require confirmation of lower inflation in the US and continued high demand for safe-haven assets. Corrections may be profitable against the backdrop of an aggressive bullish trend...
Resistance levels: 4678, 4691, 4700
Support levels: 4656, 4650, 4640
Within the current range, I focus on the zones 4656 - 4650 - 4639. There is a high probability of a long squeeze/false breakout of support. However, I do not rule out the possibility of a local correction due to the holiday in the US (low liquidity, profit-taking may trigger a correction) before growth.
Best regards, R. Linda!

USDJPY - The correction may be over. Bullish trend The Japanese yen continues to weaken amid a strong dollar and due to the actions of the Bank of Japan. The currency pair may continue its bullish trend...
The global trend is upward. As part of the correction, the currency pair is testing support at 157.76 and forming a long squeeze. The reaction from the bulls is aggressive, and a breakout of the wedge resistance will provide an opportunity for growth.
The dollar is in an upward trend (locally), and this maneuver is supporting the currency pair against the backdrop of a globally weak Japanese yen.
Resistance levels: 158.185, 158.855
Support levels: 157.76, 157.38
If the bulls keep the price above the 157.76-158.0 zone, the market will have good potential and strong support to continue growing towards 158.8-159.5.
Best regards, R. Linda!

GOLD - A long squeeze of support could trigger growthFX:XAUUSD continues to consolidate, Friday's long squeeze (false breakdown) of support provides an opportunity for growth amid geopolitical issues...
The dollar is strengthening against the backdrop of Thursday's economic data and Trump's geopolitical actions, but against this backdrop, gold is behaving quite cautiously and looks quite strong.
Trump said that tariffs on eight European countries could rise to 25% if Greenland is not sold to the US - more tariffs and an escalation of the trade war could lead to a strong market reaction.
In the new trading week, we are awaiting Trump's speech (high volatility possible), US GDP, Core PCE, and PMI. The data may set the medium-term tone for the market...
Resistance levels: 4593, 4621, 4639
Support levels: 4581, 4561, 4550
The long squeeze has shifted the market imbalance towards buyers. Locally, we are seeing consolidation in the 4581-4593 zone. A close above 4593 or a retest of 4581 could trigger further growth within the current trend
Best regards, R. Linda!

ETHEREUM - Bullish market behavior pattern. Confirmation?BINANCE:ETHUSDT is forming a consolidation in the $3300 zone in a “descending wedge” pattern, which is a relatively bullish market behavior model.
The market is reacting to the improvement in the fundamental background, inflows of funds are increasing, and buyers are showing interest. Local trends are beginning to change for the better. After the rally, Bitcoin is trying to consolidate above 94-95K, and if it succeeds, we will have a green signal.
Ethereum is consolidating and fighting for the 3300 zone after implementing a U-formation pattern. Overall, there are signs of bulls in the market, and if buyers keep the price above 3300, the market will have an opportunity for growth.
The price is forming a descending wedge against the backdrop of a local bull market. A close above 3315 will be a confirming signal for growth.
Resistance levels: 3315, 3383, 3450
Support levels: 3300, 3281
The price has consolidated above 3300 and above 3315, as well as broken the resistance of the descending wedge. If the bulls keep the price above these key areas, another bull run may form...
Best regards, R. Linda!
