GOLD → The aggressive trend continues. Focus on 4240FX:XAUUSD continues to break records, testing the $4,240 level amid a weakening dollar and sustained demand for safe-haven assets. The risks of a correction are growing as economic news releases approach.
Key supporting factors: Statements by US officials about China's “seizure of supply chains” and retaliatory measures are keeping markets on edge. US shutdown: The government shutdown is costing the economy $15 billion a week, increasing uncertainty. The probability of a rate cut in October and December is ~95%, which is putting pressure on the dollar. However, statements by Fed officials may adjust market expectations.
The bullish trend for gold remains unchanged. Any corrections will be seen as a buying opportunity. Key benchmarks are the development of the trade conflict and negotiations on the resumption of the US government.
Support levels: 4212, 4203
Resistance levels: 4234, 4235, 4250
Within the uptrend, it is worth waiting for a correction to support in order to open positions more profitably. There are no reasons for a trend reversal, and the fundamental background is bullish. We expect a retest of support before growth. However, a breakout of the 4234-4239 zone could trigger further growth!
Best regards, R. Linda!
Ascending Triangle

USDJPY → False breakout? Target - gap?FX:USDJPY faces trend resistance during its rally and enters a correction. A retest of the range boundary is forming, the breakdown of which may trigger a sell-off.
The currency pair's growth, linked to the news, is slowing down. The price is testing the range boundary as part of a pullback, and the bullish reaction is weakening. Wednesday's daily candle closed below 151.23, which generally indicates buyer uncertainty.
Accordingly, there is a struggle for the 150.85 - 151.23 area, and the price closing below the key support zone will bring the price into the range. This, in turn, may provoke the closure of the gap (149.0 - 147.55).
Resistance levels: 151.23, 151.73
Support levels: 150.85, 149.93, 149.0
A false breakout and consolidation in the selling zone is a fairly strong signal that indicates the strength of the seller. A decline in the dollar index may trigger a decline in the price of the currency pair.
Best regards, R. Linda!

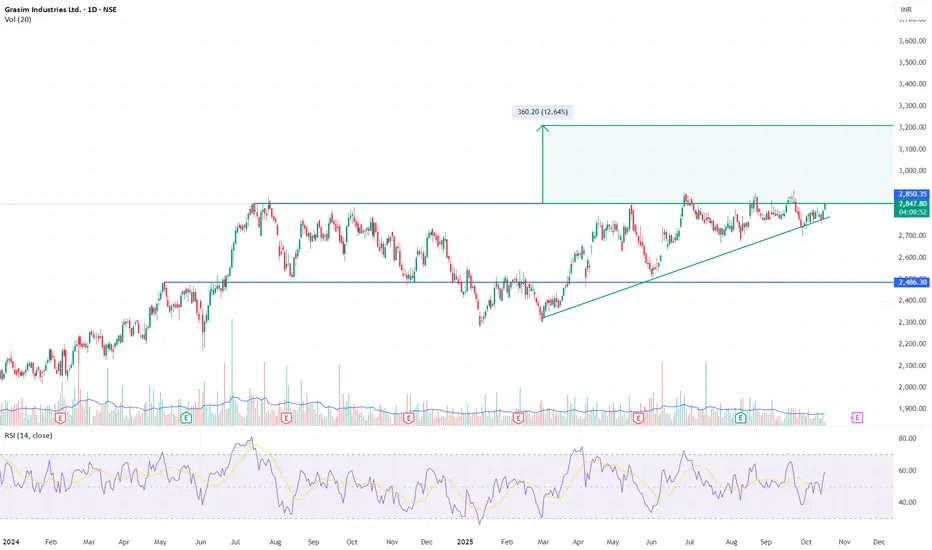
GRASIM – Base Pressure Building for Breakout Above ₹2,850Price has spent almost a year trapped between ₹2,480 and ₹2,850. Each dip since mid-2025 has formed higher lows, compressing against the same horizontal ceiling. Today’s candle closes right at ₹2,850 with RSI rising toward 60 — the structure is tightening for resolution.
A decisive close above ₹2,900 with strong volume will confirm breakout and open the path toward ₹3,200–₹3,250 (~12–13% measured move).
Setup: Ascending Triangle re-attempt
Entry Trigger: ₹2,900+ close with volume confirmation
Target Zone: ₹3,200–₹3,250
Support: ₹2,700
Invalidation: ₹2,680
Price has respected this structure for nearly a year; compression is mature, volatility contraction visible, and the next move should define direction.
Disclaimer: Not a recommendation. For educational purposes only.
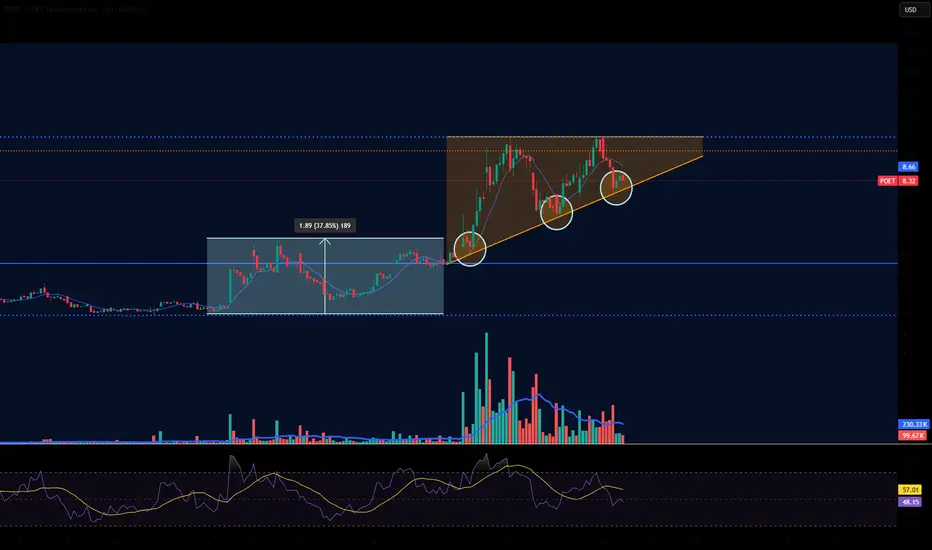
POET: Ascending Triangle Forming – Prime Bullish SetupWe’re seeing a classic ascending triangle pattern taking shape, which is one of the most reliable bullish signals in technical analysis. The pattern features a series of higher lows, showing building buyer support and increasing momentum, while the highs remain flat around the $8.66 resistance level (aligned with the SMA). This compression typically leads to a breakout to the upside once volume picks up and we clear that overhead line – and with the recent price action circling in on it, I’m eyeing a potential move higher soon.
Zooming in on the details: The main chart highlights the triangle with the ascending support trendline connecting those higher lows, and the flat resistance creating the “ceiling.” Volume is holding steady at around 99K-230K, with a spike in the lower pane suggesting interest is brewing. RSI is neutral around 48-57, not overbought yet, leaving room for upside without immediate pullback risk. If we break above $8.66, next targets could be $9.50 or even $10 in the short term, based on the pattern’s measured move.
Fundamentally, POET is firing on all cylinders. They just closed a massive $75 million private investment round to fuel growth in AI connectivity solutions. In an industry that’s notoriously power-hungry (think data centers and AI hardware sucking down energy), POET’s unique photonics tech offers efficient optical interconnects that cut power consumption while boosting speed. This positions them perfectly for the AI boom, and the funding news has already injected fresh momentum – shares are up, but there’s plenty more room to run.
GOLD → After the pullback, growth may continue. 4250 - 4300?FX:XAUUSD continues to break records, approaching the $4,200 level amid escalating trade tensions and expectations of Fed policy easing. A correction is forming before the possible continuation of growth...
Key growth drivers: Trump is considering a ban on Chinese vegetable oil imports, and the parties are imposing reciprocal port fees. The probability of a Fed rate cut in October and December exceeds 90%, despite Powell's cautious comments. The current correction in gold is seen as a buying opportunity.
Growth to $4250+ will continue if trade tensions persist and the Fed maintains its dovish rhetoric.
Resistance levels: 4200, 4218, 4250
Support levels: 4179, 4166, 4155
A pullback is forming. A false breakdown of the specified support zone could support further growth, provided that the bulls hold their defense above the specified levels. The market remains bullish and aggressive, and there are currently no technical or fundamental reasons for a deep correction
Sincerely, R. Linda!

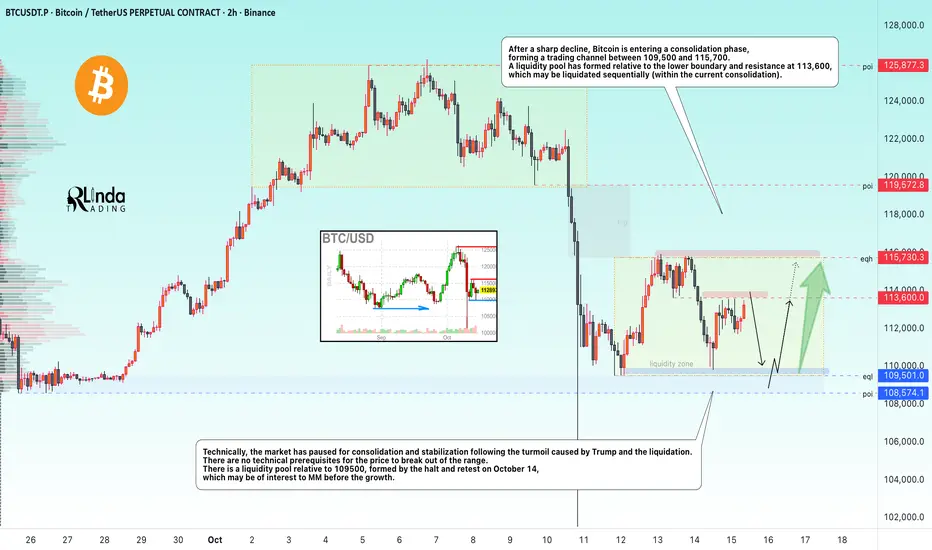
BITCOIN → Consolidation in the medium term. Focus on 109,5KBINANCE:BTCUSDT.P is forming a trading range after a sharp decline. Each distribution is followed by consolidation before the next distribution. Market phases in all their glory
After a sharp decline, Bitcoin is entering a consolidation phase, forming a trading channel of 109,500-115,700. A liquidity pool has formed relative to the lower boundary and resistance at 113600, which can be liquidated in turn (within the current consolidation).
Technically, the market has paused for consolidation and stabilization of the situation provoked by Trump and the liquidation. There are no technical prerequisites for the price to break out of the range. There is a liquidity pool relative to 109500, formed by the halt in the decline on October 11 and the retest on October 14, which may be of interest to MM before the growth.
Support levels: 109500, 108500
Resistance levels: 113,600, 115,730
Classic consolidation, the boundaries of which have not yet been tested. Possible false maneuvers relative to the specified levels to form a large MM position before moving in one direction or another in the medium term. Major players are still uncertain about further movement due to Trump's activism and his tariff strategy, which creates additional risks, and for this reason, I would not expect strong growth beyond the specified boundaries for now.
Sincerely, R. Linda!
GOLD → Correction to 4090. What could this mean?FX:XAUUSD , after updating its high to 4180, formed a correction and descended to the support zone of 4090, forming an intermediate bottom. We have a trading range...
Key drivers: China has introduced controls on rare earth metal exports, and the parties are holding consultations. A meeting between Trump and Xi Jinping is scheduled for the end of October.
Expectations of two rate cuts before the end of the year are strengthening gold's position. The ongoing government shutdown is fueling demand for safe-haven assets.
Today, attention is focused on Powell's speech, which could set the tone for the market.
The bullish trend for gold continues. The absence of bearish factors and ongoing macro risks continue to push the price up. Corrections are seen as an opportunity to buy.
Resistance levels: 4150, 4180
Support levels: 4117, 4090, 4059
The price is testing the 4150 liquidity zone, which could trigger a pullback within the range. A retest of support at 4117-4090 could support the market, and a change in imbalance could lead to another rally to 4180 - 4200
Best regards, R. Linda!

GOLD → Ready for continued growth. Target 4100 - 4125FX:XAUUSD remains above $4,000, starting the week with a record high amid the escalating trade war between the US and China. Traders bought up all of last week's decline.
Key drivers: Trump's new tariffs: Introduction of 100% tariffs on all Chinese goods and export controls on software from November 1. China is not sitting idly by: Restrictions on exports of rare earth metals and technologies.
The ongoing shutdown and trade uncertainty are weakening the dollar.
US inflation data (CPI on October 24) will be the first key release after the shutdown.
Speeches by Fed officials may adjust rate expectations.
Gold remains in an uptrend, but momentum will depend on the progress of trade negotiations. A breakout to new highs is likely if tensions remain high.
Resistance levels: 4078, 4100, 4110
Support levels: 4059
A breakout of 4078 and a close above the key level could trigger a continuation of the growth to 4100. An additional scenario could be a correction to 4059 before further growth to 4100-4125.
Best regards, R. Linda!

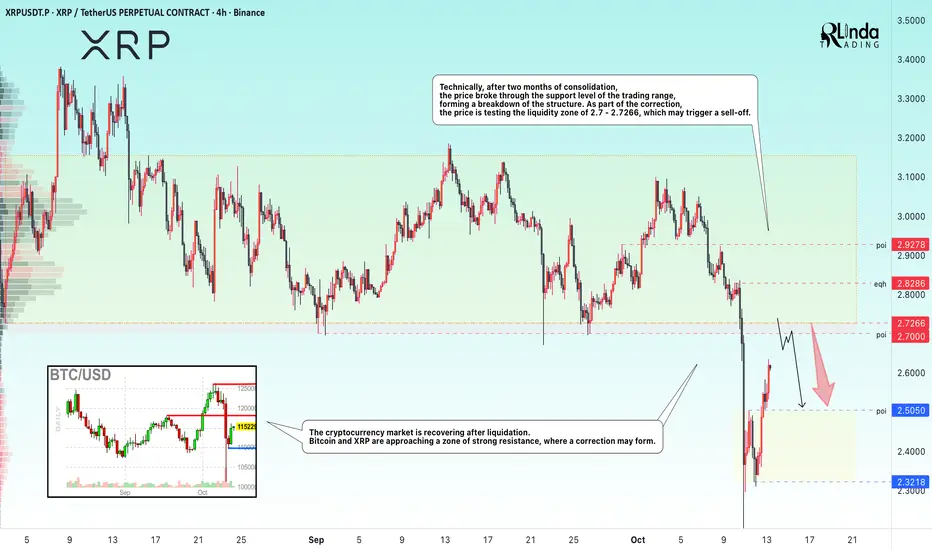
XRPUSDT → Resistance at 2,700 could trigger a correction BINANCE:XRPUSDT is forming a correction after a strong sell-off. It is not yet worth hoping for strong growth without pullbacks, as there is a strong resistance zone ahead.
The cryptocurrency market is recovering after liquidation. Bitcoin and XRP are approaching a strong resistance zone, where a correction may form.
Technically, after two months of consolidation, the price broke through the support of the trading range, forming a breakdown of the structure. As part of the correction, the price is testing the liquidity zone of 2.7 - 2.7266, which may trigger a sell-off.
Resistance levels: 2.7 - 2.7266, 2.8286
Support levels: 2.505
A sharp rise and the lack of technical potential to break through the resistance level of 2.70 may trigger a false breakout and a correction to the support level of 2.5050.
Best regards, R. Linda!
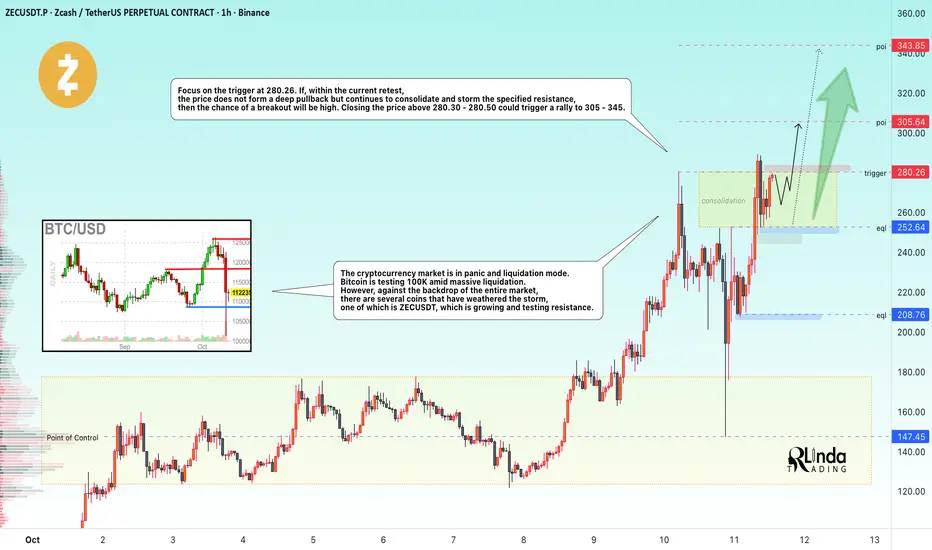
ZECUSD → The altcoin exception that is growingBINANCE:ZECUSDT withstood the blow of the global decline that affected the entire cryptocurrency market, liquidating long positions worth $10 billion. But even in such a situation, there can be exceptions ;)
The cryptocurrency market is in panic and liquidation. Bitcoin is testing 100K amid massive liquidation. However, against the backdrop of the entire market, there are several coins that have withstood the blow, one of which is ZECUSDT, which is growing and testing resistance
ZEC was also hit by the decline, but after testing the control point in the area of maximum volume density 145-155, the market aggressively and quickly bought up the altcoin, indicating bullish strength at the moment.
Resistance levels: 280.30, 305.65
Support levels: 242.64, 208.76
Focus on the trigger at 280.26. If, during the current retest, the price does not form a deep pullback but continues to consolidate and storm the specified resistance, then the chance of a breakout will be high. A closing price above 280.30 - 280.50 could trigger a rally to 305 - 345.
Best regards, R. Linda!
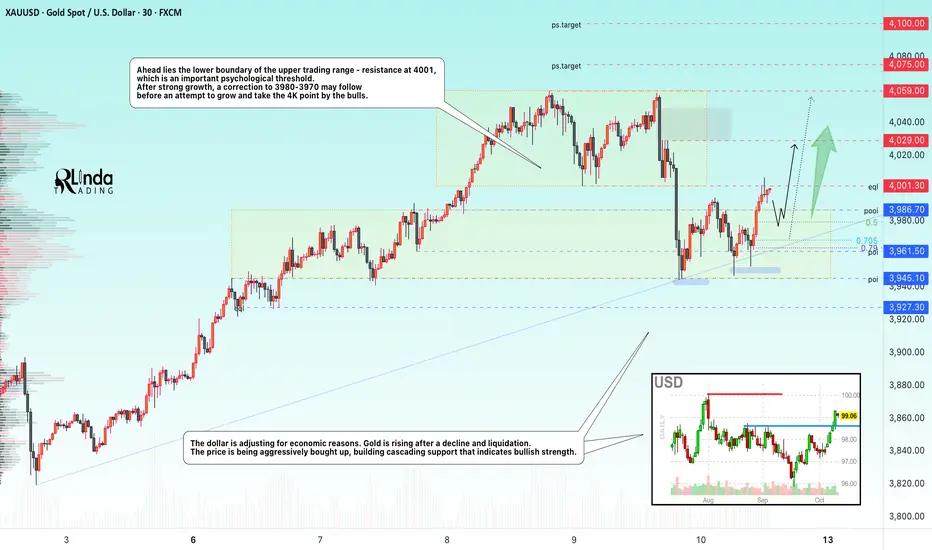
GOLD → Retest 4000. Pullback before a breakout and rise to 4100?FX:XAUUSD , after a sharp sell-off and testing of the 3950 support zone, is aiming to return to the $4000 level on Friday, preparing for its eighth consecutive week in positive territory.
The Senate adjourned for the weekend until Tuesday, postponing a decision on the shutdown. John Williams supported further rate cuts, Mary Daly confirmed her readiness for cuts, despite the fact that Powell did not say anything particularly interesting about policy on Thursday.
The upward trend in gold remains unchanged. The potential for growth to new highs remains, provided the shutdown continues and the Fed maintains its soft policy. The $4000 level remains a key psychological support.
Resistance levels: 4000, 4059, 4075
Support levels: 3986, 3980, 3968
The 4000 zone may prove to be strong resistance, so expect a battle (consolidation or trading range in this zone), during which the price may form a pullback to 3980-3970 before returning to 4K for a breakout attempt.
Best regards, R. Linda!
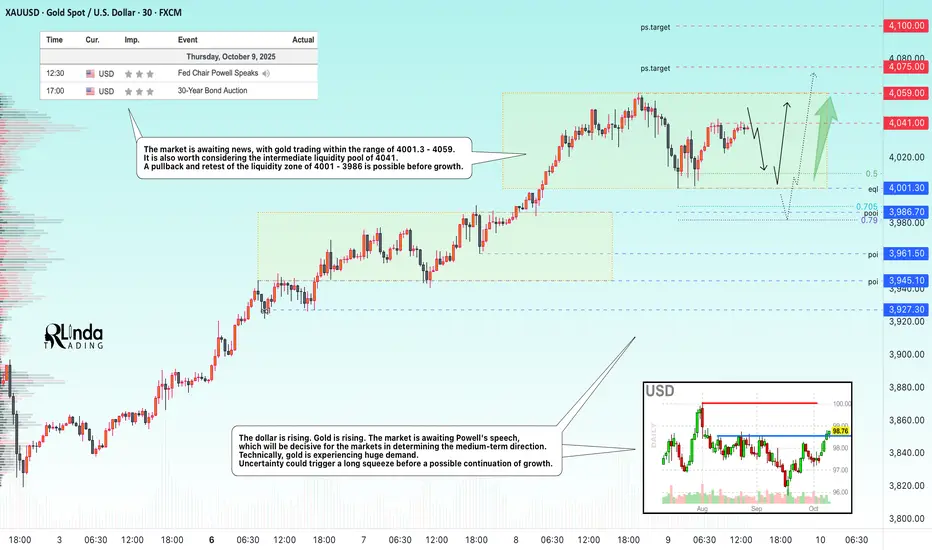
GOLD → The correction will provide a good opportunity for longFX:XAUUSD remains above the psychologically important level of $4,000, having corrected from a record high of $4,059. The market is awaiting Powell's speech, which could set the medium-term tone for the markets...
Key supporting factors: Uncertainty over the shutdown: The phased reopening plan has not yet been approved, which is keeping demand for safe-haven assets high.
Expectations of Fed easing: The probability of a rate cut in October is 100%, and in December is 80%, despite disagreements within the Fed.
As prices rise, the risks of a correction increase, especially against the backdrop of the Fed chair's speech.
Gold remains in a bullish trend. A correction to $4,000 looks like a healthy pause. Further dynamics depend on the Fed's tone and developments with the shutdown — a break below $4,000 is unlikely without new fundamental reasons.
Resistance levels: 4041, 4059, 4100
Support levels: 4001, 3986
Technically, gold has been rising without pullbacks for 35 days. The growth amounted to more than 22%. Accordingly, the market may form corrections, pullbacks, or consolidations within local timeframes. News may provoke such corrective maneuvers before the main movement. I consider the support levels of 4000 - 3986 - 3961 to be areas of interest. A retest or false breakdown could trigger a rebound and growth.
Best regards, R. Linda!
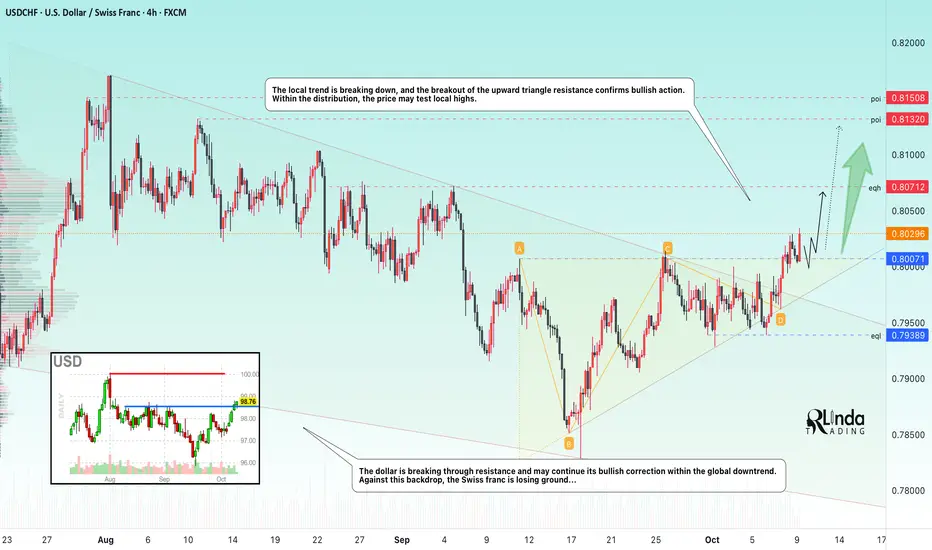
USDCHF → Change in local trend. Confirmation...FX:USDCHF confirms a change in the downtrend and is ready to move into a distribution phase amid growth in the dollar index.
The dollar is breaking through resistance and may continue its bullish correction within the global downtrend. Against this backdrop, the Swiss franc is losing ground...
The currency pair is forming a breakout of the local trend. The breakout of the resistance of the ascending triangle confirms bullish action. As part of the distribution, the price may test local highs.
Resistance levels: 0.8071, 0.8132
Support levels: 0.800
A consolidation of the price above 0.800 may form an intermediate bottom, which will provide support for the bulls before the next run.
Best regards, R. Linda!
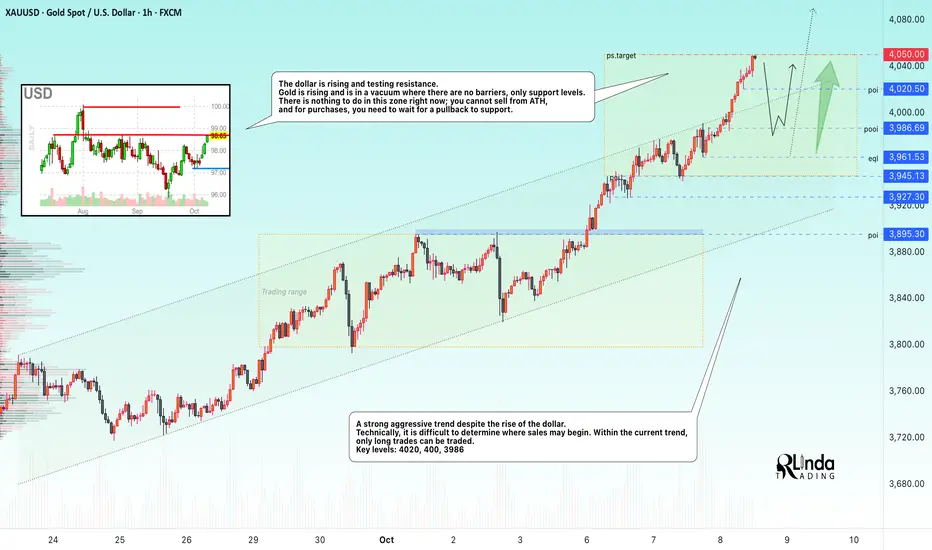
GOLD → Testing 4050 - 4100. Need a pullback to tradeFX:XAUUSD is hitting a new all-time high, testing $4,050, and looks set to reach $4,100. This record growth is linked to falling interest rates and economic risks, which are causing money to flow into hedge assets...
Key drivers: The White House may announce civil service cuts amid the shutdown, which increases uncertainty. The probability of interest rate cuts in October is 95%, supported by the delay in data publication due to the shutdown. Global central banks continue to build up reserves. However, as prices rise, so do the risks of correction. The USD is also receiving support as a safe haven, which may limit further growth in gold.
Resistance levels: 4050, 4075, 4100
Support levels: 4020, 400, 3986
Technically, we need to wait for a slowdown and correction to take a full breath before further movement. I consider the local liquidity zones of 4020 - 4000 - 3986, 3961 to be promising areas of interest. I do not rule out the possibility of sharp shocks in the market, so we need to be prepared...
Best regards, R. Linda!
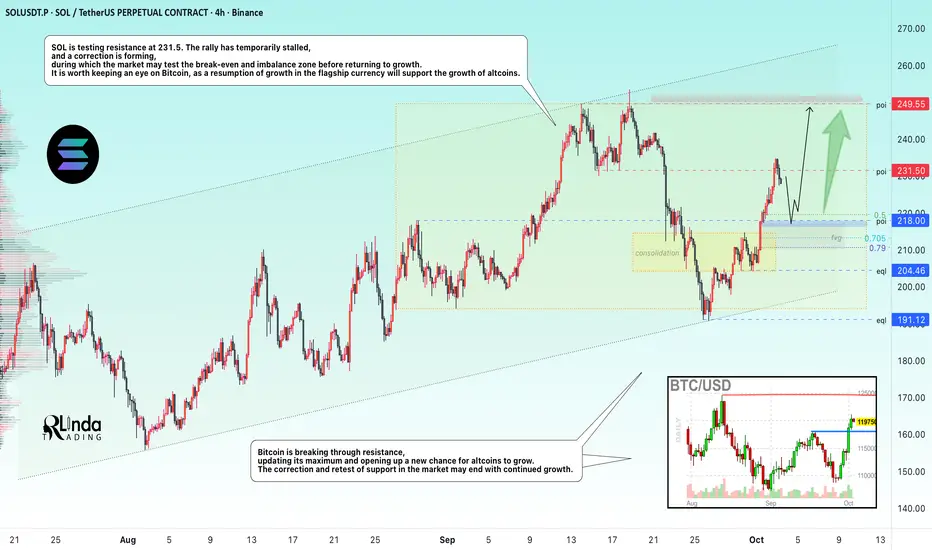
SOLANA → Retracement for consolidation before growth to 250.0BINANCE:SOLUSDT bounces off trend support, forms a reversal pattern, and enters a distribution phase, during which it updates its maximum but encounters strong resistance. What's next?
Bitcoin breaks through resistance, updating its maximum and opening up a new chance for growth for altcoins. Correction and retesting of support in the market may end with continued growth.
SOL is testing resistance at 231.5. The rally has temporarily stalled, and a correction is forming, during which the market may test the break-even and imbalance zone before returning to growth. It is worth keeping an eye on Bitcoin, as a resumption of growth by the flagship will support the growth of altcoins.
Resistance levels: 231.5, 235, 250
Support levels: 218, 205
A false breakout of 231.5 is provoking a pullback. It is necessary to monitor the further halt in price. I expect a retest of 220-218 before the price returns to growth.
Sincerely, R. Linda!
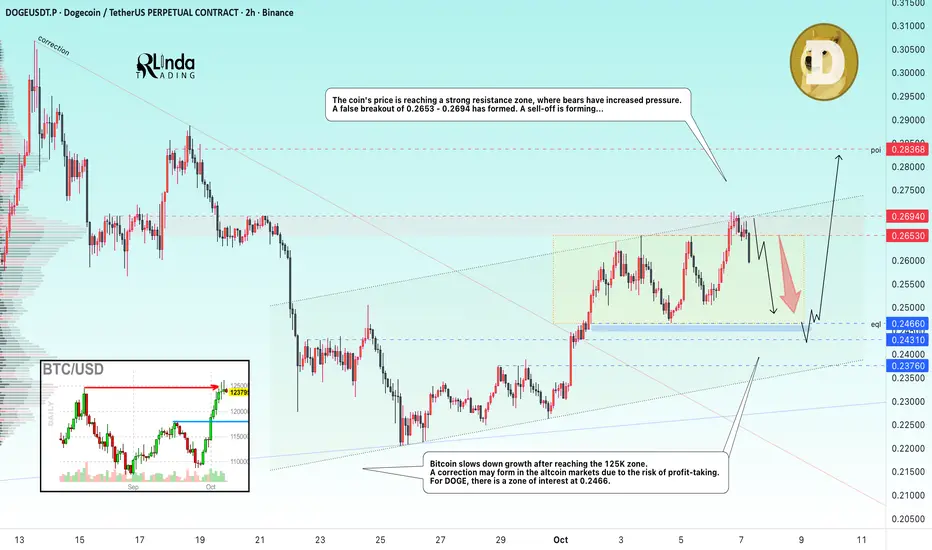
DOGEUSDT → Correction to 0.246. The hunt for liquidity BINANCE:DOGEUSDT.P attempted to realize its potential after breaking out of the downward resistance. After updating the local maximum to 0.27, the price entered a phase of correction and consolidation...
Bitcoin slows down its growth after reaching the 125K zone. A correction may form in the altcoin markets due to the risk of profit-taking. For DOGE, there is a zone of interest at 0.2466
The price of DOGE has reached a strong resistance zone, where bears have increased pressure. A false breakout of 0.2653 - 0.2694 has formed. A sell-off is forming...
Resistance levels: 0.2653, 0.2694
Support levels: 0.2466, 0.2431, 0.2376
Against the backdrop of market correction, a downward rally associated with panic selling is forming. The support zone that is of interest to the market is 0.2466, and this zone is quite capable of stopping the decline. A false breakdown and holding the price above 0.246 - 0.243 may renew interest in growth.
Best regards, R. Linda!
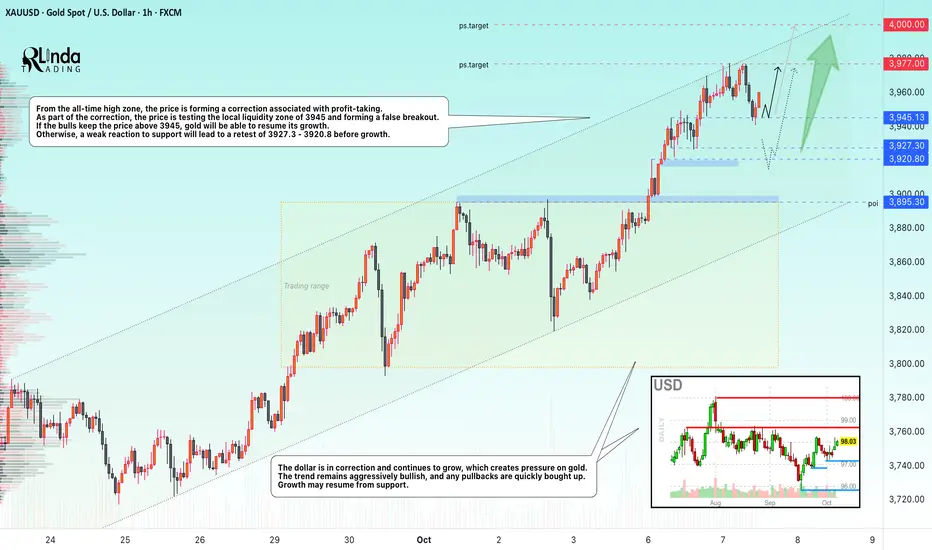
GOLD → The correction will trigger growth to $4,000.FX:XAUUSD hit a new record high of nearly $3,977 and entered a correction phase to build up potential before further growth. Despite the local strengthening of the dollar, the upward trend continues thanks to a combination of macroeconomic and geopolitical factors.
Key supporting factors: Ongoing US government shutdown: The Democrats' fifth unsuccessful attempt to resolve the issue increases uncertainty. Markets expect two interest rate cuts before the end of the year.
China has been increasing its reserves for the 11th consecutive month, and global central banks bought +15 tons in August.
No bearish triggers: Any correction is seen as a buying opportunity.
Gold maintains its upward momentum. Breaking through $4,000 seems a matter of time if current drivers remain in place. Key risks are an unexpected resolution to the shutdown or hawkish signals from the Fed.
Resistance levels: 3977, 4000
Support levels: 3945, 3927, 3920
Technically, a false breakdown of support could lead to continued growth. A retest of 3945 is possible; a weak reaction could trigger a deeper correction, for example to 3927, before further growth.
Sincerely, R. Linda!
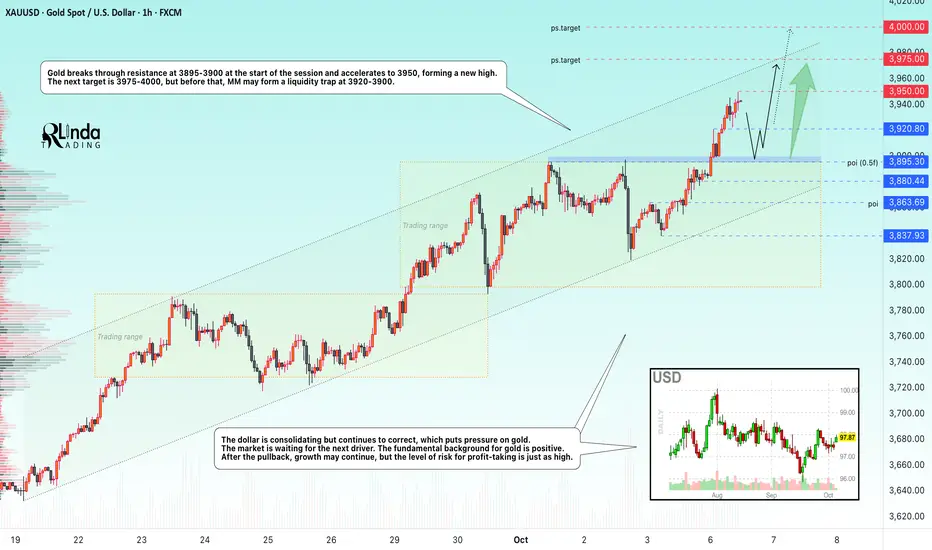
GOLD → Rally to the psychological target of $4,000FX:XAUUSD hit a new all-time high of $3,950 (+1.7% for the day at the time of writing), continuing its move toward the psychological $4,000 mark. The growth continues despite the strengthening of the dollar and the rally in the stock markets.
Key drivers: The ongoing US shutdown (now in its seventh day): The lack of progress in negotiations and the risk of mass layoffs of civil servants are increasing demand for safe havens.
The probability of a rate cut in October is 100%, and in December, 94%. Weak labor market: Trump's statements blaming Democrats for job losses are fueling pessimism.
Fundamentally, gold remains on an upward trend thanks to the perfect combination of US fiscal risks and soft monetary policy. A breakout to $4,000 seems only a matter of time if the shutdown is not resolved.
Resistance levels: 3,950, 3975, 4000
Support levels: 3920, 3900, 3880
Technically, before reaching the 4000 mark, MM may form a liquidation, especially against the backdrop of the FOMC meeting on Wednesday and the Fed on Thursday. Key areas of interest before growth: 3920 and 3900, behind these areas lies a pool of liquidity that will not prevent the accumulation of energy before the next bull run.
Sincerely, R. Linda!
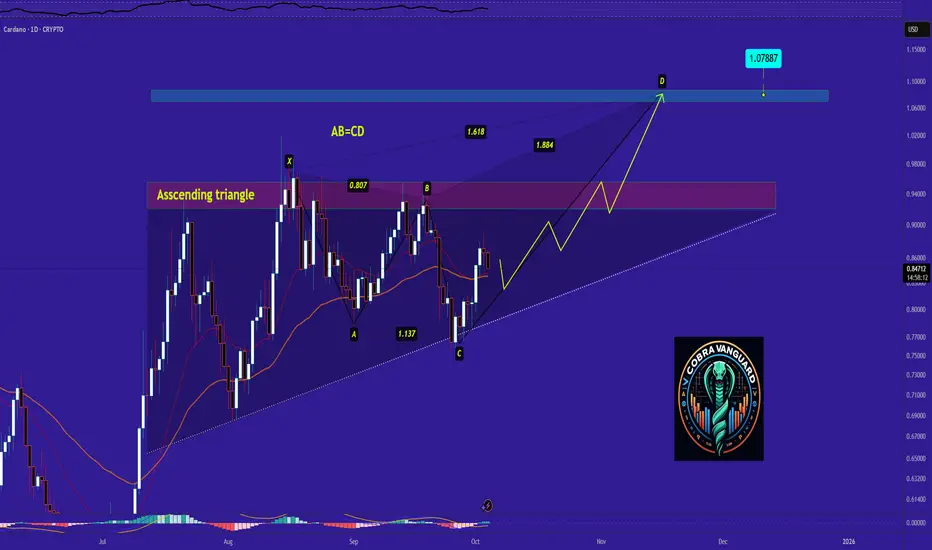
Cardano's situation+ Target PredictionCurrently, ADA is forming an ascending triangle, indicating a potential price increase. It is anticipated that the price could rise, aligning with the projected price movement (AB=CD).
However, it is crucial to wait for the triangle to break before taking any action.
Best regards CobraVanguard.💚
#GOLD, Focus on the retest supportHello trades
I focus on the consolidation rang of 3863.8-3838
Resistance levels: 3863.8-3900
Support levels:3855-3838-3824
Thank you

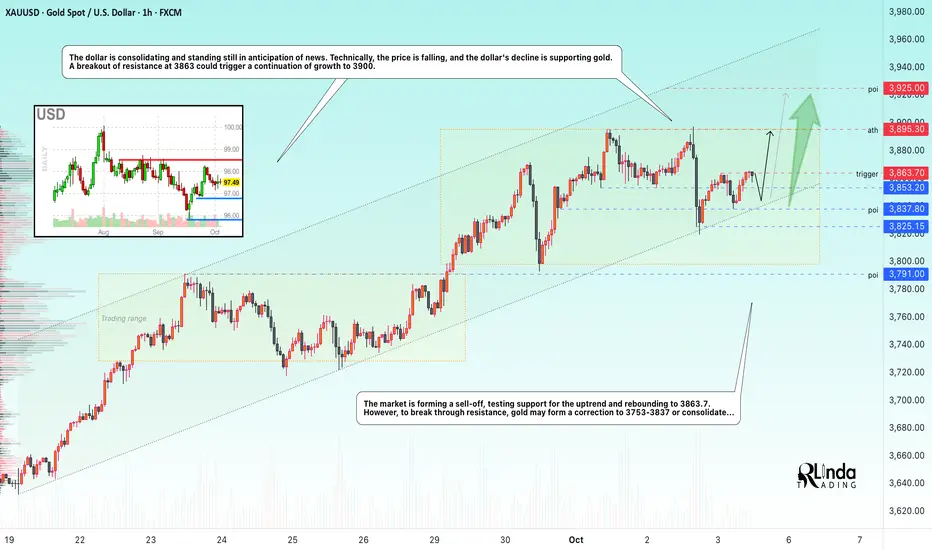
GOLD → Consolidation before continued growth. Trigger 3863FX:XAUUSD is consolidating in the range of 3837.8 - 3863.7, preparing for its seventh consecutive week in positive territory. Despite a correction from a record high of $3897, the metal remains supported by a combination of the Fed's dovish policy and geopolitical risks.
Key supporting factors: Expectations of Fed easing: Dovish sentiment continues to fuel interest in gold. Geopolitical tensions and tougher G7 sanctions against Russia. The ongoing shutdown is delaying the release of US data, increasing uncertainty.
Important: If markets ignore the shutdown, gold may face a correction.
US services data (ISM Services PMI) and Fed speeches: May adjust rate expectations.
Resistance levels: 3863.7, 3900
Support levels: 3853, 3837, 3825
Focus on the current consolidation range of 3863 - 3837. Before attempting a breakout, a retest of support may form within the consolidation. The trend remains bullish, as does the sentiment at the moment.
Best regards, R. Linda!
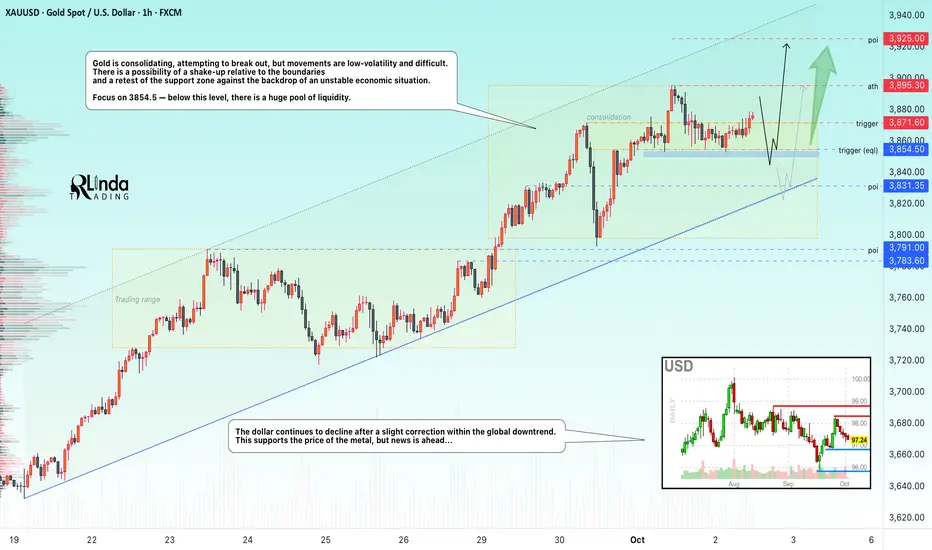
GOLD → Consolidation before growth FX:XAUUSD is correcting from 3895 and forming consolidation with a key support area at 3854, below which lies a huge pool of liquidity. A deep correction is unlikely due to ongoing risks.
The suspension of NFP publication due to the shutdown and inflation creates uncertainty for Fed policy, as does weak employment data...
However, the resumption of government work will allow the publication of data on unemployment claims and factory orders, so increased volatility in the markets is to be expected on Thursday/Friday...
The correction in gold is a temporary pause. As long as US fiscal risks, labor market weakness, and geopolitical tensions remain, the uptrend will remain intact. The $3850 level is the nearest support.
Resistance levels: 3871.6, 3895, 3900
Support levels: 3854.5, 3831.3
The most likely scenario at the moment is a long squeeze in the 3854.5 liquidity zone before continuing to rise beyond 3900...
Best regards, R. Linda!
GBPCAD breakout or rejection? All eyes on 1.8850!GBPCAD is testing a major technical zone as macro and price catalysts align. Here's what traders need to know:
Catalysts & Macro Drivers
GBP : Supported by USD weakness (US shutdown, weak data), sticky UK inflation, and Bank of England caution. November’s UK budget looms as a key event.
CAD : Under pressure from falling oil prices (oversupply/weak demand) and a dovish Bank of Canada. Further rate cuts are possible, especially if oil stays low.
Technical Outlook
Weekly chart : Strong impulsive rally past 61.8% Fibonacci (1.8310), with 1.9490 (78.6% Fib) as the next longer-term upside target.
4h chart : Ascending triangle with resistance at 1.8850. Breakout/close above 1.8850 confirms bullish momentum, with targets at 1.90 and then 1.93–1.95.
RSI : Long-term RSI above 60 signals strength, but divergence is a risk factor. Watch for RSI reset or failure at highs.
Trading Scenarios
Bullish : Hold above 1.8850 for 3 sessions +, look for upside extension to 1.90/1.93/1.95.
Bearish : Failure to break 1.8850 or drop below 1.8600 could trigger reversal to 1.84/1.81 support.
Levels to Watch
Key resistance: 1.8850, 1.9000, 1.9340, 1.9490
Key support: 1.8600, 1.8400, 1.8310
This content is not directed to residents of the EU or UK. Any opinions, news, research, analyses, prices or other information contained on this website is provided as general market commentary and does not constitute investment advice. ThinkMarkets will not accept liability for any loss or damage including, without limitation, to any loss of profit which may arise directly or indirectly from use of or reliance on such information.
