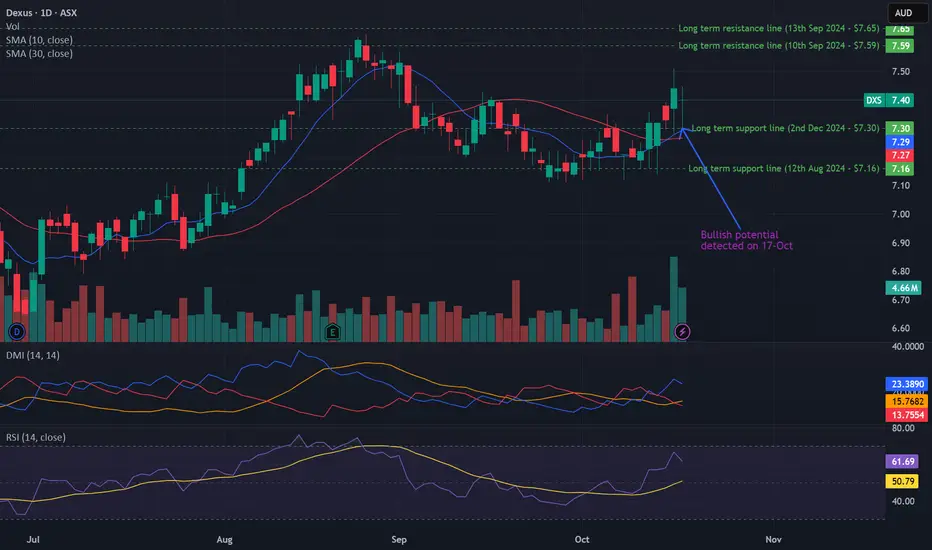
Bullish potential detected for DXSEntry conditions:
(i) higher share price for ASX:DXS along with swing up of indicators such as DMI/RSI.
Stop loss for the trade would be:
(i) below the support level from the open of 2nd December 2024 (i.e.: below $7.30), or
(ii) below the support level from the open of 12th August 2024 (i.e.: below $7.16), or
(ii) below the recent swing lows of 25th September (i.e.: below $7.11), depending on risk tolerance.
ASX
Bullish potential detected for CQEEntry conditions:
(i) trade continuation in the upwards direction for ASX:CQE confirmed with swing up of indicators such as DMI/RSI (i.e.: continuation of bounce off VWAP and 50 day MA).
Stop loss for the trade would be:
(i) below the long term support/resistance line from 12th December 2022 (i.e.: below $3.26).

ASX200 to find buyers at market price?AU200AUD - 24h expiry
The primary trend remains bullish.
The overnight dip has been bought into and there is scope for further bullish pressure going into this morning.
50 1day EMA is at 8904.
Setbacks should be limited to yesterday's low.
Offers ample risk/reward to buy at the market.
We look to Buy at 8904 (stop at 8849)
Our profit targets will be 9069 and 9099
Resistance: 8931 / 8970 / 9000
Support: 8865 / 8829 / 8800
Risk Disclaimer
The trade ideas beyond this page are for informational purposes only and do not constitute investment advice or a solicitation to trade. This information is provided by Signal Centre, a third-party unaffiliated with OANDA, and is intended for general circulation only. OANDA does not guarantee the accuracy of this information and assumes no responsibilities for the information provided by the third party. The information does not take into account the specific investment objectives, financial situation, or particular needs of any particular person. You should take into account your specific investment objectives, financial situation, and particular needs before making a commitment to trade, including seeking, under a separate engagement, as you deem fit.
You accept that you assume all risks in independently viewing the contents and selecting a chosen strategy.
Where the research is distributed in Singapore to a person who is not an Accredited Investor, Expert Investor or an Institutional Investor, Oanda Asia Pacific Pte Ltd (“OAP“) accepts legal responsibility for the contents of the report to such persons only to the extent required by law. Singapore customers should contact OAP at 6579 8289 for matters arising from, or in connection with, the information/research distributed.

AUB AU ( AUB Group Limited) LongAUB Group Limited is a major Australian insurance brokerage and underwriting group, a component of the ASX200 index
Principal activities:
-Insurance Brokerage: AUB Group acts as an intermediary between clients (primarily small and medium-sized businesses) and insurance companies
-Underwriting agencies: The company develops, distributes and manages insurance products on behalf of licensed insurance companies
-International operations: Following the acquisition of the UK company Tysers in 2022, AUB Group significantly strengthened its presence in the UK market, engaged in wholesale and retail brokerage
-Partner network support: AUB Group holds stakes in partner brokerage businesses
Quotes are beating the market. We expect an approach to historical highs, as the company shows:
- strong financial results:
1. In FY25 reached 200.2 million Australian dollars, which is significantly higher than the FY24 figure of 171 million dollars.
2. The declared dividend increased by 15.2% to 91 cents per share
The acquisition of Tysers not only expanded the geographical presence, but also diversified the income. The international segment (mainly UK) now accounts for about 30% of the group's profit.
3. Under the leadership of CEO Michael Emmett, the company has been consistently fulfilling its stated strategic goals. The recent statements by the management about the focus on further optimization and growth in FY26 were also positively received by the market
We also expect a consistent increase in dividends in the coming years
The company's balance sheet is consistently growing, which is also positively received by the market
We are waiting for a local resistance breakout

Bullish potential detected for BGLEntry conditions:
(i) higher share price for ASX:BGL along with swing up of indicators such as DMI/RSI.
Depending on risk tolerance, the stop loss for the trade would be:
(i) below the long-term support level of $0.98 (from the open of 7th January), or
(ii) below the rising 30 day moving average (currently $0.94).

Bearish potential detected for MTSEntry conditions (Darvas box failure play):
(i) lower share price for ASX:MTS along with swing up of ADX/DMI indicator and decline in RSI.
Depending on risk tolerance, the stop loss for the trade would be:
(i) above the long term resistance level of $4.00 from 17th April 2023, or
(ii) above the declining 30 day moving average (currently $4.05), or
(iii) above the high of the recently formed Darvas box of $4.16.

Bearish potential detected for CAREntry conditions:
(i) lower share price for ASX:CAR along with swing of DMI indicator towards bearishness and RSI downwards, and
(ii) observing market reaction around the share price of $36.14 (open of 13th May).
Depending on risk tolerance, the stop loss for the trade would be:
(i) above the potential prior resistance of $38.68 from the open of 6th October, or
(ii) above the potential prior resistance of $39.75 from the open of 5th September, or
(iii) above the previous swing high of $41.55 from 25th August.

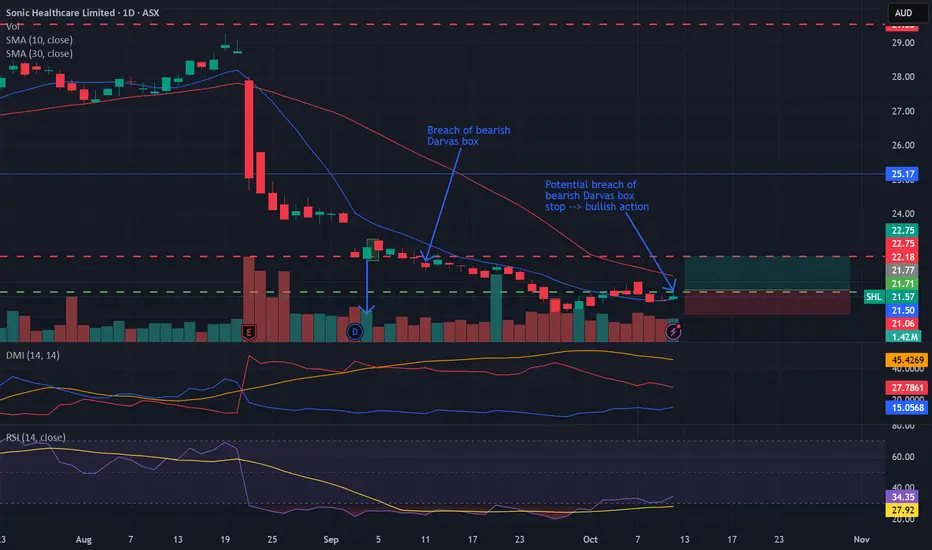
Bullish potential detected for SHLEntry conditions:
(i) higher share price for ASX:SHL along with swing up of indicators such as DMI/RSI.
Depending on risk tolerance, the stop loss for the trade would be:
(i) below the recent swing low of 8th October of $21.42, or
(ii) below the prior swing low of $21.07 from 26th September.
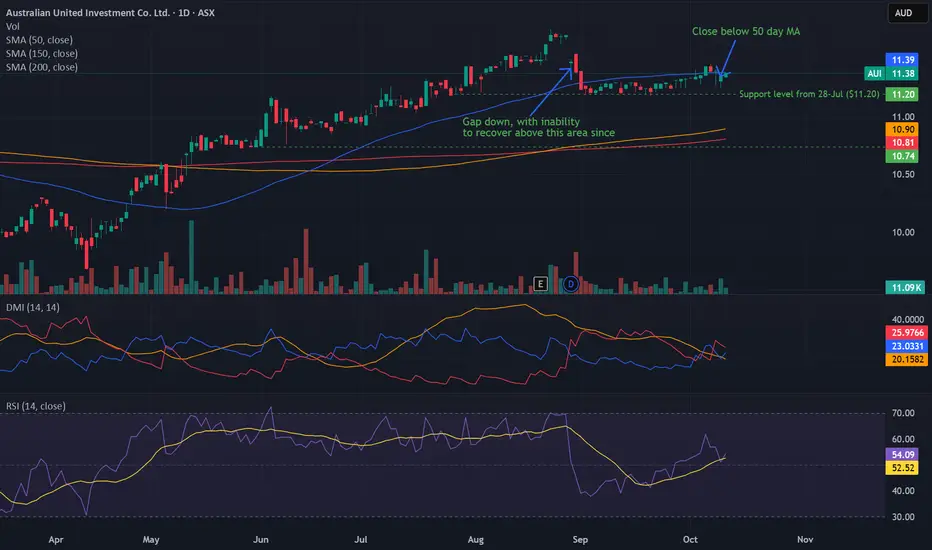
Bearish potential detected for AUIEntry conditions:
(i) lower share price for ASX:AUI along with swing of DMI indicator towards bearishness and RSI downwards, and
(ii) observing market reaction around the share price of $11.20 (open of 28th July).
Depending on risk tolerance, the stop loss for the trade would be:
(i) above the potential prior resistance of $11.55 from the open of 29th August, or
(ii) above the potential prior resistance of $11.72 from the open of 25th August, or
(iii) above the previous swing high of $11.76 from 22nd August.
ASX to continue in the upward move?AU200AUD - 24h expiry
Short term bias has turned positive.
The primary trend remains bullish.
8910 has been pivotal.
20 1day EMA is at 8905.
Dip buying offers good risk/reward.
Risk/Reward would be poor to call a buy from current levels.
We look to Buy at 8913 (stop at 8863)
Our profit targets will be 9063 and 9093
Resistance: 9011 / 9046 / 9075
Support: 9842 / 8910 / 8829
Risk Disclaimer
The trade ideas beyond this page are for informational purposes only and do not constitute investment advice or a solicitation to trade. This information is provided by Signal Centre, a third-party unaffiliated with OANDA, and is intended for general circulation only. OANDA does not guarantee the accuracy of this information and assumes no responsibilities for the information provided by the third party. The information does not take into account the specific investment objectives, financial situation, or particular needs of any particular person. You should take into account your specific investment objectives, financial situation, and particular needs before making a commitment to trade, including seeking, under a separate engagement, as you deem fit.
You accept that you assume all risks in independently viewing the contents and selecting a chosen strategy.
Where the research is distributed in Singapore to a person who is not an Accredited Investor, Expert Investor or an Institutional Investor, Oanda Asia Pacific Pte Ltd (“OAP“) accepts legal responsibility for the contents of the report to such persons only to the extent required by law. Singapore customers should contact OAP at 6579 8289 for matters arising from, or in connection with, the information/research distributed.

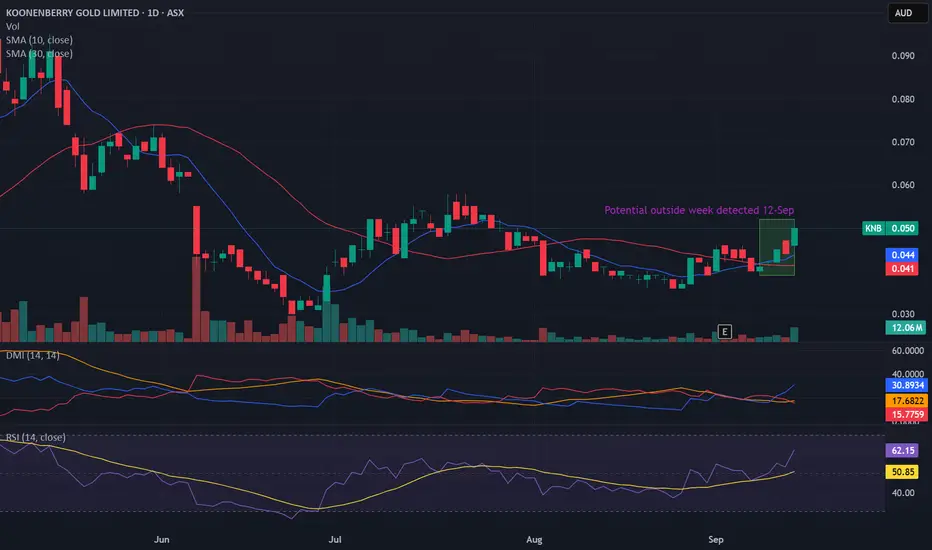
Potential outside week and bullish potential for KNBEntry conditions:
(i) higher share price for ASX:KNB above the level of the potential outside week noted on 12th September (i.e.: above the level of $0.052).
Stop loss for the trade would be:
(i) below the low of the outside week on 8th September (i.e.: below $0.039), should the trade activate.
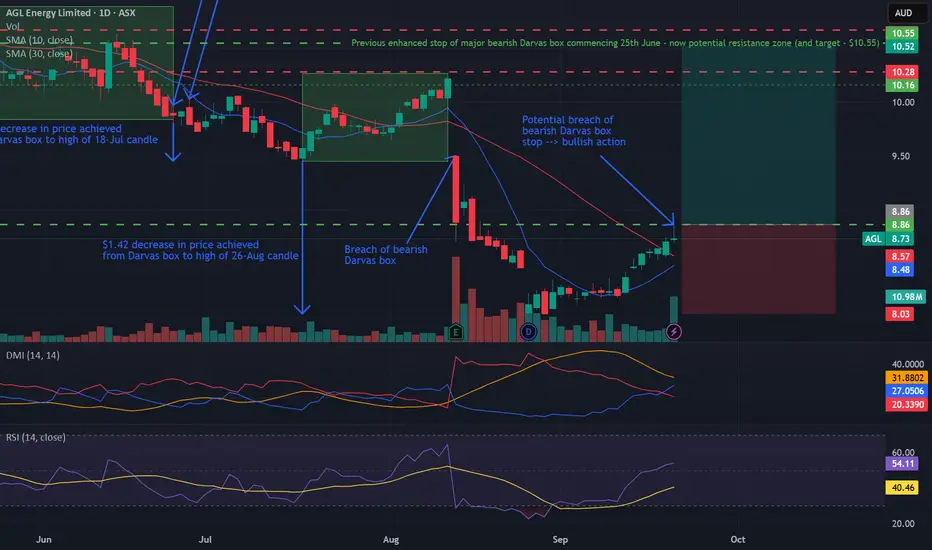
Bullish potential detected for AGLEntry conditions:
(i) higher share price for ASX:AGL along with swing up of indicators such as DMI/RSI.
Depending on risk tolerance, the stop loss for the trade would be:
(i) below the low of the recent gap-up (12th September) of $8.44, or
(ii) below previous potential support of $8.24 from the open of 28th August, or
(iii) below the prior swing low of $8.03 from 26th August.
ASX Weekly Market Wrap: XJO, LYC, CBA, BHP, CSL, ANZ, WDS, EOSIn this week’s market analysis of the Australian market , we break down key price movements and trends across the #ASX, with a close look at the XJO and standout stocks like Lynas Rare Earths (#LYC), Commonwealth Bank (#CBA), BHP Group (#BHP), CSL Limited (#CSL), ANZ Bank (#ANZ), Woodside (#WDS), and EOS (#EOS).
We explore current momentum, trend direction, and price action indicators to help you understand Aussie market developments. Whether you're paper trading or keeping track of market trends, this is your essential guide for the week ahead.
*Apologies for the incorrectly dated chart of 2027! We are not there yet! 😅

Bearish potential detected for AFIEntry conditions:
(i) lower share price for ASX:AFI along with swing of DMI indicator towards bearishness and RSI downwards, and
(ii) observing market reaction around the share price of $7.32 (open of 11th August).
Depending on risk tolerance, the stop loss for the trade would be:
(i) above the potential prior resistance of $7.50 from the open of 28th July, or
(ii) above the potential prior resistance of $7.57 from the open of 21st July, or
(iii) above the previous swing high of $7.68 from 31st July.

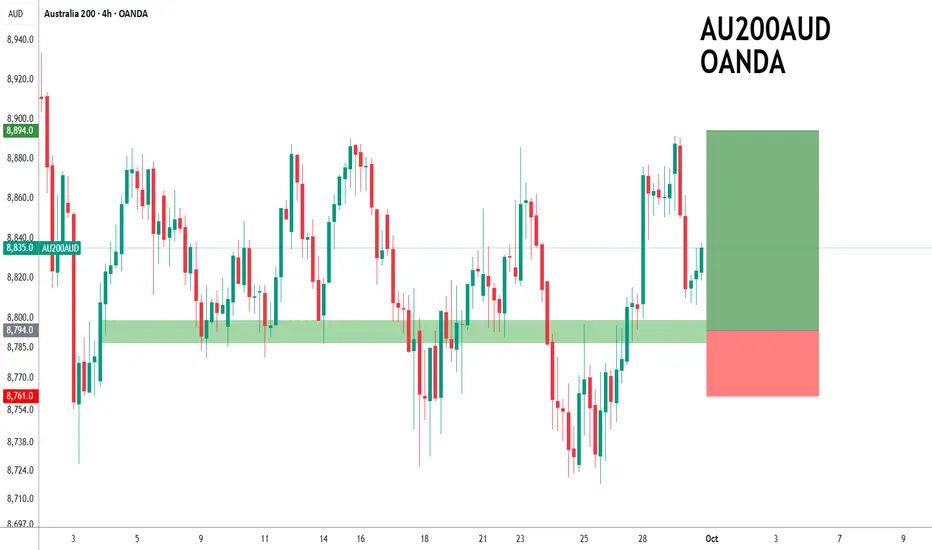
ASX200 to find buyers at previous support?ASX200 - 24h expiry
Daily signals are mildly bullish.
50 1day EMA is at 8792.
Short term bias has turned positive.
Support is located at 8780 and should stem dips to this area.
Risk/Reward would be poor to call a buy from current levels.
We look to Buy at 8794 (stop at 8761)
Our profit targets will be 8894 and 8914
Resistance: 8835 / 8850 / 8890
Support: 8806 / 8780 / 8717
Risk Disclaimer
The trade ideas beyond this page are for informational purposes only and do not constitute investment advice or a solicitation to trade. This information is provided by Signal Centre, a third-party unaffiliated with OANDA, and is intended for general circulation only. OANDA does not guarantee the accuracy of this information and assumes no responsibilities for the information provided by the third party. The information does not take into account the specific investment objectives, financial situation, or particular needs of any particular person. You should take into account your specific investment objectives, financial situation, and particular needs before making a commitment to trade, including seeking, under a separate engagement, as you deem fit.
You accept that you assume all risks in independently viewing the contents and selecting a chosen strategy.
Where the research is distributed in Singapore to a person who is not an Accredited Investor, Expert Investor or an Institutional Investor, Oanda Asia Pacific Pte Ltd (“OAP“) accepts legal responsibility for the contents of the report to such persons only to the extent required by law. Singapore customers should contact OAP at 6579 8289 for matters arising from, or in connection with, the information/research distributed.
Bearish potential detected for BENEntry conditions:
(i) lower share price for ASX:BEN along with swing of DMI indicator towards bearishness and RSI downwards, and
(ii) observing market reaction around the share price of $12.44 (open of 23rd June).
Depending on risk tolerance, the stop loss for the trade would be:
(i) above the potential prior resistance of $12.84 from the open of 11th June, or
(ii) above the potential prior resistance of $12.90 from the open of 11th July, or
(iii) above the declining 10 day moving average (currently $13.02), or
(iv) above the low of the range of day prior to the gap-down (1st September) of $13.10.

Bullish potential detected for PME (gap continuation)Entry conditions:
(i) higher share price for ASX:PME along with swing up of indicators such as DMI/RSI (gap continuation play).
Depending on risk tolerance, the stop loss for the trade would be:
(i) below the previous potential support of $294.88 from the open of 18th September, or
(ii) below the low of the recent swing low of $288.28 of 15th September.

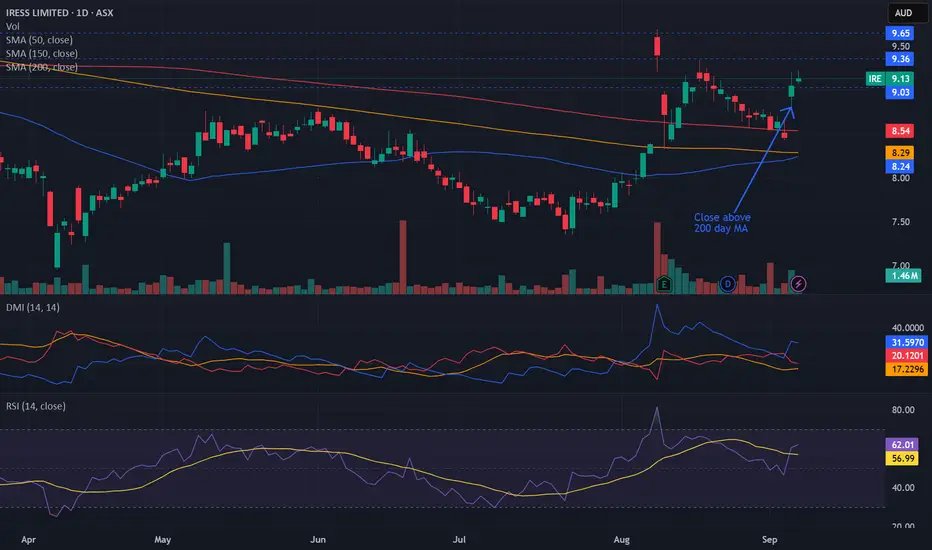
Bullish potential detected for IREEntry conditions:
(i) higher share price for ASX:IRE along with swing up of indicators such as DMI/RSI.
Depending on risk tolerance, the stop loss for the trade would be:
(i) below the low of the recent gap-up (4th September) of $8.80, or
(ii) below previous potential support of $8.63 from the open of 13th May.
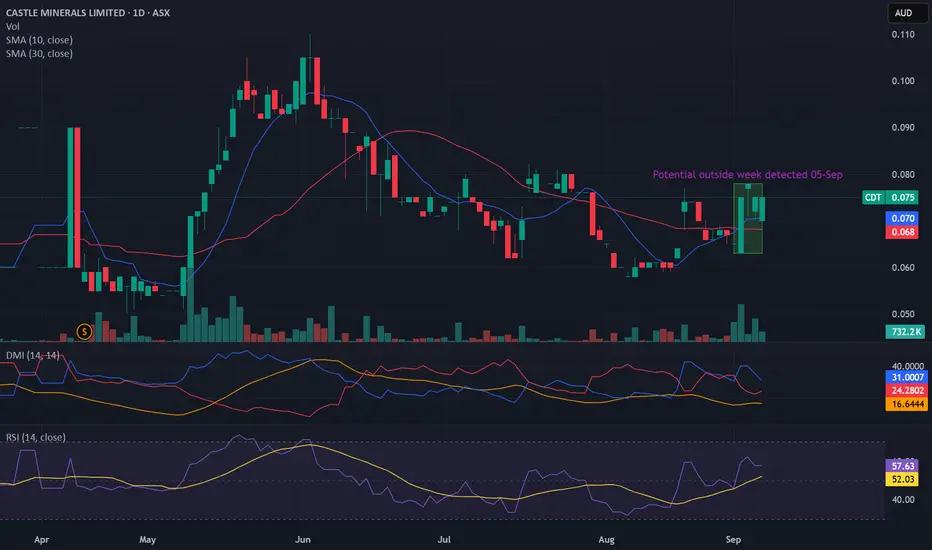
Potential outside week and bullish potential for CDTEntry conditions:
(i) higher share price for ASX:CDT above the level of the potential outside week noted on 5th September (i.e.: above the level of $0.078).
Stop loss for the trade would be:
(i) below the low of the outside week on 2nd September (i.e.: below $0.063), should the trade activate.
AU200 to breakdown?ASX200 - 24h expiry
Although the bulls are in control, the stalling positive momentum indicates a turnaround is possible.
8727 has been pivotal.
We look for losses to be extended today.
Short term momentum is bearish.
A break of the recent low at 8727 should result in a further move lower.
We look to Sell a break of 8719 (stop at 8759)
Our profit targets will be 8601 and 8571
Resistance: 8800 / 8850 / 8890
Support: 8726 / 8700 / 8650
Risk Disclaimer
The trade ideas beyond this page are for informational purposes only and do not constitute investment advice or a solicitation to trade. This information is provided by Signal Centre, a third-party unaffiliated with OANDA, and is intended for general circulation only. OANDA does not guarantee the accuracy of this information and assumes no responsibilities for the information provided by the third party. The information does not take into account the specific investment objectives, financial situation, or particular needs of any particular person. You should take into account your specific investment objectives, financial situation, and particular needs before making a commitment to trade, including seeking, under a separate engagement, as you deem fit.
You accept that you assume all risks in independently viewing the contents and selecting a chosen strategy.
Where the research is distributed in Singapore to a person who is not an Accredited Investor, Expert Investor or an Institutional Investor, Oanda Asia Pacific Pte Ltd (“OAP“) accepts legal responsibility for the contents of the report to such persons only to the extent required by law. Singapore customers should contact OAP at 6579 8289 for matters arising from, or in connection with, the information/research distributed.

$IBX My Bias is long on this stock it put in a 10 month rounded bottom, Deviated the 2024 Yearly low and back above.
Plans:
Plan A (Pullback)
-Price trade's back into the green zone and backtests the 50-day moving average. This is my ideal setup to get long on this.
Plan B
Price ranges inside the local range, sweep the range low then reclaim it will be a trigger to get long also. This ties into Plan A a little.
Plan C
Price ranges inside the local range, then breakout of local range high.. Get long. Stoploss back indside the range..
Good Luck

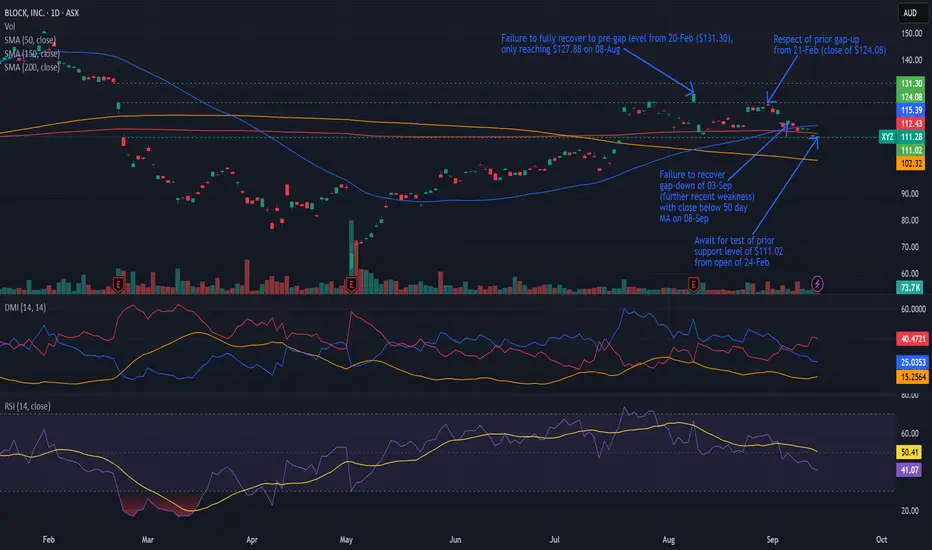
Bearish potential detected for XYZEntry conditions:
(i) lower share price for ASX:XYZ along with swing of DMI indicator towards bearishness and RSI downwards, and
(ii) observing market reaction around the share price of $111.02 (open of 24th February).
Depending on risk tolerance, the stop loss for the trade would be:
(i) above the previous swing high of $117.25 from the open of 4th September, or
(ii) above the potential prior resistance of $118.99 from the open of 19th August, or
(iii) above the previous swing high of $124.00 from 29th August.
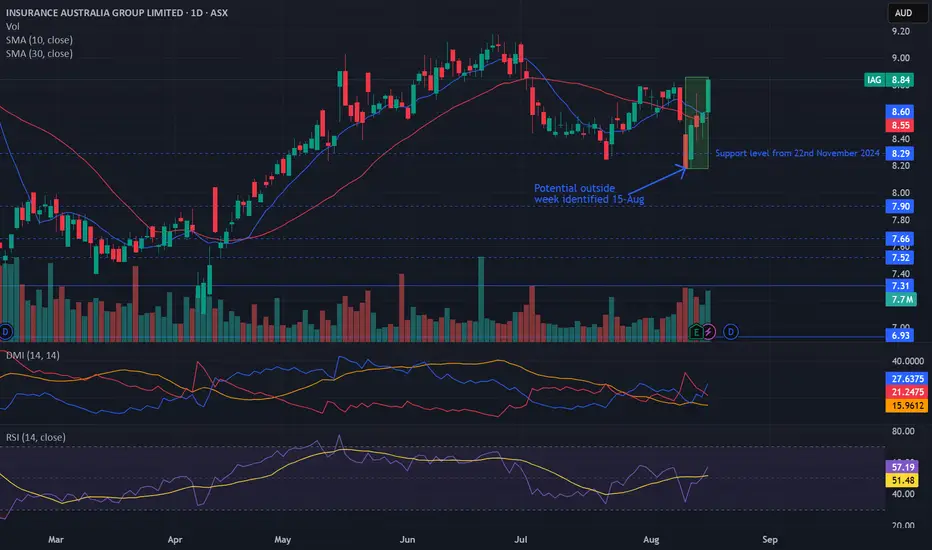
Potential outside week and bullish potential for IAGEntry conditions:
(i) higher share price for ASX:IAG above the level of the potential outside week noted on 15th August (i.e.: above the level of $8.86).
Stop loss for the trade would be:
(i) below the low of the outside week on 11th August (i.e.: below $8.18), should the trade activate.