Gold M15 FVG Hold and Continuation Setup📝 Description
TVC:GOLD is consolidating above a short-term FVG after a strong impulsive leg. Price is holding structure and showing acceptance above intraday support, suggesting continuation rather than distribution.
________________________________________
📈 Signal / Analysis
Primary Bias: Bullish while price holds above the M15 FVG base
Preferred Setup:
• Entry: 4,586
• Stop Loss: Below 4,573
• TP1: 4,601
• TP2: 4,612
• TP3: 4,629 (ATH liquidity)
________________________________________
🎯 ICT & SMC Notes
• Clean impulsive leg with shallow pullback
• FVG acting as valid support
• Upside liquidity remains intact
________________________________________
🧩 Summary
As long as price holds above the intraday FVG, continuation toward higher liquidity and ATH extension remains the favored scenario.
________________________________________
🌍 Fundamental Notes / Sentiment
Despite near-term USD strength, safe-haven demand and macro uncertainty keep gold supported. Any pullbacks are likely corrective, with upside continuation favored as markets remain sensitive to growth risks and policy uncertainty.
________________________________________
⚠️ Risk Disclosure
Trading involves substantial risk and may result in capital loss. This analysis is for educational purposes only and does not constitute financial advice. Always apply proper risk management, predefined stop-loss levels, and disciplined position sizing aligned with your trading plan.
ATH

SPY – ATH into Heavy Macro Week | Trend Still IntactThesis
AMEX:SPY continues to trade in a mature but intact bullish cycle, pushing to new all-time highs despite a heavy macro and event-driven calendar.
Context
- Weekly timeframe
- CPI, PPI, Jobless Claims ahead
- Start of key earnings season
- Supreme Court ruling delayed into next week, adding uncertainty
What I see
- Market printed another ATH and closed the week at the highs
- Price remains well above rising trend support
- No visible distribution or topping structure yet
- Momentum remains strong despite known macro risks
What matters now
- As long as price holds above the rising channel, the trend remains bullish
- Last CPI print came in much cooler than expected
- A second consecutive soft CPI would confirm a disinflation trend and likely fuel further upside
- Market is clearly not pricing near-term stress
Buy / Accumulation zone
- This is not an area for aggressive new buying
- Focus shifts from adding risk to managing and cleaning the portfolio
- Selectively trimming positions that fully rode the last 5–6 years of the cycle
Targets
- Trend-following extension remains open toward higher Fib projections
- No confirmed cycle top yet
Risk / Invalidation
- A sustained loss of the rising channel would signal the need to reduce exposure
- Until then, price action favors holding, not anticipating a top

Potential Top On XAGUSD, Possible Chance At FOMO Remedy!?OANDA:XAGUSD has seen an impressive rally in price all month of December since breaking out of the grip of the Resistance Level @ 54.45 that held it from October until late November, but the rally may be showing signs of exhaustion at new All Time Highs!
Starting this week we see OANDA:XAGUSD put in a new All Time High @ 83.921 and since then has put in a Low @ 74.874, just above the 23.6% Fibonacci Retracement level.
Now, if price fails to continue pushing higher and falls below the current Low at the 23.6% level, this Bullish momentum will have cooled down and we could then see OANDA:XAGUSD put in a deeper Pullback.
The favorable level I see is the 50% Fibonacci Retracement level @ 64.728.
Fundamentally, metals seem to be softening with Trump and Zelensky "closer to a peace deal" with the Ukraine/Russian conflict but with all the global and economic uncertainty, future rate cuts and struggle with the TVC:DXY , we should not count out that this mere decline is anything more then a simple Pullback.
www.tradingview.com

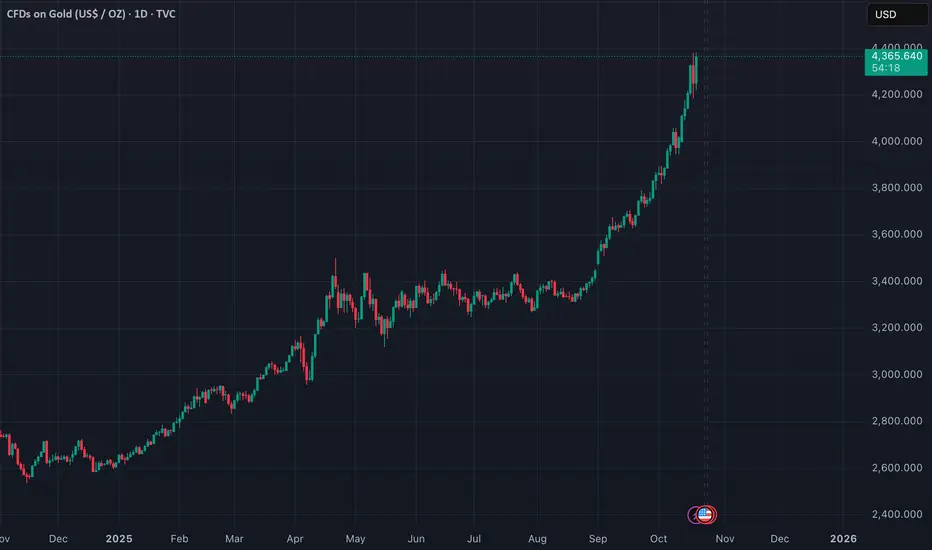
$GOLD Reached ANOTHER Weekly ATH CloseMaybe Peter Schiff was right 🥸
TVC:GOLD has its highest Weekly Close EVER, again.
If history repeats itself, crypto has a world of hurt ahead of it.
Is the Santa Rally cancelled!? 🤬🎅

$GOLD Weekly Close ATHTVC:GOLD has its highest Weekly Close ever with a bullish engulfing candle.
Look at how perfectly it rides the 9WEMA.
Ya'll better pray it doesn't do the same next week or risk gets annihilated.

DAL - Upside Extension Toward ATH Looks PossibleDAL - CURRENT PRICE : 64.20
DAL is showing a strong bullish breakout as price surges above the key horizontal resistance near 64, supported by rising volume and a clean reclaim of both the EMA50 and EMA200. Today’s breakout candle signals renewed momentum, while the ascending trendline beneath reinforces a steady higher-low structure. RSI pushing above 60 reflects strengthening buyers without entering overbought territory. With this decisive breakout, DAL may build momentum toward higher resistance levels and potentially work its way toward challenging its all-time high zone if buyers continue to control the trend. Bias remains bullish above 58–60 support, with further upside favored as long as the breakout holds.
ENTRY PRICE : 64.00 - 64.40
FIRST TARGET : 69.00
SECOND TARGET : 74.00
SUPPORT : 58.00

XAUUSD Set for Surge? Safe-Haven Demand and Fed Cut Bets AlignHey Traders,
In today’s session we are monitoring XAUUSD for a potential buying opportunity around the 4,200 zone. Gold remains in a strong uptrend, and the current correction is bringing price back toward the key 4,200 support–resistance area, which could offer a favorable entry.
Fundamentally, GOLD should continue to benefit from the ongoing weakening of the U.S. Dollar, driven by expectations of a 25bps rate cut. As we head into Wednesday’s FOMC, markets are likely to keep front-running the event, which typically pressures the dollar lower.
Just be cautious—if we see too much front-running, the classic “buy the rumor, sell the fact” reaction could hit once the decision is officially announced.
Additionally, rising geopolitical tensions between Venezuela and the United States are increasing safe-haven demand, which further supports upside for Gold.
Trade safe,
Joe.

Apple Stock Setup: Momentum and Patterns Point Toward New ATHA deep dive into Apple’s latest technical setup, analyzing MACD momentum, RSI strength, and emerging chart patterns that signal a potential breakout toward a new all-time high around $290.

Gold: Healthy Correction Before a Fresh High?Hey Traders, in today's trading session we are monitoring XAUUSD for a buying opportunity around 4,135 zone, Gold is trading in an uptrend and currently is in a correction phase in which it is approaching the trend at 4,135 support and resistance area.
Trade safe, Joe.

#ATH /USDT – at Golden Zone: Massive Rebound or Deep Breakdown#ATH
The price is moving in a descending channel on the 1-hour timeframe and is expected to break out and continue upwards.
We have a trend to stabilize above the 100-period moving average again.
We have a downtrend on the RSI indicator, which supports an upward move if it breaks above it.
We have a key support zone in green that pushed the price higher at 0.02400.
Entry price: 0.02650
First target: 0.02752
Second target: 0.02860
Third target: 0.03018
For risk management, don't forget your stop-loss and money management.
The stop-loss is below the support zone in green.
Upon reaching the first target, take some profit and then change your stop-loss order to an entry order.
For any questions, please comment.
Thank you.

the real question is what happens to $ETH at ATH?eth is currently holding above the quarter channel with resistance above between 3500-ATH
there is a potential moonshot to 7k and beyond (13k?), if the markets are indeed in the infant stage of a bull run.
for now eth is heading towards the golden pocket of the move down with support from ath avwap
as htf bullish market structure never broke this could mean that the highs are ran, rsi has bounced the mid point and could be cruising towards the cook zone again, its here i will watch to see a divergence form when the 3M OB and yearly level is approached.
upside 3500, 4500/ATH, 7000, 130000
downside 1900, 1200, 800
its quite possible that we put in a long term range drifting between 5k and 1k before we see expansion upwards
nfa, just food for thought on the htf but most of the volume is supporting price.

ATH/USDT – at Golden Zone: Massive Rebound or Deep Breakdown?ATH has once again returned to the golden demand zone between 0.0275–0.025, a historically critical area that has triggered multiple price reversals in the past.
This is not just another support level — it’s the last stronghold of buyers on the daily timeframe.
Each time price revisited this region, we saw strong reactions, suggesting institutional accumulation and heavy buying pressure. However, this time the bearish momentum remains dominant, and sellers are still in control on the higher structure.
Interestingly, there’s a long lower wick indicating a liquidity sweep — meaning stop losses were taken below the zone before price quickly recovered. This often signals the beginning of a potential reversal phase.
---
Technical Structure & Key Observations
Overall trend: Still bearish (series of lower highs and lower lows).
Critical zone: 0.0275–0.025 (highlighted yellow box) — major demand area.
Candle structure: Multiple long lower wicks suggesting demand absorption.
Current formation: Sideways consolidation between 0.025–0.031 — breakout on either side will define the next major move.
Key levels to watch:
Immediate resistance: 0.031 – 0.033
Mid resistance: 0.0355 – 0.041
Strong resistance: 0.051 – 0.0645
Next support: 0.0223
---
Bullish Scenario – “Rebound From the Abyss”
A bullish setup will form if price successfully holds above 0.0275–0.025 and prints a strong bullish engulfing candle on the daily close.
That would confirm renewed buyer strength within the major demand area.
🎯 Upside targets:
Target 1: 0.031 (minor breakout confirmation)
Target 2: 0.0355
Target 3: 0.041 — potential trend reversal zone
📉 Invalidation: Daily close below 0.025.
👉 Note: If volume rises along with a solid green candle above 0.031, expect a swift move toward 0.041.
---
Bearish Scenario – “Breakdown Into the Abyss”
If buyers fail to defend the golden zone, a confirmed daily close below 0.025 with strong volume would signal a continuation of the downtrend.
This could trigger another wave of distribution and deeper correction.
🎯 Downside targets:
Target 1: 0.0223 (major local low)
Target 2: Below 0.020 — potential capitulation zone
📈 Invalidation: Strong rebound and daily close back above 0.031.
---
Technical Conclusion
ATH is standing at a make-or-break level that will define its next trend direction.
If the golden demand zone holds, we could see a powerful technical rebound and possible short squeeze.
But if this level gives way, expect a deeper move toward the 0.022 range.
This is the “do or die” moment for ATH bulls.
---
#ATH #ATHUSDT #CryptoAnalysis #TechnicalAnalysis #PriceAction #SupportZone #BreakoutOrBreakdown #CryptoTrading #SmartMoney #LiquiditySweep #SwingTrading

Gold Eyes 4,010 Support Ahead of CPI – Big Move Loading?Hey Traders,
In tomorrow’s trading session, we’re monitoring XAUUSD for a potential buying opportunity around the 4,010 zone. Gold remains in a broader uptrend and is currently in a correction phase, approaching a key support and resistance confluence around 4,010 that aligns with the ascending trendline.
Market Focus:
All eyes are on tomorrow’s U.S. CPI release, with expectations for headline inflation at 3.0% and core at 3.1%. A softer-than-expected print could weigh on the U.S. Dollar, potentially igniting fresh momentum for GOLD to resume its bullish trend.
Next Move:
Watching price action around 4,010 closely — if CPI data confirms disinflation, we could see a strong rebound toward recent highs as safe-haven demand strengthens.
💬 What’s your take on the CPI? Are you positioning long or waiting for confirmation? Drop your thoughts below!
Trade safe,
Joe

Gold ready for retest ath 4380Gold (XAU/USD) showing bullish reaction from the support trendline. The circled candle indicates buyer strength, suggesting a possible recovery toward 4279–4380 resistance levels.
Support Trend Line:
Shows long-term bullish structure — price respecting the ascending trendline.
Support Zone (4181 – 4253):
Key demand area where buyers are stepping in to defend the trend.
4279 Level:
Immediate resistance; a breakout above could confirm short-term bullish momentum.
4313 Level:
Next resistance target after 4279; possible area for partial profit-taking.
4380 Level (ATH Retest):
Major resistance zone — potential final target if bullish move continues.
Indicates buyer reaction at the trendline, signaling possible reversal toward 4279.

Regarding "catching the top" at all time highsWhen market conditions are as they are right now it is really tempting to try and predict the top. But please don't and here is why.
If you'd look at the gold chart right now you'd see that it has been running up all year long with a slight consolidation in the summer. At any moment this year it could have been "the top", but it wasn't. What I am pointing at is that the R:R of predicting the top when you are at the all time highs is unfavourable to say the least. Even if you would've been able to predict a throwback it would've been minor when comparing with the whole of the swing.
Now technical analysis is great and all but at all times in history there were some assets that were absolutely sentiment driven and you can squiggle what ever lines you want on that pretty colourful chart. It will not help you but give you false expectations of cracking the matrix. Market sentiment is like rabies - nobody knows whats going on and then sudden death. Now we have precious metals booming, it was A.I. before that, and EV's before that, and tech before that and so on and on and on. So when you're doing TA on a sentiment driven asset that is currently at all time highs it is only natural that the only thing you will look for is the top and in such matter you will become liquidity.
When what ever you are looking at is in price discovery mode you literally have no price history to look at. So tell me? What is you point of reference? People who work with fundamentals here have a greater edge because they don't even need to look at the chart to understand that we are in a territory that is volatile and pricing in a premium, but when you don't see the sticks forming you don't think about tops, you play the waiting game. Of course at some point in time the price will drop, but it will not be because of a fibonacci projection or a double top, or any other kind of TA pattern, at least not in this sentiment driven asset like gold. It will be because of two things - smart money exiting their positions and a change in sentiment. And for both of these to happen you need news and macro events to stir up the pot and to have someone or something to blame for the dips that are yet to come.
All in all, regarding "catching the top" - don't. It is gambling unless you have many and many years of experience trading in the markets at all time highs and probably the people that do have the so much needed experience will agree with me.
Trade smart, don't be liquidity.
GOLD Will Break ATH Again? Buy!
Hello,Traders!
GOLD Price is maintaining a strong bullish structure, consolidating just beneath its all-time high. Liquidity build-up above the highs suggests potential for an impulsive breakout, extending toward new record levels as buyers remain in full control. Time Frame 5H.
Buy!
Comment and subscribe to help us grow!
Check out other forecasts below too!
Disclosure: I am part of Trade Nation's Influencer program and receive a monthly fee for using their TradingView charts in my analysis.

Next Stop: 8K? Ethereum’s Big Breakout LoadingEthereum has been building a clean bullish structure for years and right now it’s standing right at the edge of a major breakout.
If ETH manages to hold above the 4K zone, the 6K–8K targets are just the beginning.
Above that, we enter the FOMO Zone, and a move toward 13K is totally on the table.
As long as price stays above 2.75K, the bullish structure remains solid.

Gold Near 4,280 as US–China Tensions Fuel Flight to Safety!Hey Traders,
In today’s session, we’re monitoring XAUUSD for a buying opportunity around the 4,280 zone. Gold remains in a strong uptrend, with price currently correcting toward a key structural support area where buyers may look to re-enter.
From a fundamental standpoint, rising US–China geopolitical tensions have pushed investors toward safe-haven assets. Market sentiment is tilting defensive, and Gold — already hovering near all-time highs — continues to reflect that global risk aversion.
A sustained bid above 4,280 could reinforce bullish momentum and potentially open the path toward new highs if uncertainty persists.
Key level: 4,280 (support / trend confluence)
Bias: Bullish while above this level
Trade safe,
Joe.

BTCUSD: Rally between Trend Line can ContinueHello everyone, here is my breakdown of the current Bitcoin setup.
Market Analysis
From a broader perspective, the market for Bitcoin has been through a very complex and volatile consolidation. After multiple failed moves and tests of both the 108800 Support and the 118000 resistance, the price has finally shown a clear directional bias with a powerful breakout to the upside.
This breakout has established a new, clear uptrend which is being guided by an ascending trend line. Currently, after a strong impulsive rally, the price is in a healthy corrective phase, pulling back towards this main trend line for a potential retest, which is a key area to watch.
My Scenario & Strategy
I'm looking for the price to complete its correction down to this ascending trend line. The key signal for me would be a confirmed and strong bounce from this dynamic support, indicating that the pullback is over and buyers are ready to resume the rally.
Therefore, the strategy is to watch for this bounce. A successful defense of the trend line would validate the long scenario. My new target for the next impulsive wave higher is 127300, which would be a new ATH.
That's the setup I'm tracking. Thank you for your attention, and always manage your risk.

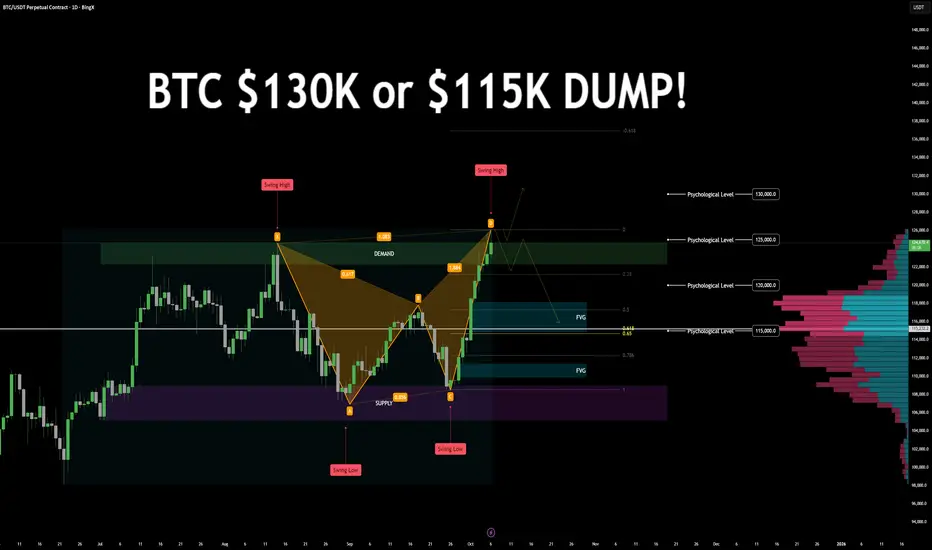
$BTC Daily chart $130K! or $115k DUMPBTC/USDT – Bearish Harmonic Formation | Key Levels & Scenarios
Technical Overview:
Price is currently forming a bearish harmonic pattern, approaching a key decision zone. The next few daily candles will determine whether BTC continues its bullish trend or initiates a corrective phase.
Key Zones
Demand: 122.2K – 124.7K
Supply: 105.1K – 108.9K
Psychological Levels: 130K · 125K · 120K · 115K
Golden Pocket: Around 115K (0.618–0.65 retracement)
Fair Value Gaps (FVGs):
115K–118K
110K (secondary FVG)
Swing Points:
Previous Swing Low: 108K
Previous Swing High: 126K
High Volume Nodes: 118K and 115K
Market Structure
BTC is respecting a consistent bullish leg with limited pullbacks. Price recently swept the 125K psychological level, aligning with harmonic completion and demand resistance.
Scenario Outlook
🔼 Bullish Continuation:
A daily close above the 124.7K demand zone could invalidate the bearish harmonic and signal continuation toward 130K+ targets.
🔽 Bearish Reversal:
A close below the previous day’s candle low may confirm the start of a bearish correction, targeting 118K → 115K, and potentially 110K.
Bearish Confluences
Bearish Harmonic Pattern completion near key resistance.
Golden Pocket + FVG + Psychological + Volume confluence at 115K.
Extended bullish leg with no significant retracement, followed by 125K liquidity sweep.
LET me know your thoughts below!
BTCUSD Long: Small Correction and Pump to new ATHHello, traders! The prior market structure for BTCUSD saw a powerful breakout from an ascending channel, which propelled the price to a new all-time high of 125600. Following this peak, the market has entered a new consolidation phase, forming a high-level range between the new ATH and the key support area around the 120400 level.
Currently, the price is in a corrective phase within this new range. After an initial drop from the highs and a minor bounce, the auction is heading back towards the major support zone located around the 120400 level for what I believe will be a decisive test of buyer strength.
My scenario for the development of events is a successful re-accumulation within this range. I believe the price will complete its correction down to the 120400 support zone. In my opinion, a confirmed bounce from this area will signal the end of the pullback and trigger the next impulsive wave higher, breaking the top of the range. The take-profit is therefore set at 125700, targeting a new ATH. Manage your risk!

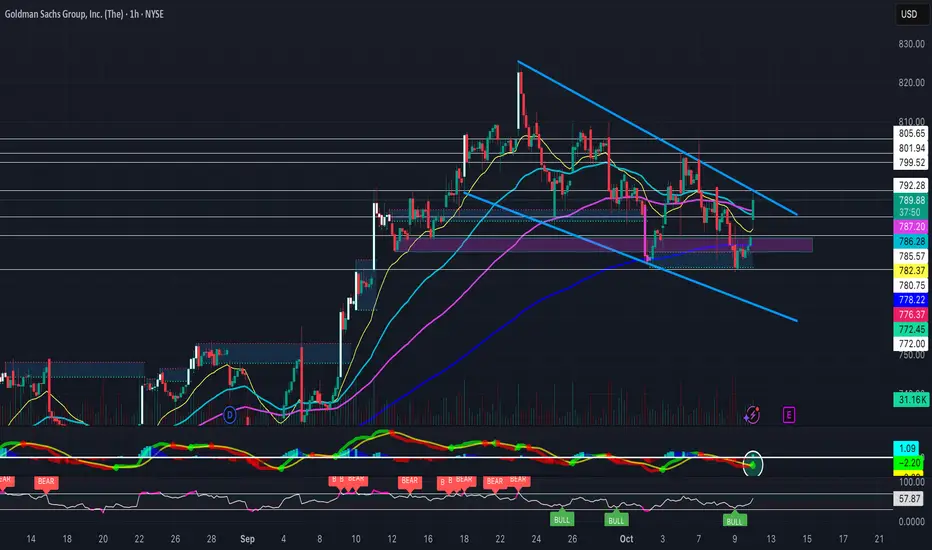
Falling Wedge Heading into EarningsAfter previously breaking out of a falling wedge to hit new ATH's, NYSE:GS is holding yet another falling wedge heading into earnings next week. (Previous Chart Below)
Its EMA's are curling upwards, some bullish hidden divergence on the RSI, a MACD golden cross, and a bullish FVG formed as support- Will definitely be watching this one.
$BTCUSDT Analysis - Oct 10 | 4H Time FrameBINANCE:BTCUSD Analysis - 4H
Hello and welcome to another analysis from the Satoshi Frame team!
I’m Abolfazl, and today we’re going to analyze Bitcoin on the 4-hour timeframe.
Bitcoin’s current all time high stands at $126,199!
Price has tapped into a demand zone, which could potentially trigger a bullish move toward this high.
This zone is worth the risk, and it’s recommended to look for buy positions on the 15-minute timeframe, targeting $130,000.
See you in the next analyses!
Stay tuned with the Satoshi Frame team...
