Does it have any energy left?BTL sending out mixed signals on the daily chart. Looks like a bullish channel but its starting to look like a possible death cross within the next 2 weeks. Expecting a bounce back to the 50ema, then it could be time to flip the coin and enter the market. Time will tell, but not financial advise, so its not.
Australia

Aussie Bull Run: Why AUD Futures Are the 2026 Trade to WatchThe March 2026 Australian dollar (A6H26) futures have emerged as a premier opportunity for currency traders. As of late December 2025, prices have surged to new contract highs, supported by a perfect storm of technical and fundamental catalysts. For the modern trader, the "Aussie" is no longer just a proxy for copper; it is a sophisticated bet on global technology and fiscal shifts.
Technical Mastery and MACD Momentum
The daily bar chart for A6H26 reveals a textbook bullish trend. Prices recently breached key resistance, establishing a solid floor for further appreciation. Technical analysts point to the Moving Average Convergence Divergence (MACD) , which remains in a strong posture. The MACD line sits comfortably above the signal line, with both trending higher.
The path of least resistance is clearly upward. A sustained move above the. 6729 contract high activates a buy signal for many institutional desks. Traders are now eyeing a primary price objective of 6950 . To manage risk, professional stops are typically placed just below support 6625 , ensuring a disciplined approach to this high-conviction setup.
Macroeconomics: The Fed’s Dovish Pivot
A primary driver for the Australian dollar's strength is the diverging path of global central banks. The U.S. Federal Reserve has transitioned toward a more accommodative stance to support labor markets. Lower U.S. interest rates naturally weigh on the Greenback, making high-yielding currencies like the AUD more attractive to international carry traders.
Conversely, the Reserve Bank of Australia (RBA) maintains a hawkish bias. Persistent domestic inflation and a resilient job market have forced Australian policymakers to keep rates elevated. This widening interest rate differential acts as a powerful magnet for global capital, fueling the "long Aussie" trade into 2026.
Geostrategy: Powering the AI Revolution
Australia’s geostrategy has shifted from traditional mining to securing the "Green and Digital" transition. The nation is a critical supplier of lithium, copper, and rare earths , the literal building blocks of AI data centers and renewable energy. As global demand for computing power explodes, Australia’s trade balance benefits from a structural "AI premium."
Furthermore, the Australian government is aggressively implementing blockchain-based supply chain tech . These innovations reduce friction at the border and enhance the security of resource exports. By leading in "High-Tech Mining," Australia ensures its currency remains a vital asset in the global technological race.
Professional Note: Success in AUD futures requires monitoring both the RBA’s tone and China’s industrial demand. While the technicals suggest a move to .6950, stay alert for any sudden shifts in global risk appetite that could spark short-term volatility.

READY TECH HOLDINGS LTDREADY TECH HOLDINGS LTD made double with divergence along MACD cross over and RSI UPTICK. We can go long with first target of $2.77 and Final target of $3.5 in short tern view.
We can seen minor support level at $2.9.
PLease make your own analysis before taking any trade. ASX:RDY

ASX200 to see extended gains?ASX200 - 24H expiry
Price action looks to be forming a bottom.
A break of the recent high at 8722 should result in a further move higher.
We look for gains to be extended today. Our outlook is bullish.
The primary trend remains bullish.
We look to Buy a break of 8723 (stop at 8649)
Our profit targets will be 8883 and 8913
Resistance: 8722 / 8750 / 8800
Support: 8655 / 8610 / 8543
Risk Disclaimer
The trade ideas beyond this page are for informational purposes only and do not constitute investment advice or a solicitation to trade. This information is provided by Signal Centre, a third-party unaffiliated with OANDA, and is intended for general circulation only. OANDA does not guarantee the accuracy of this information and assumes no responsibilities for the information provided by the third party. The information does not take into account the specific investment objectives, financial situation, or particular needs of any particular person. You should take into account your specific investment objectives, financial situation, and particular needs before making a commitment to trade, including seeking, under a separate engagement, as you deem fit.
You accept that you assume all risks in independently viewing the contents and selecting a chosen strategy.
Where the research is distributed in Singapore to a person who is not an Accredited Investor, Expert Investor or an Institutional Investor, Oanda Asia Pacific Pte Ltd (“OAP“) accepts legal responsibility for the contents of the report to such persons only to the extent required by law. Singapore customers should contact OAP at 6579 8289 for matters arising from, or in connection with, the information/research distributed.

Bearish divergence, bigger number not always better for housingFull disclosure I got Ai to compose this because I'm dyslexic and a scatter brain.
and this is a duplicate because I tried to delete it once I found out it scaled bad on mobile, and trading views delete function MIA! ( within the cool down ) go figure.
I definitely have a bias to btc and maybe a long position on the JPY. Have a read have a look.
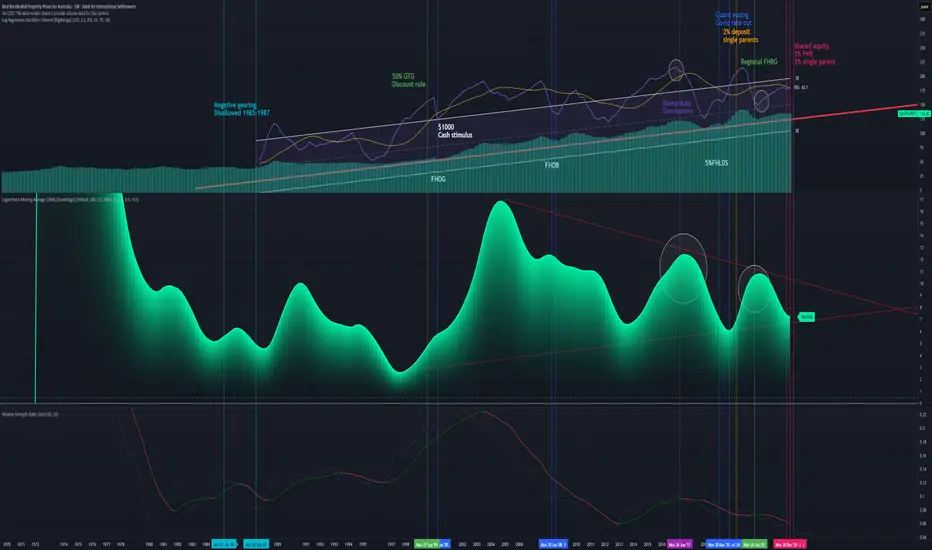
I have loosely marked some economic data on here showing Policy might not be working well enough because wages didn't keep up with CPI causing a real value losses after 2022.
I have supplied the ratio chart for gold as a indicator at the top.
Structural Policy Drivers (The Cause of the Bull Trend)
These points explain why the long-term trend line (the logarithmic regression) slopes upward:
1. The Foundation of Investment (1999): The introduction of the 50% Capital Gains Tax (CGT) Discount in September 1999 was the single most powerful structural stimulus. It transformed property investment (combined with Negative Gearing) into the primary wealth-creation strategy, ensuring sustained investor demand.
2. GFC Policy Proof (2008-2009): The market's low point during the GFC was immediately arrested by the First Home Owners Boost (FHOB) and broad cash payments (October 2008). This showed that the government would deploy massive, rapid stimulus to prevent a structural price fall, reinforcing investor confidence.
3. The Liquidity Flood (March 2020): The RBA's emergency COVID Rate Cuts and Quantitative Easing (QE) injected unprecedented liquidity, creating the conditions for the most recent Nominal Higher High.
II. The Bearish Divergence Signal (The Warning)
These points explain why the recent peak is weak and unsustainable:
4. Technical Exhaustion: The Bearish Divergence observed between the Nominal HPI Price (making a \text{Higher High} in 2022) and the RSI/Momentum (making a \text{Lower High}) signals that the momentum required to sustain the uptrend is exhausted.
5. The Illusion of Value: The Nominal Higher High is highly misleading. When adjusted:
Purchasing Value: The Price-to-Income Ratio reached a \text{record high} (\sim 8.0 times income), meaning the price peak was actually a Lower Low in affordability.
Real Value: When measured in Ounces of Gold, the HPI peaked at a massive Lower Low (\sim 206 ounces in 2024 vs. \sim 874 ounces in 2004), demonstrating the fragility of AUD-denominated property wealth.
III. The Policy Constraint (The System Strain)
These points explain the high risk and fragility of the current market:
6. Diminishing Returns: The market required the extreme, combined stimulus of near-zero rates (RBA) and low-deposit guarantees (5% FHB schemes}) to reach its 2022 peak. The Bearish Divergence confirms this level of effort produced a historically weak momentum result, indicating policy inefficiency.
7. The Investor Exit Trigger: The current high interest rates and the {Lower Low in Purchasing Value} are highly likely to encourage a rotation of capital. A sell-off of just 5\% of investment equity (\approx \$104 Billion) could overwhelm {FHB} demand and force a Nominal Price Correction a {Lower Low}) by late 2026 / mid-2027.
8. The "Double Whammy" Risk: Recent low-deposit buyers face extreme risk: their equity is thin (vulnerable to price drops) while their debt servicing remains stretched, as large wage increases are structurally unlikely (due to the RBA's mandate to curb inflation).
🛑 INVESTMENT PROPERTY HEDGE: The Exit Strategy
This strategy is for owners of non-owner-occupied property facing the convergence of the {AU} Housing {Bearish Divergence} and the Global {JPY} Unwind.
✅ Core Hedges: Replacing Inefficient Investment Equity
The goal is to move capital from a low-momentum, illiquid, highly-taxed, AUD-denominated asset (investment property) into a high-liquidity, real-value store.
1. Physical Gold & Silver (The Devaluation Defense):
WHY: Gold is the essential hedge against the currency risk. Our analysis shows that your property's value has collapsed when measured in Gold {Lower Low} on the {House Price-to-Gold Ratio}). Converting illiquid property equity into physical metals protects wealth from the {AUD} devaluation caused by both domestic policy strain and global policy shocks.
Investment Action: This should be prioritized for preserving the real wealth that may be lost if Nominal {QAUR628BIS} corrects.
2. Defensive Japanese Yen {JPY}) Exposure:
WHY: This is the most direct hedge against the global liquidity shock. The {JPY} is the "funding currency" for the global risk trade. When the carry trade unwinds, investors must buy {JPY} to repay their debt, causing a sharp appreciation. This {JPY} strength would directly offset losses incurred by the domestic housing slowdown.
Investment Action: Provides protection against the {2026-2027} global market crash that the {JPY} unwind is predicted to trigger.
3. Bitcoin (The Non-Sovereign Liquidity Drain):
WHY: Bitcoin provides the fastest, most tax-efficient (long-term {CGT} relief applies) exit route for capital leaving a strained domestic financial system. It is the perfect liquid asset to absorb the {\$104B} of equity that a 5\% investor sell-off would create.
Investment Action: A strategic allocation here hedges against both {AUD} devaluation and the systemic policy risks you've identified.
❌ Liabilities to AVOID: The System's Vulnerabilities
1. Australian Bank Stocks {CBA, Westpac, etc.}):
WHY NOT: Their fate is tied to your property's mortgage risk. The {Bearish Divergence} on the (QAUR628BIS) directly increases their credit risk. The {JPY} unwind will also hurt them by disrupting global financial stability and reducing lending capacity. They are a concentrated liability.
2. Leveraged US Stock Indices {S\&P 500/Nasdaq}):
WHY NOT: The {US} market is a primary target of the {JPY} carry trade unwind. Leveraged investors will be forced to sell these high-performing assets to close their debt positions, leading to a non-fundamental, sharp correction. The risk of sudden {JPY}-driven liquidation is too high.
Thanks for reading I made this for my Father who recently had to ( forced hand) purchase another home (above what he lived for "reasons") convinced cash and the property are safe and cannot afford to lose more money.
Leave a comment for him.
Or add to the conversation share your own views.
Bearish divergence, policy failing to create a real higher highFull disclosure I got Ai to compose this because I'm dyslexic and a scatter brain.
I definitely have a bias to btc and maybe a long position on the JPY. Have a read have a look.
I have loosely marked some economic data on here showing Policy might not be working well enough because wages didn't keep up with CPI causing a real value losses after 2022.
I have supplied the ratio chart for gold as a indicator at the top.
Structural Policy Drivers (The Cause of the Bull Trend)
These points explain why the long-term trend line (the logarithmic regression) slopes upward:
1. The Foundation of Investment (1999): The introduction of the 50% Capital Gains Tax (CGT) Discount in September 1999 was the single most powerful structural stimulus. It transformed property investment (combined with Negative Gearing) into the primary wealth-creation strategy, ensuring sustained investor demand.
2. GFC Policy Proof (2008-2009): The market's low point during the GFC was immediately arrested by the First Home Owners Boost (FHOB) and broad cash payments (October 2008). This showed that the government would deploy massive, rapid stimulus to prevent a structural price fall, reinforcing investor confidence.
3. The Liquidity Flood (March 2020): The RBA's emergency COVID Rate Cuts and Quantitative Easing (QE) injected unprecedented liquidity, creating the conditions for the most recent Nominal Higher High.
II. The Bearish Divergence Signal (The Warning)
These points explain why the recent peak is weak and unsustainable:
4. Technical Exhaustion: The Bearish Divergence observed between the Nominal HPI Price (making a \text{Higher High} in 2022) and the RSI/Momentum (making a \text{Lower High}) signals that the momentum required to sustain the uptrend is exhausted.
5. The Illusion of Value: The Nominal Higher High is highly misleading. When adjusted:
Purchasing Value: The Price-to-Income Ratio reached a \text{record high} (\sim 8.0 times income), meaning the price peak was actually a Lower Low in affordability.
Real Value: When measured in Ounces of Gold, the HPI peaked at a massive Lower Low (\sim 206 ounces in 2024 vs. \sim 874 ounces in 2004), demonstrating the fragility of AUD-denominated property wealth.
III. The Policy Constraint (The System Strain)
These points explain the high risk and fragility of the current market:
6. Diminishing Returns: The market required the extreme, combined stimulus of near-zero rates (RBA) and low-deposit guarantees (5% FHB schemes}) to reach its 2022 peak. The Bearish Divergence confirms this level of effort produced a historically weak momentum result, indicating policy inefficiency.
7. The Investor Exit Trigger: The current high interest rates and the {Lower Low in Purchasing Value} are highly likely to encourage a rotation of capital. A sell-off of just 5\% of investment equity (\approx \$104 Billion) could overwhelm {FHB} demand and force a Nominal Price Correction a {Lower Low}) by late 2026 / mid-2027.
8. The "Double Whammy" Risk: Recent low-deposit buyers face extreme risk: their equity is thin (vulnerable to price drops) while their debt servicing remains stretched, as large wage increases are structurally unlikely (due to the RBA's mandate to curb inflation).
🛑 INVESTMENT PROPERTY HEDGE: The Exit Strategy
This strategy is for owners of non-owner-occupied property facing the convergence of the {AU} Housing {Bearish Divergence} and the Global {JPY} Unwind.
✅ Core Hedges: Replacing Inefficient Investment Equity
The goal is to move capital from a low-momentum, illiquid, highly-taxed, AUD-denominated asset (investment property) into a high-liquidity, real-value store.
1. Physical Gold & Silver (The Devaluation Defense):
WHY: Gold is the essential hedge against the currency risk. Our analysis shows that your property's value has collapsed when measured in Gold {Lower Low} on the {House Price-to-Gold Ratio}). Converting illiquid property equity into physical metals protects wealth from the {AUD} devaluation caused by both domestic policy strain and global policy shocks.
Investment Action: This should be prioritized for preserving the real wealth that may be lost if Nominal \text{HPI} corrects.
2. Defensive Japanese Yen {JPY}) Exposure:
WHY: This is the most direct hedge against the global liquidity shock. The {JPY} is the "funding currency" for the global risk trade. When the carry trade unwinds, investors must buy {JPY} to repay their debt, causing a sharp appreciation. This {JPY} strength would directly offset losses incurred by the domestic housing slowdown.
Investment Action: Provides protection against the {2026-2027} global market crash that the {JPY} unwind is predicted to trigger.
3. Bitcoin (The Non-Sovereign Liquidity Drain):
WHY: Bitcoin provides the fastest, most tax-efficient (long-term {CGT} relief applies) exit route for capital leaving a strained domestic financial system. It is the perfect liquid asset to absorb the {\$104B} of equity that a 5\% investor sell-off would create.
Investment Action: A strategic allocation here hedges against both \text{AUD} devaluation and the systemic policy risks you've identified.
❌ Liabilities to AVOID: The System's Vulnerabilities
1. Australian Bank Stocks {CBA, Westpac, etc.}):
WHY NOT: Their fate is tied to your property's mortgage risk. The {Bearish Divergence} on the (QAUR628BIS) directly increases their credit risk. The {JPY} unwind will also hurt them by disrupting global financial stability and reducing lending capacity. They are a concentrated liability.
2. Leveraged US Stock Indices {S\&P 500/Nasdaq}):
WHY NOT: The {US} market is a primary target of the {JPY} carry trade unwind. Leveraged investors will be forced to sell these high-performing assets to close their debt positions, leading to a non-fundamental, sharp correction. The risk of sudden {JPY}-driven liquidation is too high.
Thanks for reading I made this for my Father who recently had to ( forced hand) purchase another home (above what he lived for "reasons") convinced cash and the property are safe and cannot afford to lose more money.
Leave a comment for him.
Or add to the conversation share your own views.

4 Biggest trading opportunities this week This week presents several key events traders should keep a close eye on:
Korean inflation – Monday 6pm
The last reading for SK CPI came in at +2.4% year‑on‑year in October 2025, above the 2.1% expected by economists. Another surprise uptick might reinforce expectations of a rate pause (or even a re‑tightening), which could boost KRW.
Euro inflation – Tuesday 5am
Inflation data out of the eurozone will shape expectations for the European Central Bank (ECB). If inflation remains sticky or rises, it could bolster ECB hawkishness, strengthening EUR and European bond yields.
Australian GDP Growth – Tuesday 7.30am
Australia’s GDP report will offer a snapshot of the local economic picture. A strong GDP print could support the Australian dollar and lift demand for commodity‑linked assets, given Australia’s status as a major commodity exporter.
US PCE – Friday 10am
The upcoming release of the Personal Consumption Expenditures Price Index (PCE) matters because the Fed views it as its preferred inflation gauge. A hotter‑than‑expected PCE could reaffirm caution on rate cuts and lift USD, bond yields, and potentially weigh on risk assets.

No U.S. data? No problem The U.S. government shutdown is now entering its second month, delaying crucial trading data. With limited insights coming from Washington, investors might like to pay attention to the data coming from elsewhere to make their trading decisions.
This week, central banks in Mexico, Brazil, England, Sweden, Norway, and Australia are set to announce monetary policy decisions.
Perhaps the most important of the bunch is the Bank of England decision. They are expected to keep their key rate unchanged, but speculation about an upcoming rate cut is growing. The Reserve Bank of Australia follows closely in importance and is also expected to hold rates steady at 3.6%, despite persistent inflation pressures. So, we might see a couple rate cut surprises here.
Additionally, Mexico and Switzerland will release their latest inflation data.
Earnings season continues as well, with reports due from Palantir, Berkshire, AMD, Uber, and McDonald’s.

AUD/USD Longer term OutlookHey Guys,
This is a follow up the the Short Term outlook I posted to show you the bigger picture of what happening. If you haven't checked out that short term thesis I suggest you do to understand why i think in the near term why there will be a decline possibly down to .50.
As I'm sure most people are aware there is abit of fear on the longer term of the debasement of the USD, as we have massive debts and deficits which are highly unlikely to get any better soon. This is ultimately lead to its decline relative to other assets think current rise in GOLD. If we have a recession from slower growth from tariffs, regional banks and private credit going bad and the consumer becoming too squeezed then this budget with get much worse as they will try and stimulate the economy to ease some of these pressure. But as a consequence this will lead to inflation and more debasement just like the 60s - 80s period. Each time they try and rein in inflation growth will slow so they will simulate resulting in the cycle continuing.
Now if the "debasement" continues this doesn't mean the USD will die get replace but it does mean other assets and currencies that aren't having this systemic problem will rise relative to the dollar again just like the 1960s-1980s. Australia has had long running fiscal conservative budgets and most definitely no debasing its currency. Our debt to Nominal GDP peak during covid and unlike most other economies has decreased since. Although we are projected to runn a deficit of A$10 billion our growth will more then out weigh this and this is such a small fraction to out A$1.752 trillion economy is a non factor really.
looking at some technicals on the charts we can see we have been in a falling wedge since the last "debasement" of the USD happened after the GFC. This will breakout sometime over the next two years as its running out of room. we have gaining strength on the RSI creating a divergence on the monthly also point to a breakout to the upside. we have clear outlined targets to hit on the way up and looking back again at previous debasement events by 2011 we were at $1.10 and by the 1975 we were at $1.49 so a return to these levels isn't without precedence.
I have shown with the green line the general direction of where i think it will be please dont take that as an exact model. This will take years to fully play out but if you understand even the most basic supply and demand , technical analyst and fundamental problem America is facing then it should keep you true.
Please check out the shorter outlook to gain a full picture and do you own research
here are some links to data used
www.ceicdata.com
data.worldbank.org

SDR – Textbook Respect of PD Arrays Leading to Explosive UpsideExplanation
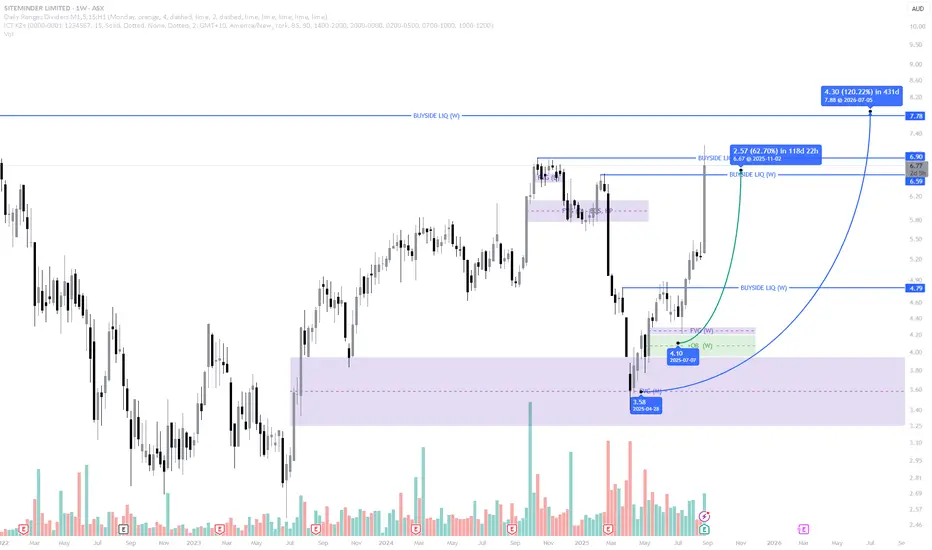
The move we anticipated on SDR has now unfolded exactly as outlined, with price reacting strongly from the higher-timeframe PD arrays.
Fair Value Gap (FVG): Price tapped perfectly into the monthly/weekly FVG and used it as a springboard for accumulation. This zone served as the rebalancing point for inefficient pricing.
Order Block (OB): The bullish OB inside the FVG held as expected, providing the structural base for buyers to step in and defend.
Liquidity Dynamics: Prior to the move, sell-side liquidity was swept, clearing weak longs and fuelling the drive higher. Once liquidity was taken, momentum shifted sharply to the upside.
Buyside Targets: Price has now begun its run into the weekly buyside liquidity levels at 6.90 and beyond, with the higher target around 7.78 still in play.
This reaction is a textbook ICT move: sweep → rebalance via FVG → respect of OB → expansion toward buyside.
✅ Key Takeaway: The predictive model played out exactly, proving once again that respecting PD arrays across HTFs provides a high-probability roadmap for price action.
RBA Cut by 25bp: Where From Here?The Reserve Bank of Australia (RBA) finally delivered the 25bp cut I anticipated in July. I take a quick look at how they have updated the economic forecasts that matter, and how Aussie markets reacted.
Matt Simpson, Market Analyst at City Index and Forex.com

FFM -- ASX – Breakout Consolidation in Focus
📝 Description
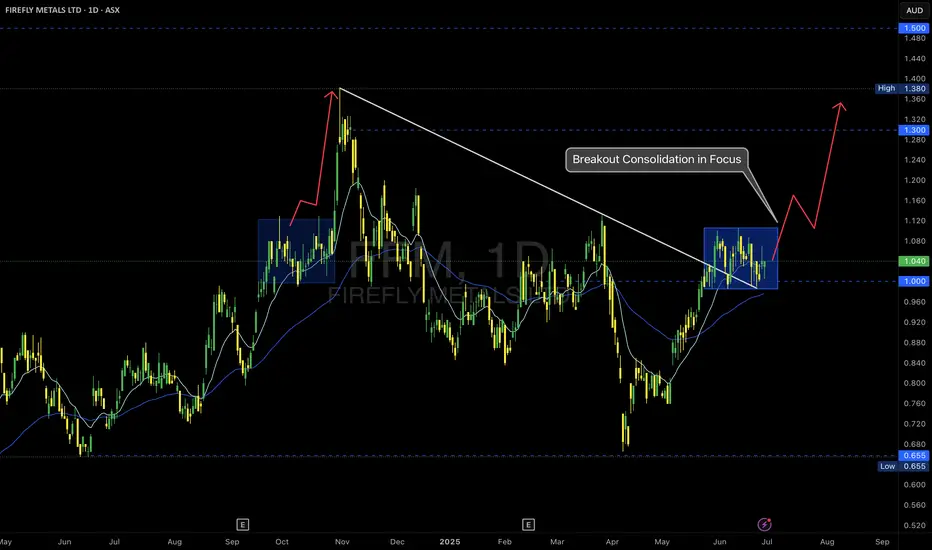
Firefly Metals is setting up a classic breakout continuation scenario after reclaiming the $1.00 psychological level and breaking the long-term trendline resistance.
🔹 Key Observations:
• Trendline Break: The descending trendline from the prior high was decisively breached, signaling a structural shift.
• Accumulation Zone: Price has consolidated in a tight range above $1.00, forming a bullish flag or box accumulation.
• EMA Cluster Support: Both the 15 and 60 EMAs are aligned below the consolidation, providing dynamic support.
🔹 Potential Scenarios:
✅ Bullish Continuation:
A clean breakout above the top of the blue box could trigger a momentum rally toward $1.30 and ultimately the $1.38–$1.50 resistance levels.
✅ Deeper Pullback:
If price loses the $1.00 support decisively, a retracement to retest the breakout base is possible.
Trade Plan:
I am monitoring for a confirmed breakout candle with volume expansion to validate the continuation thesis.
• Entry trigger above the range high ($1.10 area)
• Stops below recent swing low / $1.00 level
• First target: $1.30 resistance
As always, risk management first—no breakout, no trade.
#MJTrading
#FFM #FireflyMetals #ASXTrading #BreakoutSetup #TechnicalAnalysis #PriceAction #TradingPlan #ChartOfTheDay #AustralianStocks #MomentumTrading #MJTrading
Trading the July RBA decision The Reserve Bank of Australia (RBA) will deliver its latest policy decision on Tuesday, 9 July. Markets are heavily positioned for a 25-basis point cut, which would bring the official cash rate down to 3.60%.
Major Australian banks including CBA, Westpac, NAB and ANZ are aligned in expecting a cut this month, with some anticipating further easing in August and November. A confirmed cut paired with dovish guidance could place further downside pressure on the Australian dollar, particularly against the US dollar and Japanese yen.
AUD/USD remains capped below the 0.6580–0.6600 region, with repeated rejections suggesting strong overhead resistance. A break above this zone would be needed to shift momentum higher. Conversely, a confirmed break below 0.6520 could open a move toward the 0.6450 area. Meanwhile, AUD/JPY has rebounded firmly off its May lows and is now testing resistance near 95.30. This area has repeatedly capped upside since mid-June, making it a key level to watch into the RBA decision.

AUD/USD: The Rebound TradeThe Australian dollar (also known as the Aussie Battler) looks set to continue its recent bounce. Inflation is now under control and monetary easing will continue to support aggregate demand across the economy. While rate cuts are dovish, the underlying economy is still strong and, as we will explain below, the fiscal situation is shaping up better than expected. Stability is in.
The real action, though, is in the US. Unemployment is creeping up. Jobless claims are ticking higher. Existing home sales are falling. The US consumer is feeling the pinch. That puts pressure on the Fed. Rate cuts are back in the conversation. Markets are already pricing in the first move later this year. The US dollar is losing its grip.
AUD/USD recently tested its 200 day moving average and held firm. That’s more than just a technical level. It’s a psychological line in the sand. The Aussie held its ground.
There’s more. Australia’s fiscal position is likely to come in stronger than expected. Mining exports are holding up. Volumes are rising. That supports the budget bottom line and underpins the Aussie’s credibility as a resource backed currency. This is in stark contrast to most of the developed world, where peers are running large deficits.
This isn’t just about central banks. The global economy is shifting gears. China is stabilising. Industrial demand is returning. Commodity prices are finding a floor. That’s key for the Aussie. It’s still a commodity linked currency. As iron ore and copper pick up, the AUD should follow.
There’s a window here. Over the next twelve months, the AUD has room to move higher, testing the 0.7000 range. Not because Australia is booming, but also because the US is slowing. The Fed is running out of steam. That flips the dynamic. We’re moving from USD strength to USD softness.
The setup is clear. A soft landing in the US. A stable China. Commodities firming. And an RBA on hold. That’s a cocktail for AUD strength.
The bounce has just begun.
The forecasts provided herein are intended for informational purposes only and should not be construed as guarantees of future performance. This is an example only to enhance a consumer's understanding of the strategy being described above and is not to be taken as Blueberry Markets providing personal advice.

AUD/USD $AUDUSD update M1 D1 H4 - NO shorts in 2025Monthly SFP + Weakness of the main currency
Forget about short positions for the next year
This might be the best entry point for long of the year
H4
Without closing the imbalance, they shouldn't go up, so I expect such a scenario
Based on all the data, I expect a local strengthening of the dollar in May and only growth after that
Best regards, EXCAVO
_____________________
Disclosure: I am part of Trade Nation's Influencer program and receive a monthly fee for using their TradingView charts in my analysis.

Why the RBA should cut rates todayThe Reserve Bank of Australia should cut rates today, argues James Glynn in the Wall Street Journal .
Markets, however, expect the central bank to wait until May for its next move. RBA Governor Michele Bullock remains cautious, citing lingering inflation.
But Glynn contends that global uncertainty now outweighs the RBA’s desire to wait for marginal improvements in inflation data. That uncertainty is set to escalate this Wednesday, with the Trump administration announcing sweeping tariffs on U.S. trading partners—likely triggering retaliatory measures.
Andrew Boak, chief economist at Goldman Sachs Australia, appears to support Glynn’s view: “There are costs to waiting until May to cut. Waiting is not always a virtue.”
Is Glynn simply chasing a contrarian headline or is there actually a possibility the RBA could act today?

The RBA just cut by 25bp: Instant ViewThe RBA have just cut their cash rate for the first time since late 2020. Using their monetary policy statement and updated forecast, I provide my instant high-level view of what this could mean fir future policy - with an update to my AUD/USD outlook thrown in for good measure.
Matt Simpson, Market Analyst at City Index and Forex.com

ASX 200: Why I don't trust today's 'record high'The ASX 200 reached a record high in today's session, but it's not a convincing record high in my books. If anything, it could signal yet another false break. Using the ASX cash and futures market alongside Wall Street indices, I delve into why we need to be on guard for another bull trap before the real move potentially begins.
Matt Simpson, Market Analyst at City Index and Forex.com

AUDUSD - 4H Why we need to Buy?!The FX:AUDUSD has shown strong bullish momentum after hunting liquidity below the 2022 low on the daily and weekly timeframes.
✅ Breakout & Retest: The pair successfully broke the descending channel's resistance and is now pulling back to the breakout zone, confirming its strength.
✅ Higher High Formation: A higher high structure supports the bullish bias, indicating potential continuation towards previous highs and beyond.
📌 I expect another bullish push from this key support zone.
🔔 Follow for real-time updates!

EURAUDFor EURAUD I expect buys to the ray line above that will fill the wick seen on the daily. There is also a probability that price might come for a third touch on the trendline below before the buys happen.

AUDCAD SHORTPrice as it is on AUDCAD is expected to form a continuation pattern and continue its sell. However it is important to note that price might still go upwards for a third touch contact or an arc formation to sell.

ASX dragged lower by the DowThe Dow Jones futures market fell for an 8th consecutive day on Monday, a bearish sequence not seen in over 12 years. And that's not good news for ASX 200 bulls, as the index tends to track the Dow very closely.
The daily chart looks like it wants to head to 8200, and it just 1 - 2 bearish trading days away from it looking at a typical day's range. The 1-hour trend has favoured bearish swing traders, who could seek to fade into moves towards the 20-50 hour EMAs.

The RBA just made a small (but big) change to their statementThe RBA held rates at 4.35% as expected, but there were several changes to their December statement which warrant a closer look. I highlight the key differences to the November statement and provide my interpretation of what it means for the RBA's policy as we head into next year, then look at AUD/USD.
MS
