BTCUSD: Institutional Structure vs. Intraday WeaknessThe Technical Conflict As we head into today's volatility, Bitcoin is showing a distinct divergence compared to the broader market. While indices and metals are pushing highs, BTC is displaying a conflict between its high-timeframe zones and immediate price action.
1. The 4H Trend: Intraday Weakness On the 4H chart, the structure is currently labeled BEARISH.
Lower Highs: The price has lost the bullish momentum seen earlier in the month and is struggling to reclaim key levels.
Momentum: Selling pressure remains dominant in the short term, with price action holding below the key moving averages.
The Signal: Until the chart prints a new structural "Higher High" or a reversal signal, the path of least resistance on this timeframe remains heavy.
2. The Weekly Context (The "Trap"?) Despite the short-term weakness, the asset is sitting in a known high-timeframe support zone (88k-89k).
The Conflict: We have a Bearish 4H trend colliding directly with Weekly historical support.
This often creates choppy conditions. Aggressive traders might see value here, but conservative analysis suggests waiting for the 4H trend to align with the higher timeframe support before assuming a bottom is in.
3. Key Levels to Watch
Resistance: The 92,000 - 93,000 zone. Any rally into this area is likely a retest of resistance until proven otherwise.
Support: The 87,000 level (Previous Day Low). This is the invalidation point for the weekly support thesis.
Summary & Plan Patience is key. The prudent approach is to wait for the 4H trend labels to flip back to BULLISH. Attempting to buy this dip before a confirmed structural change is fighting the immediate trend.
Watch for a confirmed break above the local moving averages to signal that buyers have regained control.
Avwap

MES Bullish Confluence: .382 Fib + AVWAP + DemandPrice is pulling back into a high-probability "reload" zone. The current correction on MES is targeting a triple-confluence area where institutional support should step in to resume the strong uptrend.
The Technical Setup The "Smart Advisor" confirms the trend is Strong Bullish. We are looking for a bounce at the 6853 level based on three specific factors aligning at the same price point

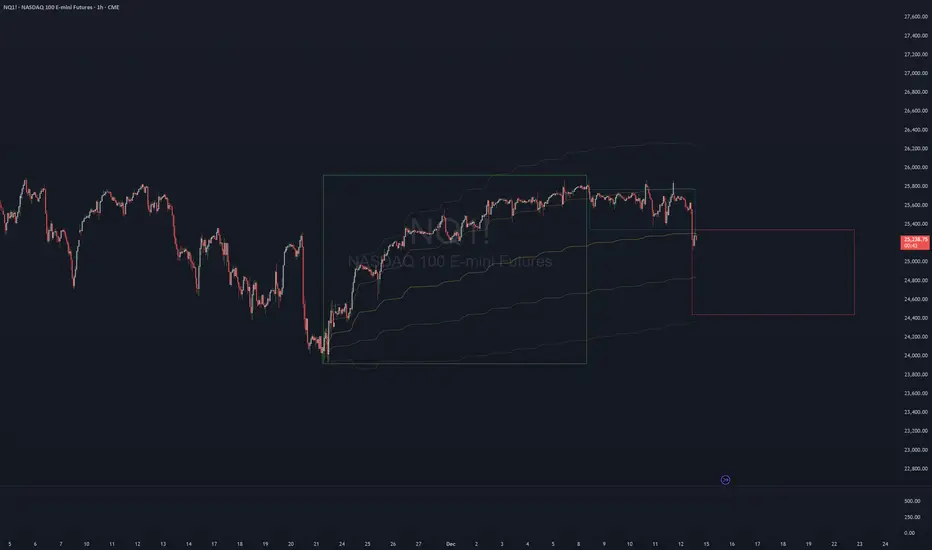
Short NQLaunched an anchored VWAP from the swing low (11/21/25 pre-mkt):
-Traded constructively (finding support above the +1 deviation band) for about 17 trading days
-Lost steam, started trading below +1 dev band; support became resistance (Mon 12/8 pre-mkt)
-Fell below VWAP this morning (Fri 12/12 10am-ish)
.....and until it escapes that red box, it's a short for me.
Short NQ
the real question is what happens to $ETH at ATH?eth is currently holding above the quarter channel with resistance above between 3500-ATH
there is a potential moonshot to 7k and beyond (13k?), if the markets are indeed in the infant stage of a bull run.
for now eth is heading towards the golden pocket of the move down with support from ath avwap
as htf bullish market structure never broke this could mean that the highs are ran, rsi has bounced the mid point and could be cruising towards the cook zone again, its here i will watch to see a divergence form when the 3M OB and yearly level is approached.
upside 3500, 4500/ATH, 7000, 130000
downside 1900, 1200, 800
its quite possible that we put in a long term range drifting between 5k and 1k before we see expansion upwards
nfa, just food for thought on the htf but most of the volume is supporting price.

OCT 9: HTF POI + CONFLUENCE ALIGNMENTOCT 9: HTF POI + CONFLUENCE ALIGNMENT
- price lost momentum at the 4H FVG
- RSI + CVD DIVERGENCE at the 15m TF and below
- Price respecting divergence
- targeting long towards premium LVN + FVG
only thing to do is to wait.

OCT 8: MMT + VOLUME PROFILE LOL LET'S SEE HOW IT GOESOCT 8: MMT + VOLUME PROFILE LOL LET'S SEE HOW IT GOES
Kinda getting lazy putting these descriptions here, or maybe I just don't want to at this point in time. just check the latest long position I made here and check it for yourself why I came to that conclusion lol.
but if not then here's the idea:
- TARGET/BIAS = WEEK TARGET + LVN + FVG (that price didn't fully mitigate/take over/ breakthrough etc)]
- NARRATIVE = FVA coming off of previous high breakout and continuation supported by RSI & CVD, + AVWAP FLIP
- ENTRY = FVA RE-TEST
That's it.

oct 7 : adding CVD and FRVP(LVN & POC) to confluence... oct 7 : adding CVD and FRVP(LVN & POC) to confluence...
kinda confusing? we'll see how it goes.
Idk why I entered long despite the orderflow and divergence showing bearish signs.
oh wait i know.
because of price action theories (old sweep + divergence, then IFVG + BB breakout)
So uhh, we'll see how it goes?

oct 6: tp hit xDoct 6: tp hit xD
hell yeah brother.
well, I guess the strategy was applied anyway.
and the FRVP helped, maybe?
Sweep + Low Volume Node + OTE + FVG, among the other confluences on my checklist.
What I could have done better on this trade though... was not enter prematurely. in that way, I could have put my 2RR TP above the "TARGET" liquidity. Because as you can see, price swept the target liquidity, and then reversed immediately.
Only by strong orderflow was price able to go lower again. But if it wasn't for this, price would have reversed and hit my SL.
check one of my previous trades, I have this described there in more detail.
everything on this trade is perfect besides my TP point. and maybe my entry, it was kinda rushed ngl.
oct 6: volume profile stuffoct 6: volume profile stuff
I wanted to try something new.... and i feel like imma lose here outright lol.
trade logic though is the 15min sweeping pattern stuff i found out last month, and supported by the FRVP.
I think i'm gonna lose this trade though. we'll see.

Short Idea On Sugar (SB1!)Based On :
- Markov state still in bearish regime
- VP and Avwap levels
- Supply zone

sept 29: 1 loss, 2 winssept 29: 1 loss, 2 wins
I saw that price tapped the DAY FVG + EQH up there and has downtrended massively, so I looked for shorts.
Applied my AVWAPS, and my confluence filters(Orderflow+sweep+div+FVG), which was favorable so I entered.
I kinda rushed into the first trade because I woke up late, but basically would have also won there if I just plotted the AVWAP first(yeah), because if i did plot my AVWAP,
I would have seen that price has a few more pips before hitting the AVWAP line, so I could have put my entry higher and my stoploss higher.
Well I just moved my SL on the first trade, and then re-entered twice after it "respected" the AVWAP (plotted from the DAY FVG STING).
Standard 10TP5SL, and it won twice. so, good day I guess.

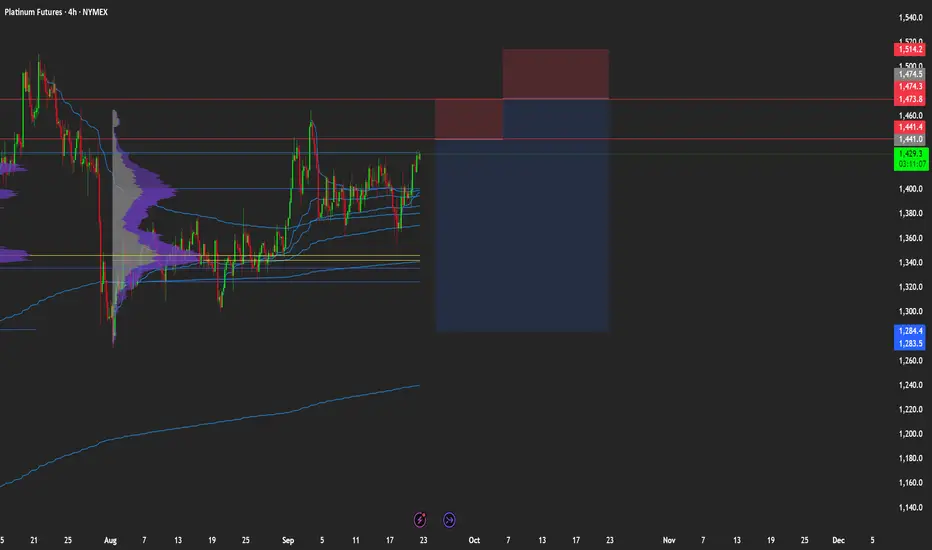
Short Idea on Platinum (PL1!)Based on :
- High Probability of a dxy rally and zb1! short could make precious metals drop
- VP and Avwap levels
- 2 Potential supply zones
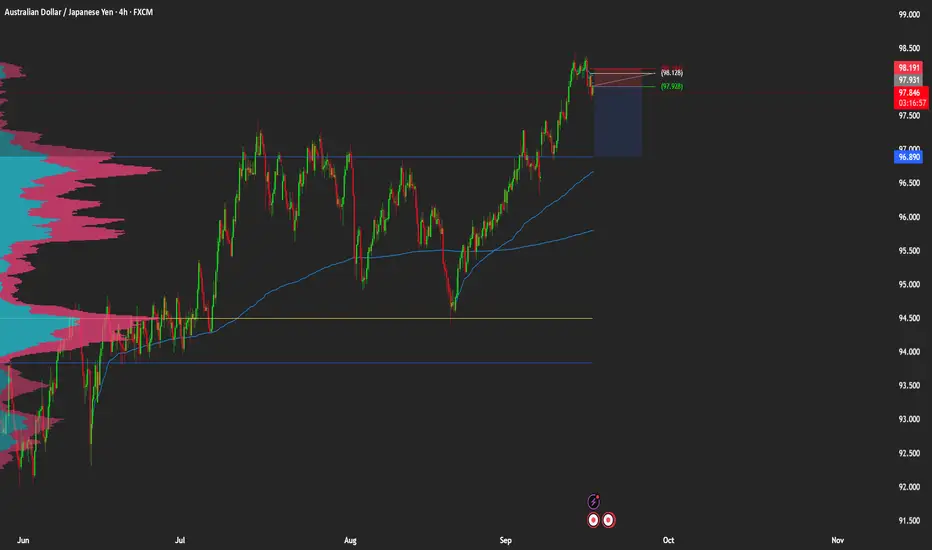
Short Idea On AUDJPYBased on :
- Supply zone and weekly avwap as entry level
- VP target 4rr
- Cot Analysis
- Quantitative Analysis
Buy MSTR - many indicators lead me to buy.Many, many indicators lead to a buy on mstr. Avwap, divergences, stochastic... strong buy for me. Stop loss at about 350$. Take profit could be set to 455$ (or adjust it while it's running). Of course it depends on the performance of btc, but I'm also bullish for btc (at least n short term).

Beating the S&P 500 with TradingView's Stock ScreenerThis is Mo from MWRIGHT TRADING. The date is Friday, June 27th, 2025.
This video is about selecting stocks that collectively have the potential to consistently beat the S&P 500
I look for smooth and consistent long-, mid-, and short-term performance. For that we need
Building a Screener
What I look for
- Liquidity - that means money, or trading volume.
- Room to move - no overhead resistance
- Favorable trends - stable moving averages
- Good short term signals - a good intraday chart
Filters
- Market Cap 300M to 2B
Not too big, and not too small
- Perf 10Y > Perf 5Y
No long term dips in performance
- Perf 5Y > Perf 1Y
No short term dips in performance
- SMA(300) < Price
Price above moving average
- SMA(200) < Price
Price above moving average
- Avg Volume 10D > 100K
No lightly traded stocks. Liquidity needed
- + SMA(200) >= SMA(300)
Stacked long-term SMAs
- + SMA(50 >= SMA(200)
Stacked short-term SMAs
- + ROE, Trailing 12 Months > 0% (Chris Mayer)
Improving ROE
Examples
- SENEA
- DGII
Review the charts
- Verify short term performance
- Multi-VWAP (1 hr Chart) - Free Indicator
- Above a rising 5-Day AVWAP
- Magic Order Blocks (5 min Chart) - Free Indicator
- No major overhead resistance
- Verify fundamentals and long term performance
- ROE (Quarterly) - TV Indicator
- Rising ROE
- Float Shares Outstanding - TV Indicator
- Lower float means lower supply. When high demand occurs, this can act as a price catalyst.
- Multi VWAP from Gaps - Free Indicator
- Stacked is good
- 3 SMA Ladies - Custom Indicator
- Stacked is good

INTEL DROP --- FIELD COMM LOG #02242025🪖 WAR ROOM DISPATCH — FIELD REPORT FROM CAMP JARVIS & CAMP LIVERMORE
Date: 4/24/2025
Status: STANDBY
Volume: Normal
Current Order: HOLD
⚔️ SUMMARY OF ENGAGEMENTS – LAST 30 DAYS
The battlefield has been blood-red. Abnormal reactions litter the map. Morale was tested—but our troops never broke. The Red Army pushed hard, exploiting weakness, creating chaos. Yet we held.
📍Camp Jarvis
Coordinates: 115.10
☑️ Status: HOLD
📈 Trend: UPTREND
📊 ATR: Tightening (3.39)
🟩 Zone: Top of box: 115.10 | Bottom: 86.62
📢 Latest: “We’re nearing breakout. Position secure. Scouting volume now.”
Jarvis is seeing a shift—momentum is whispering beneath the soil. There's life stirring. But RSI is low (sub-45). This isn't the time for heroes—it’s a time for patience. Let the weak exhaust themselves.
📍Camp Livermore
Position: Natural Reaction Zone
☑️ Status: HOLD
📉 Trend: Weak uptrend but too early to act
🔄 Recent movement: Mixed signals, sporadic action, no confirmation.
Livermore's forces are strong in discipline, but not yet in numbers. They report: “Volume’s stable, but not convincing. We’ll move when the field confirms it—not before.”
📛 INTEL WARNING
The maps are clear—we are not in breakout yet.
There’s a false calm in the air.
Do NOT chase. Do NOT preempt.
This is how armies get slaughtered in the fog.
💡 Key Quote from Command:
“The Red Army still has strength. We’re holding—but holding isn’t winning. We wait for the flinch. The break. The rally cry. That’s when we move.”
🎖️ Current Position: HOLD
🛡️ Camp Jarvis: Monitoring breakout zone
🧭 Camp Livermore: Awaiting troop confirmation
📉 RSI low, Trend early
🔕 No All-Signal-Go confirmed
🚨 Mixed Signals = DO NOT ADVANCE
The war is not over.
But neither are we.

BTC/USDT 4H – Breakdown & Key Levels
📉 **BTC/USDT 4H – Breakdown & Key Levels**
Bitcoin has **broken down from a prolonged consolidation range** (blue zone), failing to reclaim the key resistance at **~$96,858**. The rejection from the **200 EMA (blue)** confirmed bearish momentum, leading to a sharp decline.
🔹 **Support Levels:**
- **$82,222** (recent low) – Held briefly.
- **$78,000 - 80,000** (thick blue line) – Major support area from historical price action and VWAP levels.
🔹 **Bearish Case:**
- Breakdown from $82,222 could open the door to **$78K-$80K**.
- Volume is increasing on the dump, confirming strong selling pressure.
🔹 **Bullish Case:**
- Bulls need to reclaim **$91,800+** for a reversal.
- A bounce from $78K-$80K could trigger a relief rally.
⚠️ **Watch for reactions at the next support level!**

Nifty's Next Move? 24,000 on the Cards!The hourly candle formed on Friday, 7th Feb looks promising! A bullish engulfing pattern, confirming RD while taking support at AVWAP, sets up an interesting long opportunity. With the low of this candle on a closing basis as SL, going long makes sense.
📈 Upside Target? 24,000 in the coming weeks!
📉 What about ATH? A new all-time high (ATH) looks unlikely unless we see a clear breakout above the heavy supply zone of 24,200 - 24,300.
🔍 Trading Idea
For now, shorting PUTs seems like a good play, aiming for 23,800 - 24,000 levels with a clear SL of closing below 23,400.
👀 What's your view? Drop your thoughts below! 🔥📊
⚠ Disclaimer: This is my personal view and not a recommendation or tip. Please do your own due diligence and study before making any trading decisions.
NSE:NIFTY

SHORT META Ahead of Earnings Report Based on Insider Selling"Meta Platforms Insider Sold Shares Worth $22,132,922"
Mark Zuckerberg, 10% Owner, Director, Chair of Board and Chief Executive Officer, on January 15, 2025, sold 35,921 shares in [eta Platforms. Following the Form 4 filing with the SEC, Zuckerberg has control over a total of 353,696 shares of the company, with 353,696 controlled indirectly.
Jennifer Newstead, Chief Legal Officer of Meta Platforms sold 905 shares of Class A Common Stock on January 14, 2025, at a price of $604.54 per share, totaling $547,108. Following the transaction, Newstead directly owns 31,105 shares of Meta Platforms.
Jennifer Newstead, Chief Legal Officer of Meta Platforms, sold 905 shares of Class A Common Stock on January 21, 2025, at a price of $618.0 per share, totaling $559,290. Following the transaction, Newstead directly owns 30,200 shares of Meta Platforms.
The sales were conducted under a Rule 10b5-1 trading plan adopted on November 30, 2023.
Olivan Javier, Chief Operating Officer of Meta Platforms, sold 413 shares of Class A Common Stock on January 21, 2025, at a price of $618.0 per share, totaling $255,234. Following the transaction, Javier directly owns 16,275 shares and indirectly owns 95,287 shares through various entities.
The sale was conducted under a Rule 10b5-1 trading plan adopted on August 30, 2023.

Is Volkswagen a buy?I see a lot of people on social media claiming that Volkswagen is now a good buy because the stock is undervalued, because the government will intervene, because it's not all that bad, and so on.
However, if you take a look at the weekly chart with the most basic tools, you will notice that the share is currently not sending any signs that indicate an imminent upward trend in the context of a Stage 2. The price is below a falling 30-week SMA and below a falling AVWAP from the ATH. Even though the price has risen “significantly” in the last two weeks, this should not be a reason for FOMO. Once a trend has been established, it is more likely to continue than to reverse. And as long as the chart does not improve significantly, it is more likely to be a short-term countermovement within a long-term downtrend with lower highs and lower lows. Guilty until proven innocent. For an experienced swing trader, it may be possible to take advantage of these short-term countermovements to generate profits. However, this is too risky for inexperienced traders. Sure, it could happen that the stock will continue its short term move up and establish a Stage 2 with a long term upward trend - but it is not likely. Trade the chart in front of you and listen to the market.
As Peter Lynch liked to say: "If they don't scare you out, they will wear you out."
Bottom fishing is not advisable. Let institutions do the dirty work and do not let FOMO make you trade risky setups. Wait for a clear change of the trend and sentiment.

ZAL entering stage 2?ZAL has been in a downtrend for years. With AVWAP anchored to ATH we cleary see that sellers haven been in control until now. With a pattern of higher highs and higher lows the price moved above a rising 30 week SMA and broke above ATH AVWAP. A further catalyst could be the announcement that ZAL want to acquire its competitor YOU for 6,5 € per share. If the momentum continues we are likely so see a stage 2 breakout in ZAL.

PLTR to $80 by EOYPLTR had a great day today, and has had a great month so far following an earnings report that beat estimates. Using the Magic Linear Regression Channel we can see that PLTR broke out of a 2-year long channel at the beginning of the month (November 2024) following it's earnings report.
This means that its price structure has a brand new change of character. Using a second Magic Linear Regression Channel , we can create a new channel based on the pivot high prior to earnings and the pivot high prior to today. However, PLTR is also breaking out of that channel. By adding an additional outer Fibonacci band to the new channel, we can see that PLTR has a potential area of interest at around $80 - a 10% move.
If the new channel is valid, then this can be the first area where we might see a correction in a bullish scenario. Since PLTR is already at the top of the new channel, it could potentially bounce back from there, but it's already moving up in post-market trading, so, I'm guessing that bearish scenario is less likely.
Barring some crazy world events, I'm guessing we can see a steady move to $80 before seeing any kind of major correction.

Get ready for the upsideThe stock appears to be in a pullback phase. I anticipate it will find support around the previous monthly highs, keeping prices contained between that level and the anchored VWAP (Volume-Weighted Average Price) from the recent swing high. Once the price advances back up toward this anchored VWAP and experiences a slight pullback, the key will be to break through it. If the stock establishes a pattern of higher highs and higher lows on the 30-minute chart, it would strengthen the bullish outlook.
