EU sale inside of monthly consolidation, stick to short swingsThe internal range movements are the best return right now. Trying to target long runs in this internal range liquidity is very difficult right now.
Until we close outside the mother range (highlighted) on the monthly candles, it will continue to have this struggle as none of the larger traders are willing to risk huge in this range.
That will never stop us from trading 1-4H internal range orderblocks for small wins. As we see now the daily is giving good amount of days in each direction. 2026 already locked-in. It's easy 🙏🏾
Barr

UJ stuck inside of the mother candle, consolidating heavilyAs you can see the consolidation candles highlighted are holding price in a low volume state. We will need to visit the external range of these candles to gather more orders.
Until then we scalp the range of the lower time frames

Gold should be going up to hard test the new supply range aboveGoing into the new year strong with Gold as expected. Coming into the new year we are going heavy into the teaching of explanation of markups and expectations. These videos will be a bit longer. The OGs will find much of it repetitive but there are many new faces coming to the new year so we must explain what we are seeing in greater clarity.
It looks like we can begin to look for swing lows to form to go long at present. We will continue to track the progress as the week builds. We will track the lower time frame progressions in the VIP chats 💎
Don't forget to add your thoughts or point out anything I may have overlooked 🙏🏾

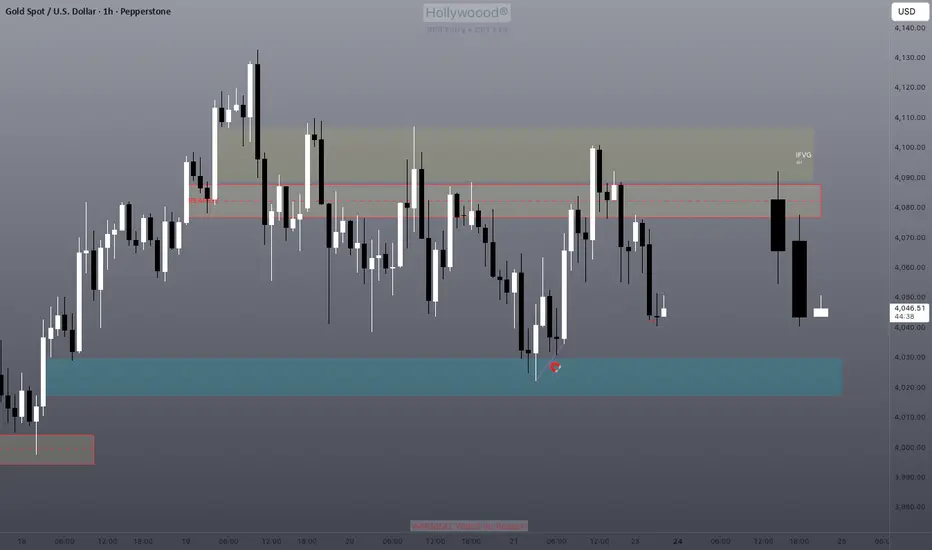
Gold has given a new high but has dropped back into supportNot an easy situation here on gold but the zones are pretty well defined. We are looking to see how gold treats the bearish supply recently created above the range, as well as monitor how the lows are being treated coming into the new year.
We are expecting much bullish discovery on the horizon as there is no real indication it will slow its growth curve as of yet.
Be sure to subscribe for more clear breakdowns

Gold is still showing us it's bearish intent on the macroEasy peasy reading on the week so far. Let me know if I missed anything. I'm here for the sharing of info 💎

Imbalance below range seems to be the current targetBlue zone is the bullish imbalance that was left behind last week.
Price only targets lows or imbalances below support during sell-offs. Let's see what we get with this one.
Stock market will test yearly levels below current supportAs the yearly candle closes and the new one opens, there is an orderflow pattern that is well developed. This will play out again as always 💎

Gold may seek higher imbalances on the sessionWe have reached the previous forecast goal. Today is a much more convoluted range. It seems we can be bullish here but the resistance just above should be the target and no more.

Gold still in it's year-end range, good scalping opportunitiesThis year's high is in, the same forecast as last year if you watched with me this time last December.
We can expect that the new year candle will target the previous high quickly and swiftly as always, but until then we scalp this year-end wick range using LTF OB/FVGs for minimal pip TPs

Gold finally has a supply range! Time for bullish correction?I talked about everything but the obvious inverse head and shoulders/Quasimodo forming the right shoulder now. If everything goes right can we expect an arm to extend upwards here during the stochastic buy cycle?
Let me know what you think and be sure to share and care for others if you found this helpful.
Also talked about the "REAPER WARNING" as we have a reaper inversion range actively terrorizing price 🧩

How to find algorithmic levels of support and resistanceUsing repeating pinpoint levels to form meaning of opens and closes around these levels give you an advantage in your analysis.
As price gives us clues to what levels are affecting price, we should mark the new candles that are responding to these levels by breaking and retesting these very levels.
Please let me know your thoughts! 🙏🏾

ETH and BTC seeking further lows?Everything explained in video, please let me know if I missed anything or any other thoughts 🙏🏾

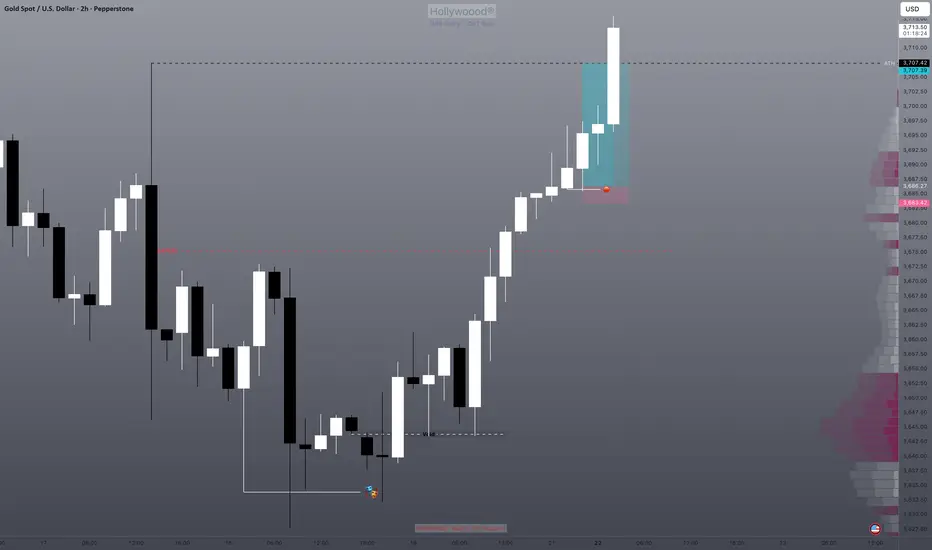
Gold: One of the easiest longs in historyStop hunt of the leading candle, enter long and hold to ATH.
Rinse and repeat. Sometimes the long winded stuff loses the value of how simple it can be 💎
ETH and Crypto going for weekly correction levels?Everything explained in video, let me know if I missed anything 🙏🏾
Don't forget to like this if you would love to see more of these reviews!

Review of Gold's expected rally and why we entered long todayLook at this chart and understand why it was the only move that was likely to happen today:
Firstly we already corrected all of the range down (balanced), that was the first key that we're potentially going to correct the drop next.
This is how markets work; correction of imbalances and continuations of the master trend direction.
The master/macro trend target is always the easiest no brain target for those of us who actually make money trading. Anytime we correct imbalances, we are looking to buy, only degenerates are looking for the short target and never realize where it is or when it's been hit--hello? It's the imbalanced ranges below, write this down:
When we are bullish, price will only go down to correct the major imbalanced ranges and then continue bullish.
There is no supply zone until the large wick range.
I will help you understand this stuff tirelessly even for free although I charge a $100/mo mentorship I don't care if people pay me, I just want you to see the easy truths about the chart most don't see 🫡

Is NASDAQ going for a correction or Stop Hunt?Are we on the right track? If I missed anything please let me know in the comments 🙏🏾

NAS still charging HighsEverything explained in video, please let me know if I may have missed any details!

1-2-3 Correction coming in BTC?We reached the low of the weekly CR target last week. WIth the new bullish candle of last week, we can expect this week to be bullish as well but the target is shallow; the high of the bearish candle from 2 weeks ago 👀
We expect another selloff from the bearish imbalance range (purple) that will complete the 1-2-3 correction

XAU 90% Chance of hitting ALL TIME HIGHS?!Please let me know what you think. If I missed any details that may be important please let me know.
This is my way of giving back while getting other's opinions.
Thanks 🙏🏾

Can ETH make it out of this clearly defined correction range?
Excuse my mic quality, my Airpods highjacked my audio 🥹
If you can still understand what I'm saying, please let me know if I missed anything and what you think about this range. Thanks 🫡

BTC vs ETH: Lil Bro not waiting on nobody?!As BTC is stuck trying to convince everyone to stay long, ETH is using its bullish orderblocks really well...shorts are showing signs of letting go in these ranges.
Would like to hear your take!

Short Breakdown of Cardano (ADAUSDT) weekly/daily technicalsLooked over this for a friend. Rowland I would love your feedback in the comments 🫡
I will see my biggest expectation is for this to make it's way into the weekly imbalance range below the weekly Mother Candle we are existing within. The entire crypto market seems to want to revisit some key lows to correct some inefficiently delivered rally ranges (meaning too many pending orders left behind due to price not coming back to grab them, happens when HUGE money places--attempts to place/fill--bulk orders).
We are getting what I think is a temporary bullish correction due to taking of profits at key lows. It is my belief/observation that after correcting the newly minted bearish range (grabbing pending shorts above daily highs--turtle soup I think they call it), we will be able to drive down into the bullish imbalance weekly candle's range.
Let's see how we go! 😈

Is the DOLLAR bullish? Look at the weekly support zone levelsI am trying to figure out what the recent bullish days mean within the overall range.
Please let me know what you think 🙏🏾
