BAT is getting close to the buyers' zone (3D)After multiple drops, it seems that BAT is getting close to a strong support level. In this zone, it is possible to buy gradually in spot.
The targets are indicated on the chart.
The closure of a daily candle below the invalidation level will invalidate this analysis.
Do not enter the position without capital management and stop setting
Comment if you have any questions
thank you
Bat

USDCAD BUY 1.3774On the daily chart, USDCAD has fallen from its highs. Currently, pay attention to the area around 1.3774, which is a potential buy point for a bullish bat pattern. At the same time, this level is within the previous demand zone.

CADCHF - Potential Bearish BatCAD/CHF is completing a clean Bearish Bat pattern at 0.58658.
Price is entering a major supply zone, forming RSI bearish divergence, and pushing above the value area into a low-volume rejection area. These conditions create a high-probability sell setup.
Entry:
Sell 0.58550 – 0.58800 (after confirmation)
Stop Loss:
0.58950 – 0.59100 above X and liquidity
Targets:
TP1: 0.576–0.577 (0.382 retracement + POC zone)
TP2: 0.570–0.571 (0.618 retracement + VAL)
TP3: 0.563–0.565 (macro structure)
Harmonic completion + fib clustering + structural supply + VPVR resistance + RSI divergence = textbook bearish reversal conditions.

EURGBP BUY 0.8680On the daily chart, EURBBP is fluctuating at high levels. Currently, attention should be paid to the support level around 0.8680, which is a potential buy point for a bullish bat pattern and is also located within the previous demand zone.

BTCUSD SELL 104400On the daily chart, ETHUSD has stabilized and rebounded, with bulls holding the upper hand in the short term. Currently, attention should be paid to the resistance around 104400, a potential shorting entry point for a bearish bat pattern, which also falls within the previous supply zone.

BTCUSD - Potential Bearish BatBTCUSD forming a Bearish Bat pattern completing at 102,367, aligned with major supply, fib confluence, and momentum divergence.
Expectation: Price to reach PRZ, sweep liquidity, and reject lower.
Entry:
Short 101,500–103,000 (aggressive)
or
Wait for bearish confirmation.
Stop Loss:
103,500–104,500 above X and liquidity pool.
Targets:
TP1: 95,000–96,000
TP2: 90,000–91,000
TP3: 82,000–84,000 (runner)
Reasoning:
Harmonic symmetry + fib clustering + low-volume node + RSI divergence all point to a probability-weighted bearish reversal.

ETHUSD Bearish BatETH is completing a Bearish Bat pattern at the 0.886 retracement near 3,476, coinciding with prior supply, bearish RSI divergence, and a low-volume node overhead. The harmonic pattern aligns with structural liquidity and fib extensions that indicate likely exhaustion.
Prediction:
Expect rejection and reversal from the 3,450–3,500 PRZ, with downside targets toward 3,150, 3,000, and potentially 2,800.
Entry:
Short at 3,450–3,500 (aggressive) or after confirmation (conservative).

ETHUSD SELL 3540On the daily chart, ETHUSD has stabilized and rebounded in the short term, with bulls in control. Currently, attention should be paid to the area around 3540, which is a potential shorting entry point for a bearish bat pattern, and it also falls within the previous supply zone.

USDJPY TP 148.14On the weekly chart, USD/JPY encountered resistance after testing the previous supply zone, and the current price action has formed a bearish bat pattern. The current downside target is the 0.382 Fibonacci retracement level (151.86), with a second target at the 0.618 Fibonacci retracement level (148.14).

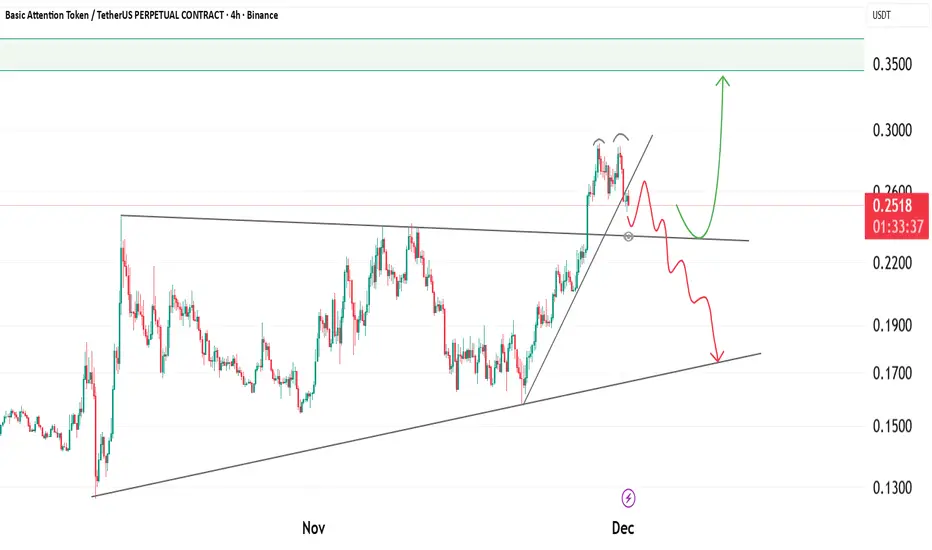
BAT – Decision Point Ahead as Structure TightensBAT is approaching a critical decision zone as price moves within a tightening structure. After a strong impulsive leg upward, the market is now forming a potential topping pattern while sitting directly on the trendline support.
The current behaviour shows two possible scenarios depending on how price reacts around this region. The market has respected this ascending support multiple times, making it an important level to watch closely.
Key Observations:
• The recent high has created a potential double-top structure, signalling exhaustion.
• Price is currently testing the trendline, which defines the short-term bias.
• A clean reclaim above the nearest resistance can re-ignite bullish momentum.
• A breakdown from the trendline would confirm deeper corrective movement.
Bullish Scenario:
If price holds the ascending trendline and pushes back above the recent breakdown zone, the next wave upward may begin. Momentum would favour a move into the next high-liquidity region.
Bearish Scenario:
A confirmed break below the trendline would open the path toward lower support levels. This scenario implies that the current rally was an overextension and needs deeper correction before any continuation.
In simple terms:
BAT is at a major support level.
Hold the trendline and it can send another bullish wave.
Lose the trendline and a deeper pullback becomes likely.
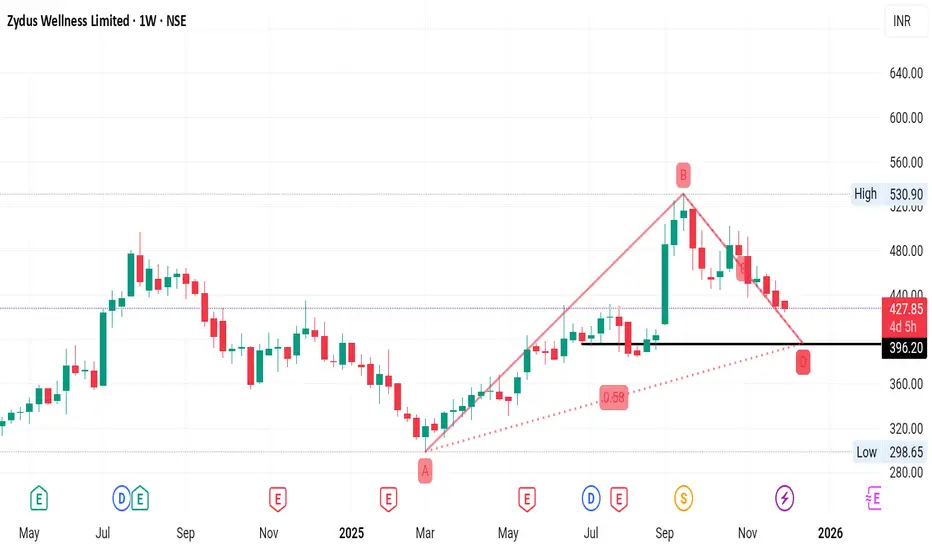
ZYDUSWELLNESSNSE:ZYDUSWELL
In weekly time frame bat pattern fomed.
for educational purpose only
information provided is for informational purposes only and should not be construed as investment advice or an offer to buy or sell securities. Investors are advised to carefully review all materials and consult with a financial advisor considering their own financial situation and risk tolerance before making investment decisions. The disclaimer also often includes statements about no guarantees or warranties regarding the accuracy, adequacy, or completeness of the information provided and emphasizes that investments can fluctuate in value and there is a risk of loss
GBPUSD - Flag + Bat= SARMy top trading idea of the week comes on GBPUSD, and it’s a unique scenario packed with multiple setups working together. The first is a potential bearish Bat pattern forming at higher prices. The second is a potential bullish flag pattern that develops before the Bat completes, offering an early opportunity to get involved on the long side.
The third setup ties everything together using a technique called the “Stop and Reverse.” This approach allows traders to transition directly from the bullish flag buy into the bearish Bat sell, creating a seamless shift from one opportunity to the next. In this video, we’ll break down how each setup works individually—and how combining them can unlock a powerful, multi-layered trading plan.
Hope you enjoyed my Top 5 this week!
Please leave any questions or comments below and I wish you guys a great week of trading.
Akil

USDCAD BUY 1.3990On the 4-hour chart, USDCAD has pulled back from its highs. Currently, we can pay attention to the support around 1.3990, which is a potential entry point for a bullish bat pattern. At the same time, this position is within the previous demand zone.

BATUSD - Accumulation Phase EndsHello,
Brave Browser reached 100M users, in 2020 had less than 20M.
BAT is listed on Grayscale.
Funds as B2C2 started buying sprees in the last few days.
FalconX deposits grew in the last 7 days.
This is not a trading advice.
Thanks
Gex

GBPUSD SELL 1.3419On the daily chart, GBPUSD has stabilized and is trending upwards, with bulls holding the upper hand in the short term. The current resistance level to watch is around 1.3419, a potential entry point for a bearish bat pattern, and also within a previous supply zone.

XAUUSD SELL 4217On the 4-hour chart, XAUUSD has stabilized and is trending upwards, with bulls holding the upper hand in the short term. Currently, attention should be paid to the resistance around 4217, which is a potential shorting entry point for a bearish bat pattern and is also within a previous supply zone. If the price breaks through the resistance around 4245, it will continue to rise.

BTCUSD SELL 91640On the 4-hour chart, BTCUSD rebounded after a sharp drop. Currently, attention should be paid to the resistance around 91640, which is a potential shorting point for a bearish bat pattern, and it is also located within the previous supply zone.

Elloit wave ETH 11/23/2025This is my current Elliott wave count of ETH.I think that there will be a last lower low and then,the wave 3 shall begin.

Potential bullish bat xrp/usdJust throwing this out there to see if it sticks with anyone. Any insights are appreciated. Thanks

ETHUSD BUY 2442On the daily chart, ETHUSD is trending downwards, with the bears in control. The price is expected to continue lower, with support around 2442, a potential buy point for a bullish bat pattern, which also falls within a previous demand zone.

SOLUSD Bullish Bat Pattern Thesis – 4H & DailyI'm monitoring SOL for a potential bullish Bat harmonic reversal pattern developing on both the 4H and Daily timeframes. The Bat pattern is a high-probability harmonic formation that can signal trend exhaustion and a reversal, especially when confirmed at the D leg, which typically completes between the 0.886–0.9 retracement of the X-A move.
4H Chart
Structure: The price is currently correcting after a local top, with recent lower lows forming potential A, B, and C legs in sequence.
Key Bat Levels:
X-A: Local swing high to low, establishing the pattern's root.
A-B: Retrace to ~0.382–0.5 of X-A.
B-C: Moves higher, ideally hitting around 0.382–0.886 of A-B.
C-D: Final leg down, targeting the 0.886 retracement of the X-A origin.
Criteria:
Watch for a bullish reaction in price and supporting indicators (volume spike, bullish candle formation, positive divergence) at/near the 0.886 retracement.
Confirmation from order flow or divergence indicators adds confluence.
Daily Chart (D)
Pattern Fractal: The Daily shows a broader corrective move that could echo the 4H pattern, with a larger-scale Bat formation possibly in play.
Entry/Trigger Level: The ideal buy zone is at or just below 0.886 of the key X-A swing.
Risk Controls: Set stop losses slightly below X to minimize risk if the harmonic invalidates.
Targets:
Initial: Return to point C (~0.5–0.618 retracement of A–D)
Ultimate: Approach point A swing high for full pattern completion.
Thesis & Market Context
SOL remains structurally bullish on higher timeframes despite the local correction.
Bat completions often coincide with liquidity sweeps and value zones, strengthening the reversal thesis.
If D completes as drawn, expect a rapid reaction as short liquidation and fresh bids enter the market.

EURUSD downside target: 1.154On the 4-hour chart, EURUSD encountered resistance and fell back after testing the previous supply zone, forming a bearish bat pattern in the short term. Currently, watch for resistance around 1.162; consider shorting if it rebounds and encounters resistance. Support is around 1.154, and a break below that level would target the 1.147-1.150 area.

XRP - BEARISH XRP - price update: 🟥
Double top MOTHLY - Deeper correction awaited?📉
Bearish breakout loading! ? 🟥
Very neutral on each time frame.
The 2.100$ weekly support is holding for now.
I don't like the weekly / daily configuration, hence I anticipate a bearish breakout to visit the SSB weekly (monthly support) around 1.90 - 1.880$ 📉
Technically:
The 50% fib support W/M has been tested many times.
It looks like a slow descending channel (bearish accumulation to me) 📉
A Weekly candle close under 1.90$ could be pretty bearish! 🔴
🎯Medium term outlook:
📉Bearish setup and key levels in my charts
Long term play:
📈Overall, I remain bullish above monthly uptrend and 1.600$ demand zone. A breakout under 2.00$ could lead to a sharp correction toward this level! 📉
💡Keep in mind that Liquidities from #XRP could outflow into others #ALTS. (money rotation from large cap to low caps).
