RSI Divergences S&P500, Stage is settingIt could be bumpy ride today.
The divergence in RSI sone thing.
Sentiment will quickly turn on wars brewing with Mexico, Iran.
Russia and China would back Venez'.
I'm not saying its the start of the bear market.
But if ones required. This could Be a trigger
Bearish Patterns

EJ Falls Into A WedgeOANDA:EURJPY has formed a Falling Wedge with Lower Highs into Lower Lows!
Price has tested the Falling Support three times with the Falling Resistance, so far, only tested twice.
Typically a Falling Wedge delivers a Bearish Breakout with price falling to the downside!
If price does make a rise, we should look for it to make a third test of the Falling Resistance and if successfully rejected, we could see price drop back to the Falling Support.
Regardless, once price makes a valid Breakout of either leg and Retests, this will generate trade opportunities to take to either the Overhead Resistance or Underlying Support levels!

EUR/CAD SHORT FROM RESISTANCE
Hello, Friends!
We are targeting the 1.609 level area with our short trade on EUR/CAD which is based on the fact that the pair is overbought on the BB band scale and is also approaching a resistance line above thus going us a good entry option.
Disclosure: I am part of Trade Nation's Influencer program and receive a monthly fee for using their TradingView charts in my analysis.
✅LIKE AND COMMENT MY IDEAS✅

NZDUSD - Bears Brewing at a Critical Intersection!!!📉NZDUSD has been moving inside a clear bearish structure , with lower highs forming along the orange descending trendline.
⚔️Price is now approaching a major confluence area where the upper orange trendline meets the green resistance zone, a level that has repeatedly acted as a ceiling.
As price retests this intersection, we will be looking for trend-following short setups, expecting sellers to defend this area and potentially drive price back downward within the bearish cycle.
A strong breakout above the trendline would invalidate the short bias, but unless that happens, the bears remain in control.
Are you seeing the same reaction zone on your charts? Let me know 👇
⚠️ Disclaimer: This is not financial advice. Always do your own research and manage risk properly.
📚 Stick to your trading plan regarding entries, risk, and management.
Good luck! 🍀
All Strategies Are Good; If Managed Properly!
~Richard Nasr

GBPCAD Triple Top Points To Potential Triple EventOANDA:GBPCAD on a multi-timeframe analysis allows us to breakdown this False Breakout of the Rising Wedge on the Weekly chart, lets check it out!
Price on the Weekly had made a Bearish Breakout of the Rising Wedge but price has had a great Bullish rally all week and undid all the Price Action following the Breakout of the Rising Support.
On the Daily since the Low of the Breakout @ 1.83238, OANDA:GBPCAD has begun to form an Expanding Range with Higher Highs laying out a Rising Resistance.
- MACD is signaling Bullish with lines just crossing 0 and Histogram forming green bars
Everything is saying Bullish but,
On the 4Hr we can see that Price has formed a Triple Top at the Resistance Level formed from the Highs of Dec. 4th around 1.86328 - 1.86675.
- RSI is showing a Divergence of Highs in Price
- Volume is waning as the Highs form
- MACD is signaling Bearish with a Crossover event and Histogram forming red bars
Now if Price falls below 1.85997, this will confirm the Triple Top and will mean we will be looking for Price to fall down to the AOV around 1.8546 - 1.8528.
If Price is able to find support around this level, this would Confirm the Bullish Bias on OANDA:GBPCAD on the Daily and Weekly.

EURAUD: Bearish Momentum Returns Into 2026In today's article, we are looking at the EURAUD currency pair, where a clean bearish pattern is developing that could push prices significantly lower in 2026.
EURAUD previously completed a falling leading diagonal, followed by an ABC corrective recovery. This corrective phase now appears complete, reinforcing the view that the broader downtrend is ready to resume.
The pair has formed a lower swing high near 1.8155, followed by a strong sell-off that broke below the rising trend-line support drawn from the November 2024 lows. This move suggests that EURAUD has entered the third leg lower, likely to unfold as a five-wave decline from the October high.
Further downside pressure is expected during the first half of 2026. The bearish structure remains intact as long as price trades below the descending channel resistance near 1.76. Under this scenario, there is room for an extended decline toward the 1.70 handle in the coming months, with any interim bounces likely to be corrective rather than trend-reversing.

GJ's Rise Is RoundingOANDA:GBPJPY has formed a Rounding Top after making a Breakout of the Resistance level.
Price is currently trading back in the Resistance Level and is looking to potentially make a Bearish Break back down in the the Consolidation.
Once Price breaks back down below the Resistance level, this will generate Short Opportunities to take price down to the next Support Zone.

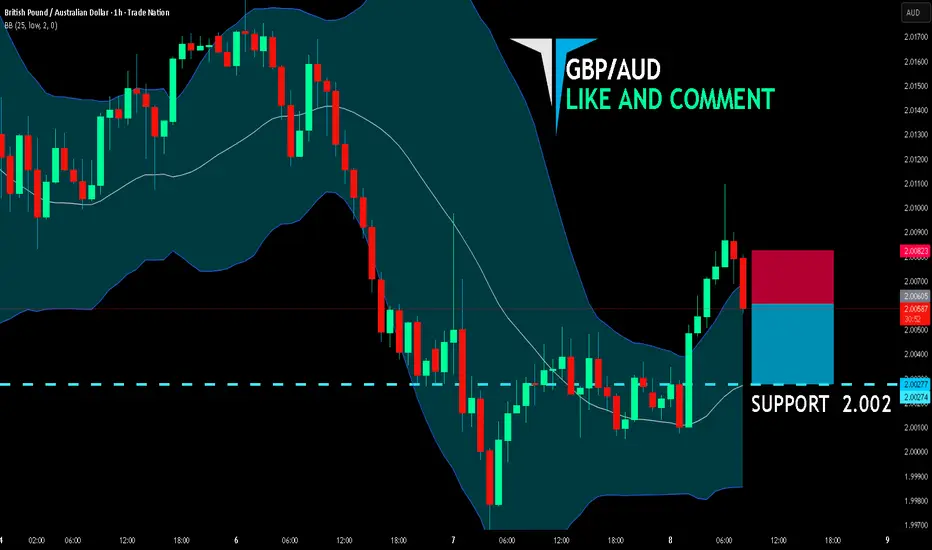
GBP/AUD BEARS ARE STRONG HERE|SHORT
GBP/AUD SIGNAL
Trade Direction: short
Entry Level: 2.006
Target Level: 2.002
Stop Loss: 2.008
RISK PROFILE
Risk level: medium
Suggested risk: 1%
Timeframe: 1h
Disclosure: I am part of Trade Nation's Influencer program and receive a monthly fee for using their TradingView charts in my analysis.
✅LIKE AND COMMENT MY IDEAS✅
GBP/NZD BEST PLACE TO SELL FROM|SHORT
Hello, Friends!
Bearish trend on GBP/NZD, defined by the red colour of the last week candle combined with the fact the pair is overbought based on the BB upper band proximity, makes me expect a bearish rebound from the resistance line above and a retest of the local target below at 2.327.
Disclosure: I am part of Trade Nation's Influencer program and receive a monthly fee for using their TradingView charts in my analysis.
✅LIKE AND COMMENT MY IDEAS✅

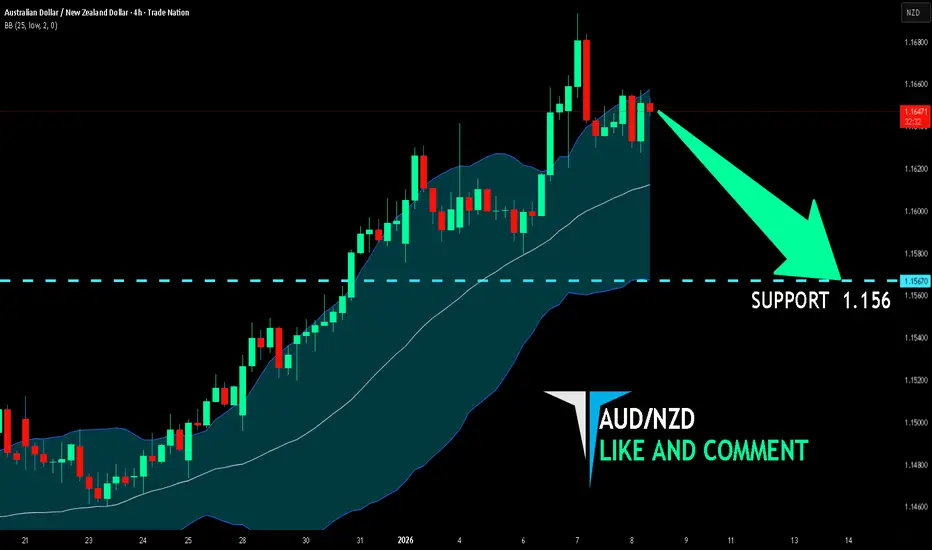
AUD/NZD SELLERS WILL DOMINATE THE MARKET|SHORT
Hello, Friends!
The BB upper band is nearby so AUD-NZD is in the overbought territory. Thus, despite the uptrend on the 1W timeframe I think that we will see a bearish reaction from the resistance line above and a move down towards the target at around 1.156.
Disclosure: I am part of Trade Nation's Influencer program and receive a monthly fee for using their TradingView charts in my analysis.
✅LIKE AND COMMENT MY IDEAS✅
NZD/USD SELLERS WILL DOMINATE THE MARKET|SHORT
Hello, Friends!
NZD/USD pair is trading in a local downtrend which know by looking at the previous 1W candle which is red. On the 4H timeframe the pair is going up. The pair is overbought because the price is close to the upper band of the BB indicator. So we are looking to sell the pair with the upper BB line acting as resistance. The next target is 0.576 area.
Disclosure: I am part of Trade Nation's Influencer program and receive a monthly fee for using their TradingView charts in my analysis.
✅LIKE AND COMMENT MY IDEAS✅

ZEC - Time to lay a bit (part.3)Our little pause from our previous zec shorts went well, its now almost back at our entry price !
4h showing a fake out with high volume and a break of a lower trendline
> thats my short signals
(sorry volume not showed here but be sure im using it)
I will TP on all the fibs retracement (same not showed on chart) and refill on shorts if I see bearish continuation !
Im playing very safe here as i expect BTC to go higher than 94 at some point
I will react on whats happening later !
Will let you know all by updating this idea
SL around 600
Cheers

EUR/CHF BEARS WILL DOMINATE THE MARKET|SHORT
EUR/CHF SIGNAL
Trade Direction: short
Entry Level: 0.9302
Target Level: 0.9294
Stop Loss: 0.9308
RISK PROFILE
Risk level: medium
Suggested risk: 1%
Timeframe: 1h
Disclosure: I am part of Trade Nation's Influencer program and receive a monthly fee for using their TradingView charts in my analysis.
✅LIKE AND COMMENT MY IDEAS✅

USOIL SENDS CLEAR BEARISH SIGNALS|SHORT
Hello, Friends!
USOIL pair is trading in a local downtrend which know by looking at the previous 1W candle which is red. On the 4H timeframe the pair is going up. The pair is overbought because the price is close to the upper band of the BB indicator. So we are looking to sell the pair with the upper BB line acting as resistance. The next target is 56.52 area.
Disclosure: I am part of Trade Nation's Influencer program and receive a monthly fee for using their TradingView charts in my analysis.
✅LIKE AND COMMENT MY IDEAS✅

USD/CHF BEARS ARE GAINING STRENGTH|SHORT
USD/CHF SIGNAL
Trade Direction: short
Entry Level: 0.796
Target Level: 0.794
Stop Loss: 0.798
RISK PROFILE
Risk level: medium
Suggested risk: 1%
Timeframe: 1h
Disclosure: I am part of Trade Nation's Influencer program and receive a monthly fee for using their TradingView charts in my analysis.
✅LIKE AND COMMENT MY IDEAS✅

GOLD BEARISH BIAS RIGHT NOW| SHORT
GOLD SIGNAL
Trade Direction: short
Entry Level: 4,460.42
Target Level: 4,408.00
Stop Loss: 4,495.06
RISK PROFILE
Risk level: medium
Suggested risk: 1%
Timeframe: 1h
Disclosure: I am part of Trade Nation's Influencer program and receive a monthly fee for using their TradingView charts in my analysis.
✅LIKE AND COMMENT MY IDEAS✅

GBP/AUD SENDS CLEAR BEARISH SIGNALS|SHORT
GBP/AUD SIGNAL
Trade Direction: short
Entry Level: 2.024
Target Level: 2.019
Stop Loss: 2.028
RISK PROFILE
Risk level: medium
Suggested risk: 1%
Timeframe: 1h
Disclosure: I am part of Trade Nation's Influencer program and receive a monthly fee for using their TradingView charts in my analysis.
✅LIKE AND COMMENT MY IDEAS✅

AUD/CAD BEARS ARE STRONG HERE|SHORT
AUD/CAD SIGNAL
Trade Direction: short
Entry Level: 0.925
Target Level: 0.919
Stop Loss: 0.929
RISK PROFILE
Risk level: medium
Suggested risk: 1%
Timeframe: 1h
Disclosure: I am part of Trade Nation's Influencer program and receive a monthly fee for using their TradingView charts in my analysis.
✅LIKE AND COMMENT MY IDEAS✅

SILVER SHORT FROM RESISTANCE
Hello, Friends!
SILVER is making a bullish rebound on the 4H TF and is nearing the resistance line above while we are generally bearish biased on the pair due to our previous 1W candle analysis, thus making a trend-following short a good option for us with the target being the 6,927.1 level.
Disclosure: I am part of Trade Nation's Influencer program and receive a monthly fee for using their TradingView charts in my analysis.
✅LIKE AND COMMENT MY IDEAS✅

GBP/AUD BEARS WILL DOMINATE THE MARKET|SHORT
GBP/AUD SIGNAL
Trade Direction: short
Entry Level: 2.013
Target Level: 2.010
Stop Loss: 2.016
RISK PROFILE
Risk level: medium
Suggested risk: 1%
Timeframe: 1h
Disclosure: I am part of Trade Nation's Influencer program and receive a monthly fee for using their TradingView charts in my analysis.
✅LIKE AND COMMENT MY IDEAS✅

USDCAD Outlook | Downtrend + January FOMC Rate Cut Risk!Hey Traders,
In tomorrow’s trading session, we are closely monitoring USDCAD for a potential selling opportunity around the 1.37800 zone. USDCAD remains in a clear downtrend and is currently in a corrective pullback, approaching a key trendline confluence and the 1.37800 support-turned-resistance area, which could act as a strong rejection zone.
From a fundamental perspective, growing expectations of a potential interest rate cut at the January FOMC meeting could weaken the US Dollar, adding further downside pressure on USD-based pairs, including USDCAD, and reinforcing the bearish bias.
As always, wait for confirmation and manage risk accordingly.
Trade safe,
Joe.

USD/CAD BEARS ARE GAINING STRENGTH|SHORT
USD/CAD SIGNAL
Trade Direction: short
Entry Level: 1.376
Target Level: 1.373
Stop Loss: 1.379
RISK PROFILE
Risk level: medium
Suggested risk: 1%
Timeframe: 1h
Disclosure: I am part of Trade Nation's Influencer program and receive a monthly fee for using their TradingView charts in my analysis.
✅LIKE AND COMMENT MY IDEAS✅

ETH/USD SELLERS WILL DOMINATE THE MARKET|SHORT
ETHUSD SIGNAL
Trade Direction: short
Entry Level: 3,117.28
Target Level: 3,026.44
Stop Loss: 3,177.72
RISK PROFILE
Risk level: medium
Suggested risk: 1%
Timeframe: 1h
Disclosure: I am part of Trade Nation's Influencer program and receive a monthly fee for using their TradingView charts in my analysis.
✅LIKE AND COMMENT MY IDEAS✅
