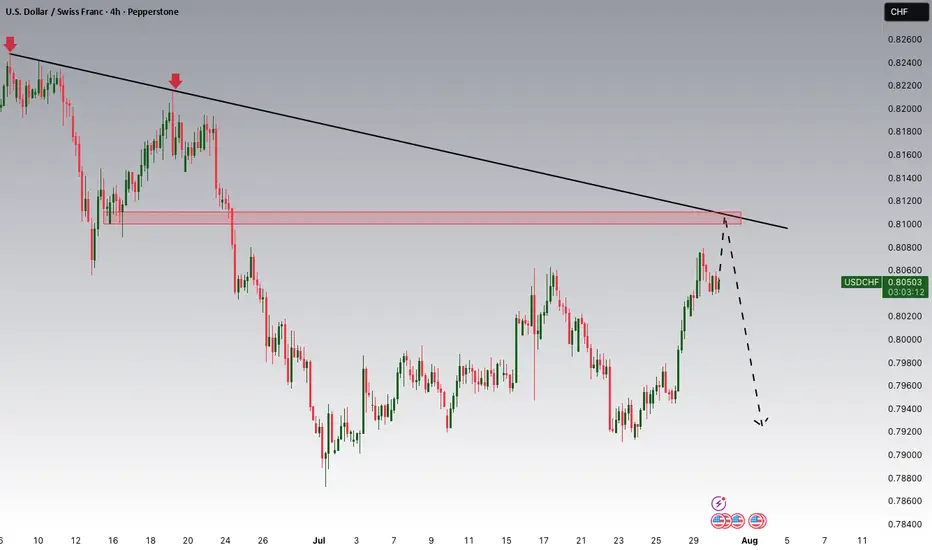
USDCHF Potential DownsidesHey Traders, in today's trading session we are monitoring USDCHF for a selling opportunity around 0.81000 zone, USDCHF is trading in a downtrend and currently is in a correction phase in which it is approaching the trend at 0.81000 support and resistance area.
Trade safe, Joe.
Bearish Patterns
USDCAD Is Bearish! Sell!
Please, check our technical outlook for USDCAD.
Time Frame: 7h
Current Trend: Bearish
Sentiment: Overbought (based on 7-period RSI)
Forecast: Bearish
The market is trading around a solid horizontal structure 1.377.
The above observations make me that the market will inevitably achieve 1.369 level.
P.S
We determine oversold/overbought condition with RSI indicator.
When it drops below 30 - the market is considered to be oversold.
When it bounces above 70 - the market is considered to be overbought.
Disclosure: I am part of Trade Nation's Influencer program and receive a monthly fee for using their TradingView charts in my analysis.
Like and subscribe and comment my ideas if you enjoy them!

USD/JPY BEARS ARE GAINING STRENGTH|SHORT
USD/JPY SIGNAL
Trade Direction: short
Entry Level: 147.871
Target Level: 145.815
Stop Loss: 149.230
RISK PROFILE
Risk level: medium
Suggested risk: 1%
Timeframe: 1D
Disclosure: I am part of Trade Nation's Influencer program and receive a monthly fee for using their TradingView charts in my analysis.
✅LIKE AND COMMENT MY IDEAS✅

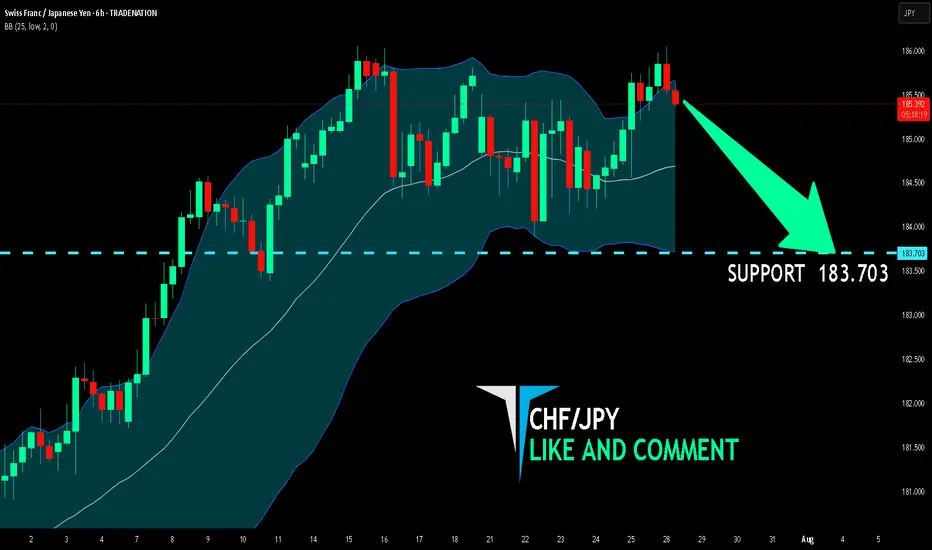
CHF/JPY BEARISH BIAS RIGHT NOW| SHORT
Hello, Friends!
The BB upper band is nearby so CHF-JPY is in the overbought territory. Thus, despite the uptrend on the 1W timeframe I think that we will see a bearish reaction from the resistance line above and a move down towards the target at around 183.703.
Disclosure: I am part of Trade Nation's Influencer program and receive a monthly fee for using their TradingView charts in my analysis.
✅LIKE AND COMMENT MY IDEAS✅
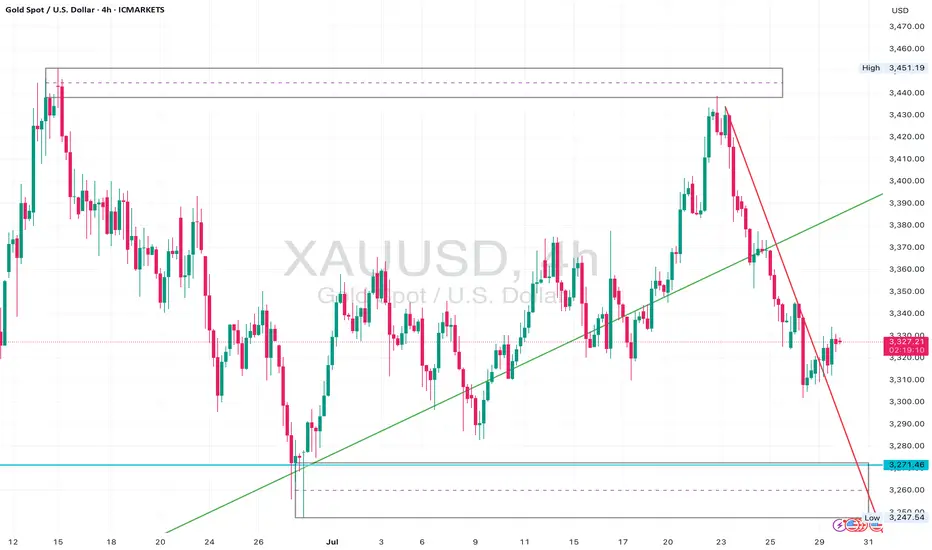
Gold Bear Flag Forming After Trendline Break – Short Setup BelowGold (XAUUSD) recently broke a major ascending trendline that had held since late June, leading to an aggressive sell-off from the $3,440s down to the $3,270 zone.
Following that, price is now consolidating just beneath the previous support trendline, forming what appears to be a bear flag or rising channel inside a corrective structure.
The $3,330–$3,340 zone is now acting as resistance, and price is struggling to close above this level.
The current structure suggests continuation to the downside, with clean space to revisit the $3,271 liquidity pool and potentially even sweep that low.
Watch for bearish confirmation below the current flag – especially if price prints a rejection wick or engulfing candle at the upper edge of the box.
⸻
Key Levels:
• Resistance: $3,330 – $3,340 (flag top + previous support turned resistance)
• Support: $3,271 zone, followed by $3,248 sweep potential
⸻
Trigger Criteria:
• Bearish rejection inside the flag (e.g. pin bar or engulfing)
• Break and retest of the flag bottom or horizontal support
⸻
Risk Note:
A clean break back above $3,350 and reclaim of the previous trendline would invalidate this idea short term and shift bias back to neutral/bullish.
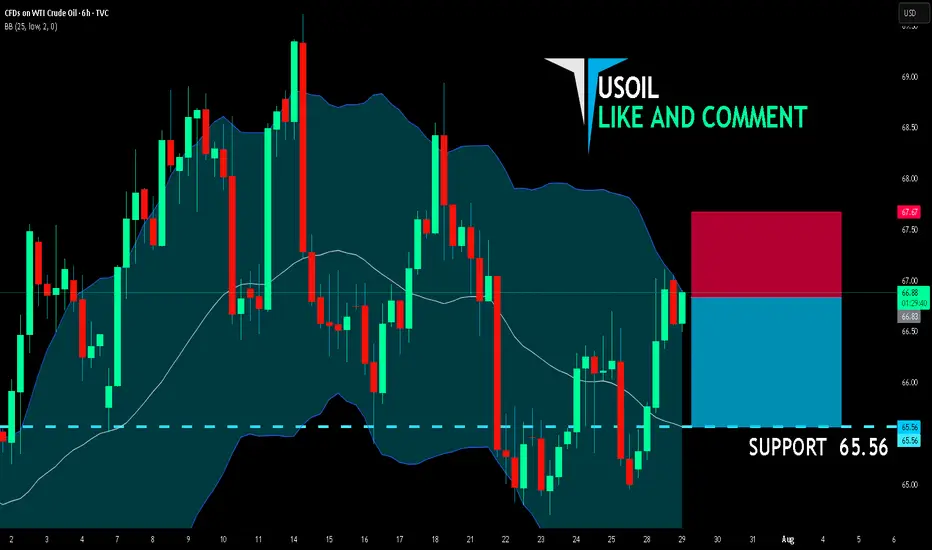
USOIL BEST PLACE TO SELL FROM|SHORT
USOIL SIGNAL
Trade Direction: short
Entry Level: 66.83
Target Level: 65.56
Stop Loss: 67.67
RISK PROFILE
Risk level: medium
Suggested risk: 1%
Timeframe: 6h
Disclosure: I am part of Trade Nation's Influencer program and receive a monthly fee for using their TradingView charts in my analysis.
✅LIKE AND COMMENT MY IDEAS✅
EUR/CAD: Shorting the Climactic Rally Near 1.6000The strong rally in EUR/CAD has pushed the pair into extreme territory, approaching a major psychological and structural resistance zone. While momentum has been strong, this looks like a potential climactic or "blow-off" top, offering a highly favorable risk/reward opportunity to short the pair in alignment with the weak underlying Euro fundamentals.
The Fundamental Why 📰
The core thesis remains bearish for the Euro. The European Central Bank (ECB) maintains a distinctly dovish tone, signaling a willingness to ease policy further to support a slowing Eurozone economy. This fundamental headwind suggests that extreme rallies in Euro pairs are often exhaustive and present prime shorting opportunities.
The Technical Picture 📊
Major Supply Zone: The price is entering a critical multi-month supply zone between 1.5950 and the key psychological level of 1.6000. This is a major ceiling where significant selling pressure is anticipated.
Fibonacci Extension: This area aligns with a key Fibonacci extension level (1.272) from the last major impulse wave, a common zone where trending moves become exhausted and reversals begin.
Pronounced RSI Divergence: A clear bearish divergence is forming on the daily chart. As price makes this final push to a new high, the Relative Strength Index (RSI) is making a significantly lower high, signaling a deep exhaustion of buying momentum.
The Counter-Trade Rationale 🧠
This is a high-level fade. We are positioning for a reversal at a major, technically significant ceiling. The extreme price extension, combined with clear momentum divergence, indicates that the risk of buying at these highs is substantial. By shorting here, we are betting that the powerful technical resistance and weak fundamentals will trigger a significant correction.
The Setup ✅
📉 Pair: EUR/CAD
👉 Direction: Short
⛔️ Stop Loss: 1.63230
🎯 Entry: 1.59490
✅ Take Profit: 1.52008
⚖️ Risk/Reward: ≈ 2:1

AUD/JPY: Fading the Rally at a Major Resistance ZoneWhile AUD/JPY has been in a clear uptrend, the rally is now approaching a significant technical ceiling where sellers have previously stepped in. We see a compelling opportunity for a counter-trend short, betting that this resistance level will hold and that the current bullish momentum is showing signs of exhaustion.
This trade is for those watching for a market turn, offering a well-defined risk-to-reward setup for a swing position.
🤔 The "Why" Behind the Short Setup
📰 The Fundamental Risk
The Australian Dollar is a "risk-on" currency, meaning it performs well when global markets are optimistic. The Japanese Yen, however, is a classic "safe-haven" asset that strengthens during times of uncertainty. With the upcoming high-impact Australian CPI data, any sign of economic weakness could disappoint the market, increase pressure on the RBA, and trigger a "risk-off" move that would benefit the Yen and send AUD/JPY lower.
📊 The Technical Ceiling
The chart tells a clear story. The price is currently testing a major resistance zone. Attempting to short near a strong ceiling like this provides a strategic entry to capture a potential trend reversal. We are essentially betting that the trend's multi-week momentum will stall and reverse from this key technical juncture.
✅ The High-Clarity SHORT Trade Setup
📉 Pair: AUD/JPY
👉 Direction: Short
⛔️ Entry: 96.716
🎯 Take Profit: 92.080
🛑 Stop Loss: 98.907
Rationale: This setup plays for a significant swing move. The wide stop loss is designed to withstand volatility from news events, while the deep take profit targets a full reversal back to major support levels seen earlier in the year.

GOLD SENDS CLEAR BEARISH SIGNALS|SHORT
GOLD SIGNAL
Trade Direction: short
Entry Level: 3,336.48
Target Level: 3,254.95
Stop Loss: 3,390.83
RISK PROFILE
Risk level: medium
Suggested risk: 1%
Timeframe: 1D
Disclosure: I am part of Trade Nation's Influencer program and receive a monthly fee for using their TradingView charts in my analysis.
✅LIKE AND COMMENT MY IDEAS✅

AUD/CAD SELLERS WILL DOMINATE THE MARKET|SHORT
Hello, Friends!
We are now examining the AUD/CAD pair and we can see that the pair is going up locally while also being in a uptrend on the 1W TF. But there is also a powerful signal from the BB upper band being nearby, indicating that the pair is overbought so we can go short from the resistance line above and a target at 0.885 level.
Disclosure: I am part of Trade Nation's Influencer program and receive a monthly fee for using their TradingView charts in my analysis.
✅LIKE AND COMMENT MY IDEAS✅

GBP/USD: Following the Bearish Trend to a Key LevelSharing my perspective on a potential short setup in GBP/USD.
This view is based on a combination of weakening UK fundamentals and a clear bearish technical structure.
📰 The Fundamental View
The main driver here is the growing difference in monetary policy. The Bank of England is signaling a more dovish stance due to recent soft economic data out of the UK. In contrast, the US economy is showing more resilience, which may keep the Federal Reserve on a less aggressive easing path. This fundamental divergence puts downward pressure on the Pound versus the Dollar.
📊 The Technical Picture
The chart supports this bearish bias. We can see a clear downtrend in place, defined by a series of lower highs and lower lows. Price is currently trading below its key moving averages, which often act as dynamic resistance. The critical level to watch is the 1.34377 price zone, which was a previous area of support and could now be tested as resistance.
🎯 The Strategy
The plan is to watch for bearish price action as we approach the 1.34377 key level. A rejection from this zone would provide a good opportunity to enter a short position, aiming to ride the next leg of the established downtrend.
As always, this is my own perspective. Manage your risk carefully and trade safe.

EURUSD: A Bearish Continuation?From my previous analysis, we anticipated a short-term decline on the EURUSD for a Daily bearish pullback. Price respected our zone and made a even stronger sweep before plummeting as forecasted.
Currently, price has returned to mitigate that liquidity sweep. Given the prior impulsive bearish move—which this current bullish correction stems from—we expect another drop, targeting the weak structure below for a potential liquidity grab or continuation.
We'll continue to monitor how price behaves around the current levels, but unless there's a significant shift in momentum, our bearish outlook remains valid. ✅
Follow us for more updates. 🔔
See you on the next one. 🫡

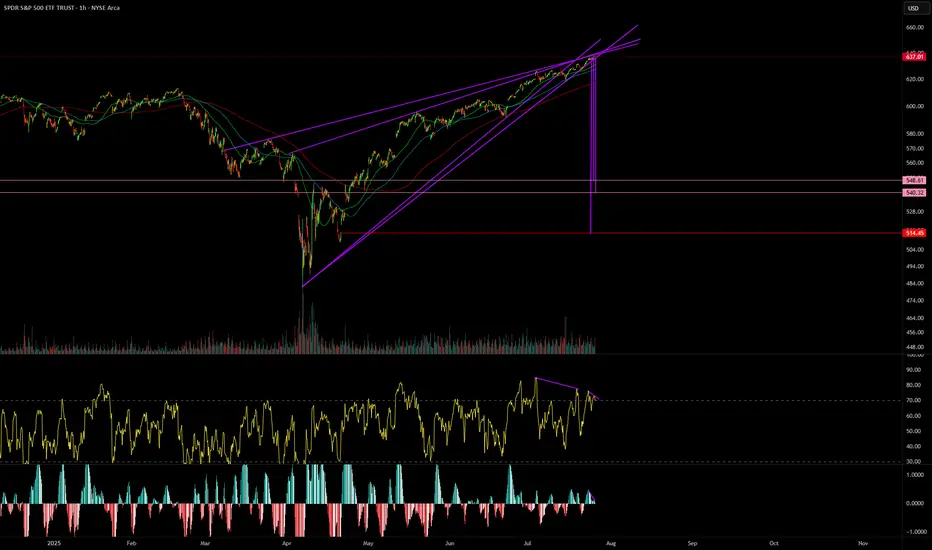
SPY Imagine the SmellImagine the smell from the Bulls if the $514 gap is filled.
Bearish divergence galore.
Not a matter of if this wedge breaks.
Its when.
GBPUSD SHORTSPrice closed the week bearish. There’s a daily head and shoulders pattern as well. Looking for price to continue bearish towards daily support. I’d like for price to retrace and create a LH before looking to get back into shorts.

CAD/JPY BEARS WILL DOMINATE THE MARKET|SHORT
Hello, Friends!
CAD-JPY uptrend evident from the last 1W green candle makes short trades more risky, but the current set-up targeting 106.478 area still presents a good opportunity for us to sell the pair because the resistance line is nearby and the BB upper band is close which indicates the overbought state of the CAD/JPY pair.
Disclosure: I am part of Trade Nation's Influencer program and receive a monthly fee for using their TradingView charts in my analysis.
✅LIKE AND COMMENT MY IDEAS✅

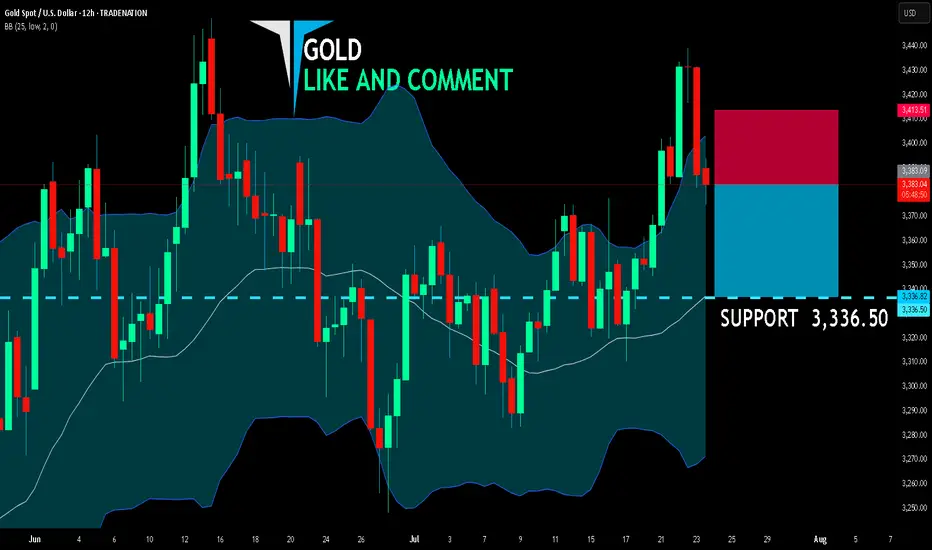
GOLD BEARS ARE STRONG HERE|SHORT
GOLD SIGNAL
Trade Direction: short
Entry Level: 3,383.09
Target Level: 3,336.50
Stop Loss: 3,413.51
RISK PROFILE
Risk level: medium
Suggested risk: 1%
Timeframe: 12h
Disclosure: I am part of Trade Nation's Influencer program and receive a monthly fee for using their TradingView charts in my analysis.
✅LIKE AND COMMENT MY IDEAS✅
EURUSD | Time For A Pullback?The week kicked off with strong impulsive moves to the upside, leaving no room for deeper correction. Then slowly from Wednesday, we started to see a decline in strength in the bullish run.
Now, with price edging toward the next swing low for a possible bearish change of character, is this a good way to ride the stream to the downside?
Keep your A-game on as we watch price unfold, and trade reactively to price movement.
Do not forget to guard your capitals with risk management.
Good luck traders. 👍
Follow me for more and more of these analyses.
See you on the next one. 🫡

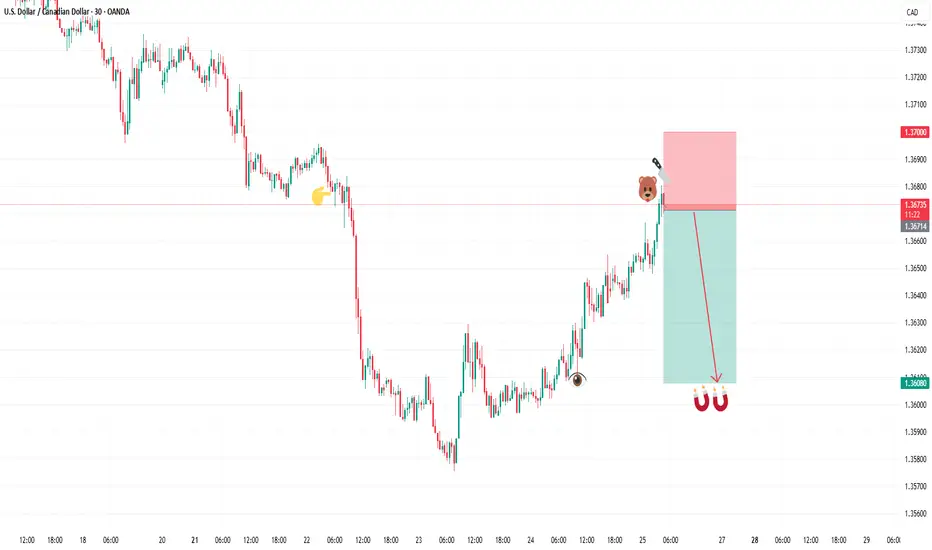
SELL USDCADIn todays session we are monitoring USDCAD for selling opportunities, we have our first entry at 1.36719 and our target is 1.36080 our stop is above 1.3700 , use proper risk management and risk what you can afford. Cheers fam.
What's Next On EURUSDPrice currently leans toward a bearish pullback after a series of impulsive bullish moves. So far, we haven’t seen any significant retracement since the rally began. As we anticipate a potential correction, could this be the awaited moment for the bears to step in—especially with only weaker structures left behind and bearish pressure building?
Regardless, every market scenario demands discipline and proper risk management.
Thinking of taking this outlook? Be sure to wait for strong confirmation before jumping in.
Good luck, traders, as we watch price unfold.
👉 Follow for more updates. See you in the next one 😉.

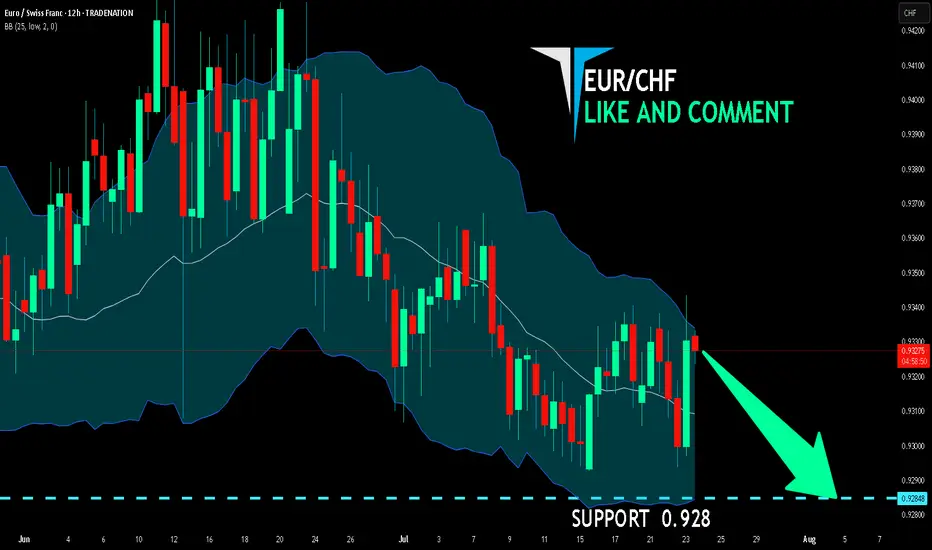
EUR/CHF BEARS WILL DOMINATE THE MARKET|SHORT
Hello, Friends!
EUR/CHF is making a bullish rebound on the 12H TF and is nearing the resistance line above while we are generally bearish biased on the pair due to our previous 1W candle analysis, thus making a trend-following short a good option for us with the target being the 0.928 level.
Disclosure: I am part of Trade Nation's Influencer program and receive a monthly fee for using their TradingView charts in my analysis.
✅LIKE AND COMMENT MY IDEAS✅
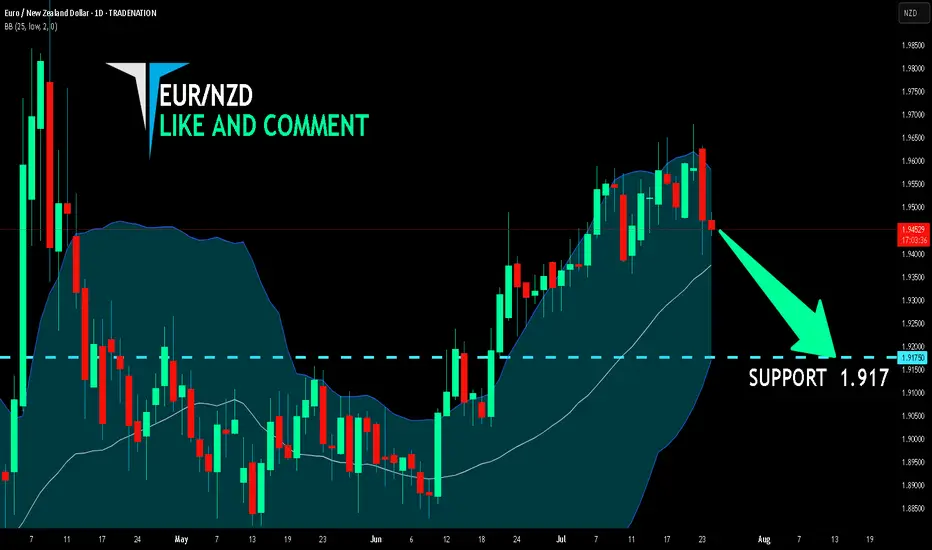
EUR/NZD SENDS CLEAR BEARISH SIGNALS|SHORT
Hello, Friends!
The BB upper band is nearby so EUR-NZD is in the overbought territory. Thus, despite the uptrend on the 1W timeframe I think that we will see a bearish reaction from the resistance line above and a move down towards the target at around 1.917.
Disclosure: I am part of Trade Nation's Influencer program and receive a monthly fee for using their TradingView charts in my analysis.
✅LIKE AND COMMENT MY IDEAS✅
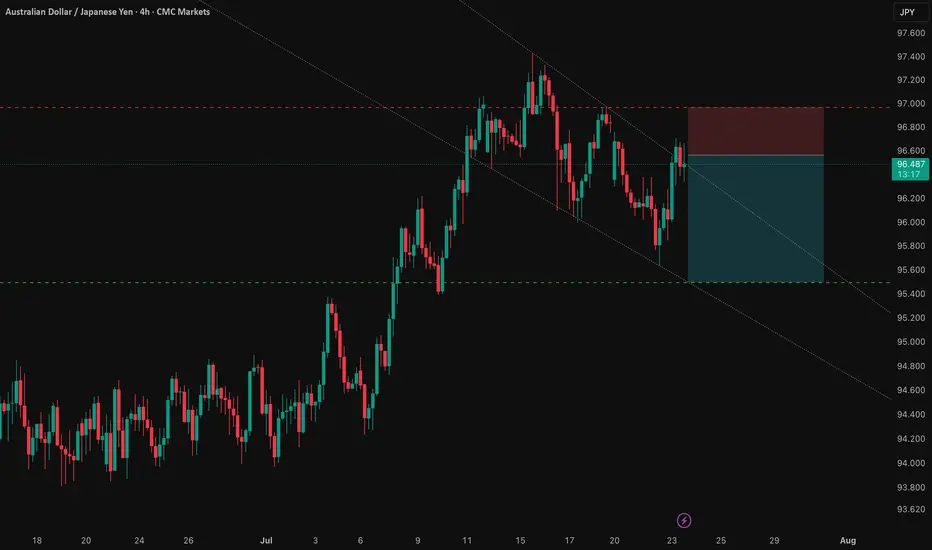
AUD/JPY: Capitalizing on the RBA-BoJ Monetary Policy GapThis analysis outlines a compelling short opportunity in AUD/JPY, driven by a powerful confluence of fundamental and technical factors. The trade is strategically positioned ahead of a key catalyst that could unlock significant downside potential.
1️⃣ The Core Thesis: A Clear Policy Divergence
The primary driver behind this trade is the stark and widening gap in monetary policy between the Reserve Bank of Australia (RBA) and the Bank of Japan (BoJ). The RBA is signaling a clear dovish pivot amid a weakening labor market, making an interest rate cut imminent. Conversely, the BoJ is in a tightening phase, creating a fundamental headwind for the AUD relative to the JPY. This divergence underpins the strategic bearish bias.
2️⃣ The Confirmation: Technical Alignment
This fundamental view is supported by a clear technical picture. The pair is in a well-defined downtrend and is currently testing a critical support level. This alignment of fundamental and technical factors presents a clear short opportunity, with the entry positioned for a breakdown below this key juncture.
3️⃣ The Catalyst: The RBA Bulletin
The immediate catalyst for this trade is the upcoming RBA Bulletin on July 24, 2025. Any dovish language from the RBA concerning Australia's economic outlook will likely reinforce expectations for a rate cut and accelerate the downward move in AUD/JPY.
The Trade Setup ✅
Here is the recommended trade setup:
📉 Trade: SHORT AUD/JPY
👉 Entry: 96.56200
⛔️ Stop Loss: 96.96386
🎯 Take Profit: 95.49900
🧠 Risk/Reward Ratio: 2.65
This setup offers a compelling risk-reward profile, capitalizing on a clear and powerful macroeconomic theme. The trade is designed to perform should the expected catalyst confirm the underlying bearish fundamentals.
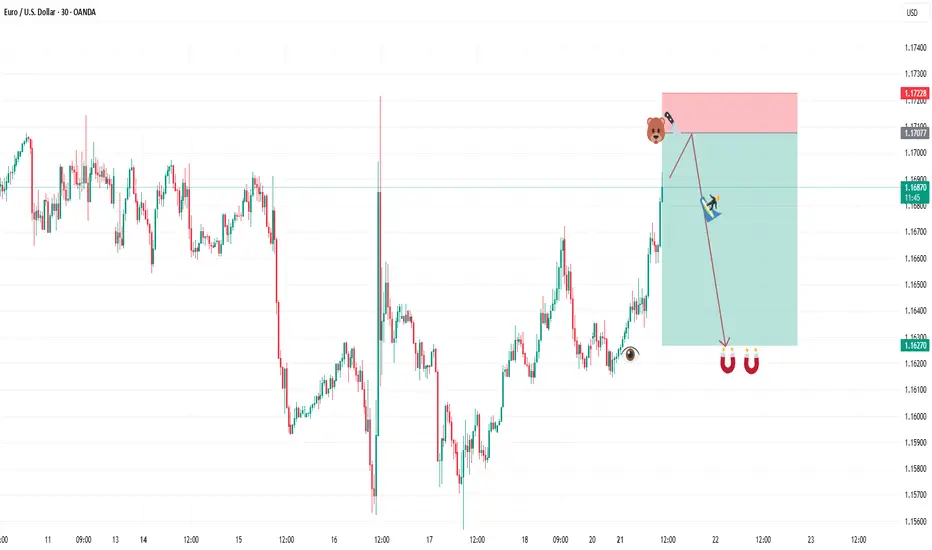
SELL EURUSDAfter todays buys hitting our target we are shifting to a sell play. Our entry is at 1.16878 and second entry at 1.17077. Our stop loss is at 1.17228 and target is at 1.16270. Use proper risk management and best of luck. Algounlocked