USDNOK Completes A Corrective RecoveryUSDNOK Completes A Corrective Recovery that can resume its bearish trend from a technical point of view and from Elliott wave perspective.
USDNOK made some recovery recently, but in three legs only, which indicates for a correction within the downtrend by Elliott wave theory, called a zig-zag. It stopped perfectly at equal wavelength of waves (A)=(C) and at the channel resistance line, so bears can be back, especially if it breaks below 10.0 level.
A zig-zag correction within a bearish trend is a temporary upward retracement that moves against the main downtrend. It follows the A-B-C (5-3-5) structure, where waves A and C are impulsive bullish moves, while wave B is a smaller bearish correction between them. It represents a sharp countertrend rally within a larger bearish cycle, after which the main downtrend typically resumes.
Bearish Patterns

XRPUSD Bullish/Bearish ScenarioMY XRP brain storm for this crucial point in the market. It really is sitting at a critical point and the next move decides direction. He are the possibilities.

SELL GOLDIn todays session we are monitoring GOLD for selling ooportunity. Entry at 4200 stops above 4220 and target at 4130. Use proper risk management.

GOLD SELLERS WILL DOMINATE THE MARKET|SHORT
GOLD SIGNAL
Trade Direction: short
Entry Level: 4,193.33
Target Level: 4,093.81
Stop Loss: 4,259.20
RISK PROFILE
Risk level: medium
Suggested risk: 1%
Timeframe: 1h
Disclosure: I am part of Trade Nation's Influencer program and receive a monthly fee for using their TradingView charts in my analysis.
✅LIKE AND COMMENT MY IDEAS✅

USD/CAD: Bearish Loonie SlideUSD/CAD: Bearish Loonie Slide Amid #Fed Cut Hype and #Forex Volatility Buzz? 1.39 Breakout Target in Sight?
USD/CAD is trading at 1.3795 today, up 0.17% amid a rebound from 1.3728 lows as markets eye the Fed's rate decision later, with 65% odds of a 50bps cut to 4.00-4.25% pressuring the dollar but offset by BoC's own easing signals.
This follows a 0.25% CAD gain earlier in the week on CPI data, but the pair remains range-bound with analysts forecasting a bearish tilt to 1.35 by year-end if Fed cuts deepen.
Just as #Fed surges with 15K mentions on X amid rate speculation, and #Forex trends spotlight policy divergence (e.g., BoC vs. Fed easing), USD/CAD's sensitivity to oil and CAD vulnerability position it for choppy action in the $1.8T daily forex market.
But with volatility at 3.88%, is USD/CAD undervalued for a bull run to 1.39, or will dovish Fed trigger a CAD rebound? Let's break down the fundamentals, SWOT, charts, and setups for September 18, 2025.
Fundamental Analysis
USD/CAD's trajectory hinges on diverging central bank paths, with the BoC's recent cuts weakening the loonie while Fed easing caps USD upside—yet oil prices above $70/bbl support CAD via Canada's export reliance.
Analysts project a 2025 average of 1.35, bearish on CAD amid #Fed cuts, but short-term resistance at 1.3800 could hold if US data softens. With #Forex volatility buzzing, the pair's undervaluation shines in a risk-on environment if Fed delivers 50bps, but sticky US inflation (2.6% core) risks a hawkish pivot.
- **Positive:**
- BoC easing and CAD vulnerability amid #Forex hype project USD strength to 1.3863 if Fed holds steady.
- Oil tailwinds and EM inflows (e.g., SA bonds) bolster CAD floors, undervaluing the pair at current levels vs. 1.40 peaks.
- Broader #Fed trends favor USD if dot plot signals fewer cuts, eyeing 0.5% monthly gains.
- **Negative:**
- Dovish Fed expectations weaken USD, clashing with #Fed optimism if 50bps cut confirms CAD rebound.
- Canada CPI resilience (2.0% YoY) could strengthen CAD if BoC pauses, pressuring the pair lower.
SWOT Analysis
**Strengths:** Policy divergence favors USD with Fed's relative hawkishness vs. BoC, amplified by #Fed relevance in dollar sentiment.
**Weaknesses:** High oil correlation exposes CAD upside; overbought momentum vulnerable in #Forex-shifting markets post-Fed.
**Opportunities:** Fed cut confirmation narrows spreads, with undervalued bull potential to 1.3891 amid #Fed boom.
**Threats:** Hawkish BoC surprises eroding gains; competition from AUD/CAD if commodity trends capitalize on #Forex volatility.
Technical Analysis
On the daily chart, USD/CAD rebounds in an ascending channel from 1.3728 support, with a pivot at 1.3800 mirroring #Fed volatility spikes. The weekly shows neutral bias with 1.3889 as key breakout. Current price: 1.3795, with VWAP at 1.3770 as intraday balance.
Key indicators:
- **RSI (14-day):** At 55, neutral—potential bull signal amid #Fed surge. 📈
- **MACD:** Histogram positive, crossover holding for upside.
- **Moving Averages:** Price above 21-day EMA (1.3750) but testing 50-day SMA (1.3820)—bullish if holds.
Support/Resistance: Support at 1.3728 (recent low), resistance at 1.3863 and 1.3891. Patterns/Momentum: Channel bounce targets 1.3863; fueled by #Forex momentum. 🟢 Bullish signals: Higher lows on volume. 🔴 Bearish risks: Failure at 1.3800 eyes 1.36.
Scenarios and Risk Management
- **Bullish Scenario:** Break above 1.3863 on hawkish Fed targets 1.3891; long on pullbacks to 1.3728, especially if #Fed signals fewer cuts.
- **Bearish Scenario:** Drop below 1.3728 eyes 1.3538; watch for CAD cross amid #Forex fade on dovish pivot.
- **Neutral/Goldilocks:** Range-bound 1.3728–1.3863 if dot plot mixed and #Fed cools.
Risk Tips: Use stops at 1.3700. Risk 1-2% per trade. Diversify to avoid correlation traps with #Fed-linked pairs like EUR/USD.
Conclusion/Outlook
Overall, a bullish bias if USD/CAD holds 1.3728, supercharged by today's #Fed and #Forex trends, with 0.7% upside to 1.39 on policy divergence. But watch the Fed outcome for confirmation—this fits September's rate volatility theme amid easing hype.
What’s your take? Bullish on USD/CAD amid #Fed cuts or fading the loonie? Share in the comments!

GBP/USD BEST PLACE TO SELL FROM|SHORT
Hello, Friends!
It makes sense for us to go short on GBP/USD right now from the resistance line above with the target of 1.324 because of the confluence of the two strong factors which are the general downtrend on the previous 1W candle and the overbought situation on the lower TF determined by it’s proximity to the upper BB band.
Disclosure: I am part of Trade Nation's Influencer program and receive a monthly fee for using their TradingView charts in my analysis.
✅LIKE AND COMMENT MY IDEAS✅

EUR/USD BEARS ARE STRONG HERE|SHORT
Hello, Friends!
Previous week’s green candle means that for us the EUR/USD pair is in the uptrend. And the current movement leg was also up but the resistance line will be hit soon and upper BB band proximity will signal an overbought condition so we will go for a counter-trend short trade with the target being at 1.157.
Disclosure: I am part of Trade Nation's Influencer program and receive a monthly fee for using their TradingView charts in my analysis.
✅LIKE AND COMMENT MY IDEAS✅

SELL XAUUSDIn todays session and next few days we are monitoring gold for sell set ups. Our entry at current price 4070 and stops above 4120. Target is 3870. Tight stops just incase. Use proper risk management.

Bitcoin is going to the hell???hi follow me , boost this post and read
everything shows me that bull trend is over , weakness in highs , candles and the momentum
the targets for retracement is 83 to 74 and after that 50k
i know its hard to hear that but this is market he do what he wants so accept it.
thank you. i reply to questions anytime.

13/10/25 Weekly OutlookLast weeks high: $126,237.39
Last weeks low: $102,038.44
Midpoint: $114,137.92
Well that was an interesting week... A small reminder that when Trump talks about tariffs the markets move, and move fast!
From All-Time-High at the beginning of the week to a -19.2% move, a single hourly candle had -10.56% drawdown alone!
What can be learnt from this? Despite all the technical analysis in the world, if the President of the United States makes an announcement it can shift the market greatly causing a leverage unwind via liquidations that cascade aggressively. Although these large scale crashes are rare, they are inevitable in this market and this will not be the last of its kind.
This week will be very interesting because generally we do see a lot of backfilling the wick which would mean revisiting the key S/R level at 0.25 ($108,000). The bulls would not want to see price acceptance under this level or IMO this is the beginning of a bearish shift in HTF structure. This potential shift in structure would also line up with the 4 year cycle theory as October marks the end of the bull market.
On the other hand, the bounce from the low has been strong, although still some way off the origin of the dump a lot of ground has been recovered. In the past these liquidation events have marked local lows in the market and serve as a launchpad for the next leg up. I do think it's too early to tell if that is the case this time around, I am in no rush to position either way until at least Mondays range is established.
The altcoin market took a far worse turn, majors sinking as much as 80% in a single move! This week will be important to learn what projects are truly supported/fundamentally sound by how they recover.
Projects such as: ZEC, TAO, ANYONE and BNB have all closed higher than their original price before the crash, other projects may never recover.
Good luck this week everybody!

SILVER SELLERS WILL DOMINATE THE MARKET|SHORT
SILVER SIGNAL
Trade Direction: short
Entry Level: 5,140.8
Target Level: 5,029.5
Stop Loss: 5,214.4
RISK PROFILE
Risk level: medium
Suggested risk: 1%
Timeframe: 1h
Disclosure: I am part of Trade Nation's Influencer program and receive a monthly fee for using their TradingView charts in my analysis.
✅LIKE AND COMMENT MY IDEAS✅

EUR/CHF BEARISH BIAS RIGHT NOW| SHORT
Hello, Friends!
EUR/CHF pair is in the downtrend because previous week’s candle is red, while the price is obviously rising on the 2H timeframe. And after the retest of the resistance line above I believe we will see a move down towards the target below at 0.931 because the pair is overbought due to its proximity to the upper BB band and a bearish correction is likely.
Disclosure: I am part of Trade Nation's Influencer program and receive a monthly fee for using their TradingView charts in my analysis.
✅LIKE AND COMMENT MY IDEAS✅

GBP/CHF SELLERS WILL DOMINATE THE MARKET|SHORT
Hello, Friends!
GBP/CHF is trending down which is evident from the red colour of the previous weekly candle. However, the price has locally surged into the overbought territory. Which can be told from its proximity to the BB upper band. Which presents a beautiful trend following opportunity for a short trade from the resistance line above towards the demand level of 1.069.
Disclosure: I am part of Trade Nation's Influencer program and receive a monthly fee for using their TradingView charts in my analysis.
✅LIKE AND COMMENT MY IDEAS✅

USOIL LONG FROM SUPPORT
USOIL SIGNAL
Trade Direction: long
Entry Level: 58.26
Target Level: 60.45
Stop Loss: 56.80
RISK PROFILE
Risk level: medium
Suggested risk: 1%
Timeframe: 1h
Disclosure: I am part of Trade Nation's Influencer program and receive a monthly fee for using their TradingView charts in my analysis.
✅LIKE AND COMMENT MY IDEAS✅

CHF/JPY BEARS WILL DOMINATE THE MARKET|SHORT
Hello, Friends!
We are now examining the CHF/JPY pair and we can see that the pair is going up locally while also being in a uptrend on the 1W TF. But there is also a powerful signal from the BB upper band being nearby, indicating that the pair is overbought so we can go short from the resistance line above and a target at 186.069 level.
Disclosure: I am part of Trade Nation's Influencer program and receive a monthly fee for using their TradingView charts in my analysis.
✅LIKE AND COMMENT MY IDEAS✅

GBP/CAD BEARS ARE GAINING STRENGTH|SHORT
Hello, Friends!
The BB upper band is nearby so GBP-CAD is in the overbought territory. Thus, despite the uptrend on the 1W timeframe I think that we will see a bearish reaction from the resistance line above and a move down towards the target at around 1.864.
Disclosure: I am part of Trade Nation's Influencer program and receive a monthly fee for using their TradingView charts in my analysis.
✅LIKE AND COMMENT MY IDEAS✅

Bear market has startedThe End of the Bull Cycle. Why I'm Selling Everything and Won't Buy Again Until September 2026.
For the last year and a half, I have said that we are in a bull market. I never once changed my opinion. But all things come to an end. The time has come.
September 13, 2025, the date I have been mentioning across my social media, was, in my opinion, the peak of this market cycle. As painful as it may sound, the bull market is over.
"Altseason" is a Scam. It's Time to Grow Up
Let's be honest. The "altseason" that everyone was dreaming of never happened. Yes, there were pumps on selective, mostly new coins. But the old guard, for the most part, showed nothing.
Therefore, I want to officially declare: I will never use the word "altseason" again. It's a meme from 2017. There are now over a million coins on the market. Liquidity is so diluted that pumping everything is impossible. Instead of "altseason," we have, and always will have, "selective pumps" driven by interested players. Our job is to learn how to find them, not to wait for a mythical wave that will lift all boats.
Why Now? The Classic Signs of a Top
I wouldn't be so certain if I didn't see the classic signs of euphoria that always appear at the top of a cycle:
- Universal Optimism: Governments are embracing crypto, creating reserve funds.
-Corporate Buying: Public companies are massively buying Bitcoin and Ethereum.
-Positive News: The media is filled with only positive news; no one wants to sell and is waiting for $200k, $300k, $500k.
When the crowd rushes into the market, smart money begins to exit. I prefer to be with the latter.
My Personal 2-Year Plan. Maximum Transparency
I'm not just saying the market will fall. I am publicly sharing my plan of action:
1. I am exiting the market into stablecoins NOW. I am locking in my profits.
2. I will NOT be buying the first correction. When Bitcoin drops to $90,000, most people will be buying, thinking it's a discount. I will not.
3. I plan to start actively buying again in September 2026.
Why so long? Because those who buy at the $90-100k mark risk sitting through two years of psychological and financial drawdown just to break even. I am not willing to pay that price. I won't disconnect from the market; I'll keep my finger on the pulse, but I don't plan on making any active buys.
Cycles Work. My Technical Rationale
My decision is not based on emotion but on cycle theory, which I have tested for years. The cycle consists of ~151 weeks of growth and ~51 weeks of decline. We have just completed the growth phase. The period between September 13 and October 6 is the exact reversal zone after which a decline should begin.
I could be wrong. No one can be right all the time. Perhaps the cycle theory will break this time. But I trust my system.
Conclusion: What's Next? The Long-Term View
I have not become a bear forever. I believe Bitcoin will hit $300,000. But not in the coming months. It will be worth that in 2.5 years, after a healthy 50-60% correction from the peak.
From this moment on, my bias is bearish. On strong upward bounces, I might even open short positions. A new game is beginning, with new rules. My job is to preserve my capital and multiply it in the next cycle. What about yours?
Why bear market started now Proofs:
Best regards EXCAVO

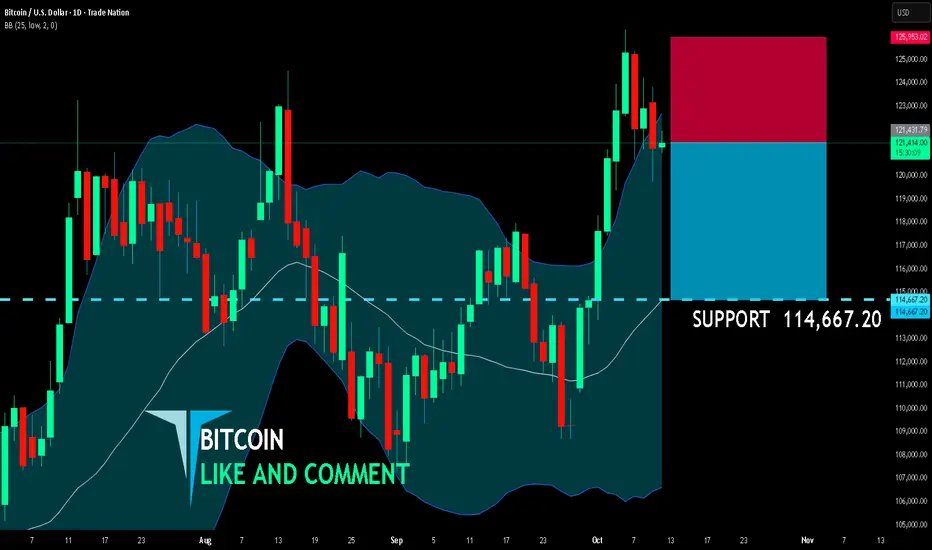
BITCOIN SENDS CLEAR BEARISH SIGNALS|SHORT
BITCOIN SIGNAL
Trade Direction: short
Entry Level: 121,431.79
Target Level: 114,667.20
Stop Loss: 125,953.02
RISK PROFILE
Risk level: medium
Suggested risk: 1%
Timeframe: 1D
Disclosure: I am part of Trade Nation's Influencer program and receive a monthly fee for using their TradingView charts in my analysis.
✅LIKE AND COMMENT MY IDEAS✅
GOLD BEST PLACE TO SELL FROM|SHORT
GOLD SIGNAL
Trade Direction: short
Entry Level: 4,035.38
Target Level: 3,914.49
Stop Loss: 4,115.72
RISK PROFILE
Risk level: medium
Suggested risk: 1%
Timeframe: 6h
Disclosure: I am part of Trade Nation's Influencer program and receive a monthly fee for using their TradingView charts in my analysis.
✅LIKE AND COMMENT MY IDEAS✅

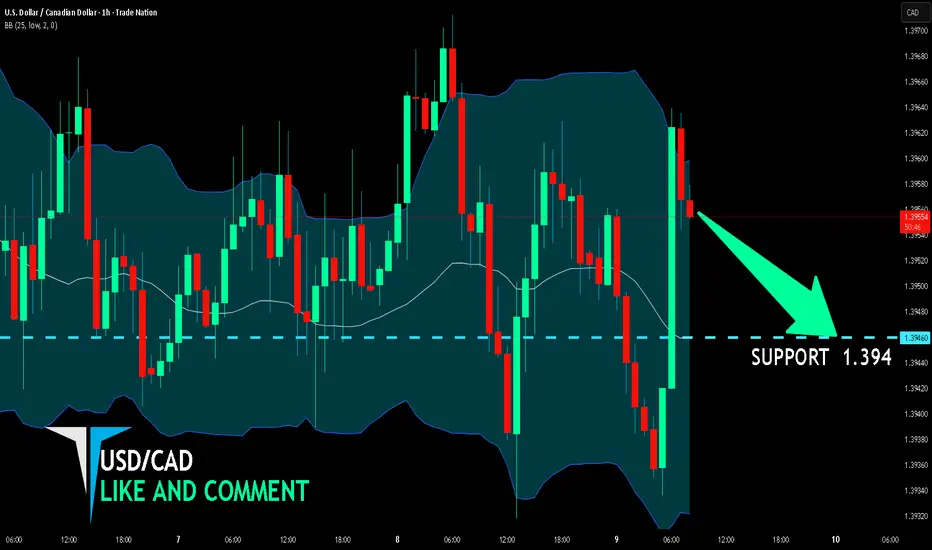
USD/CAD BEARS WILL DOMINATE THE MARKET|SHORT
Hello, Friends!
We are going short on the USD/CAD with the target of 1.394 level, because the pair is overbought and will soon hit the resistance line above. We deduced the overbought condition from the price being near to the upper BB band. However, we should use low risk here because the 1W TF is green and gives us a counter-signal.
Disclosure: I am part of Trade Nation's Influencer program and receive a monthly fee for using their TradingView charts in my analysis.
✅LIKE AND COMMENT MY IDEAS✅
GBP/AUD BEARS ARE STRONG HERE|SHORT
Hello, Friends!
We are going short on the GBP/AUD with the target of 2.029 level, because the pair is overbought and will soon hit the resistance line above. We deduced the overbought condition from the price being near to the upper BB band. However, we should use low risk here because the 1W TF is green and gives us a counter-signal.
Disclosure: I am part of Trade Nation's Influencer program and receive a monthly fee for using their TradingView charts in my analysis.
✅LIKE AND COMMENT MY IDEAS✅

GBP/CAD SELLERS WILL DOMINATE THE MARKET|SHORT
Hello, Friends!
GBP/CAD pair is in the uptrend because previous week’s candle is green, while the price is obviously rising on the 12H timeframe. And after the retest of the resistance line above I believe we will see a move down towards the target below at 1.867 because the pair overbought due to its proximity to the upper BB band and a bearish correction is likely.
Disclosure: I am part of Trade Nation's Influencer program and receive a monthly fee for using their TradingView charts in my analysis.
✅LIKE AND COMMENT MY IDEAS✅

USOIL SENDS CLEAR BEARISH SIGNALS|SHORT
USOIL SIGNAL
Trade Direction: short
Entry Level: 62.52
Target Level: 60.15
Stop Loss: 64.10
RISK PROFILE
Risk level: medium
Suggested risk: 1%
Timeframe: 7h
Disclosure: I am part of Trade Nation's Influencer program and receive a monthly fee for using their TradingView charts in my analysis.
✅LIKE AND COMMENT MY IDEAS✅
