BTC Bearish Scenario This idea is comes from a place purely of pattern recognition, I believe BTC still has more to give this cycle but I have noticed similarities between the "Trump pump" top and the most recent top/ price action:
Both tops feature a wick into the diagonal resistance, followed by a slightly larger wick making a new high before selling off.
After the highs in January BTC sold off back towards the trend support level, could BTC follow this pattern this time around too? So far they are tracking very closely, the beginning of November would be the bottom at trend channel support if this was to play out.
For me $108,000 is the key S/R level in this idea, a break below it would definitely open Bitcoin to the possibility, all the time price stays above it does look significantly stronger.
Bearish Patterns

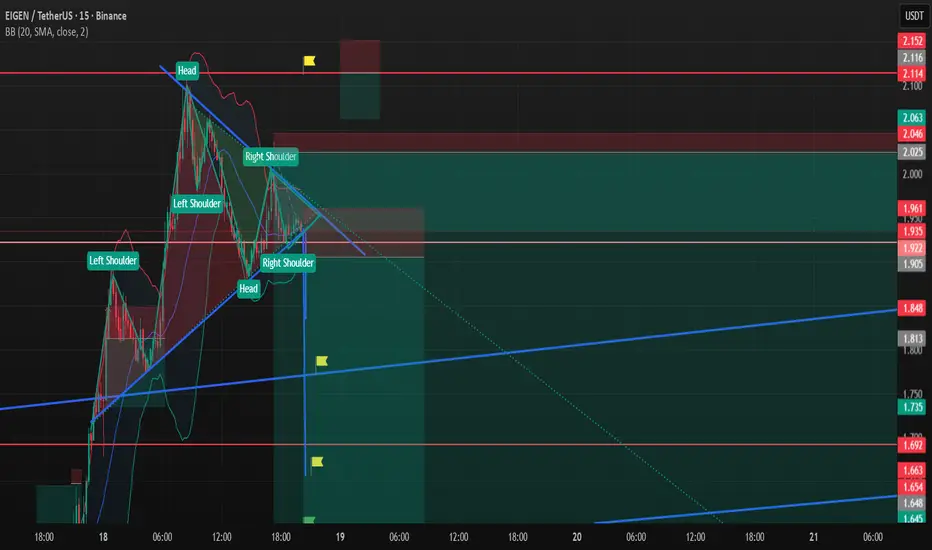
Eigen Short SetupI couldnt publish targets for the last idea it was in rush here I am for the second chart of the same position and also I added a new short position you can follow if you couldnt catch
There is both bullish and bearish head and shoulder formation I assume bearish version will work
Always manage your own risks this is not a investment advise I am not responsible neither your loss nor profit.
Targets
TP1 Blue trendline
TP2 1.658
TP3 1.590
GOLD SELLERS WILL DOMINATE THE MARKET|SHORT
GOLD SIGNAL
Trade Direction: short
Entry Level: 3,698.25
Target Level: 3,667.27
Stop Loss: 3,718.92
RISK PROFILE
Risk level: medium
Suggested risk: 1%
Timeframe: 1h
Disclosure: I am part of Trade Nation's Influencer program and receive a monthly fee for using their TradingView charts in my analysis.
✅LIKE AND COMMENT MY IDEAS✅

AUD/NZD BEST PLACE TO SELL FROM|SHORT
Hello, Friends!
Previous week’s green candle means that for us the AUD/NZD pair is in the uptrend. And the current movement leg was also up but the resistance line will be hit soon and upper BB band proximity will signal an overbought condition so we will go for a counter-trend short trade with the target being at 1.118.
Disclosure: I am part of Trade Nation's Influencer program and receive a monthly fee for using their TradingView charts in my analysis.
✅LIKE AND COMMENT MY IDEAS✅

CAD/CHF BEARS ARE STRONG HERE|SHORT
Hello, Friends!
CAD/CHF is trending down which is obvious from the red colour of the previous weekly candle. However, the price has locally surged into the overbought territory. Which can be told from its proximity to the BB upper band. Which presents a great trend following opportunity for a short trade from the resistance line above towards the demand level of 0.570.
Disclosure: I am part of Trade Nation's Influencer program and receive a monthly fee for using their TradingView charts in my analysis.
✅LIKE AND COMMENT MY IDEAS✅

USDJPY Ultimate Price Action Analysis:📊 USDJPY Forecast 🔮💹 (147.961) Closing 20th Sept 2025 | 12:50 AM UTC+4
🕵️♂️ Market Snapshot
USDJPY closed at 147.961, showing mixed signals as bulls attempt to hold ground near critical levels while sellers eye a potential reversal. ⚖️
🏦 Technical Framework
🔹 Chart Patterns
📈 Possible Elliott Wave 5th leg exhaustion near 148.5–149.2.
🌀 Harmonic PRZ forming around 149.0.
🏯 Ichimoku Cloud shows resistance overhead, baseline support at 147.3.
⚠️ Watch for bull trap if price fails 148.2.
🔹 Indicators
RSI 📊: 62 → mild overbought.
BB 🔔: Price hugging upper band = volatility spike.
MA Cross 🔀: Golden cross intact, but momentum flattening.
VWAP ⚡: Anchored VWAP = 147.6 → strong pivot.
🕐 Intraday Outlook
Buy Zone 💵: 147.40 – 147.60 (support + VWAP confluence).
Sell Zone 💸: 148.50 – 148.80 (resistance + harmonic).
Take Profit 🎯:
Longs → 148.20 / 148.50
Shorts → 147.10 / 146.80
Stop Loss 🛑:
Longs < 147.20
Shorts > 149.00
⏳ Swing Trading Outlook
Bullish Scenario 🐂: Break & close above 149.20 → next target 150.50 – 151.20.
Bearish Scenario 🐻: Close below 146.80 → correction toward 145.40 – 144.70.
📌 Key Levels
Resistance: 148.20 / 148.80 / 149.20
Support: 147.40 / 146.80 / 145.40
🎯 Strategy Summary
✅ Intraday: Buy dips near support, sell rallies near resistance.
✅ Swing: Watch 149.20 breakout or 146.80 breakdown for larger moves.
⚡ Volatility expected → trade with strict risk control.
🌍 Market Context
Fed & BoJ policy divergence remains key.
Geopolitical jitters in Asia could trigger safe-haven flows → boosting JPY demand.
🔥 Trade Smart | Manage Risk | Respect Levels 🔥
For individuals seeking to enhance their trading abilities based on the analyses provided, I recommend exploring the mentoring program offered by Shunya Trade. (Website: shunya dot trade)
I would appreciate your feedback on this analysis, as it will serve as a valuable resource for future endeavors.
Sincerely,
Shunya.Trade
Website: shunya dot trade
⚠️Disclaimer: This post is intended solely for educational purposes and does not constitute investment advice, financial advice, or trading recommendations. The views expressed herein are derived from technical analysis and are shared for informational purposes only. The stock market inherently carries risks, including the potential for capital loss. Therefore, readers are strongly advised to exercise prudent judgment before making any investment decisions. We assume no liability for any actions taken based on this content. For personalized guidance, it is recommended to consult a certified financial advisor.

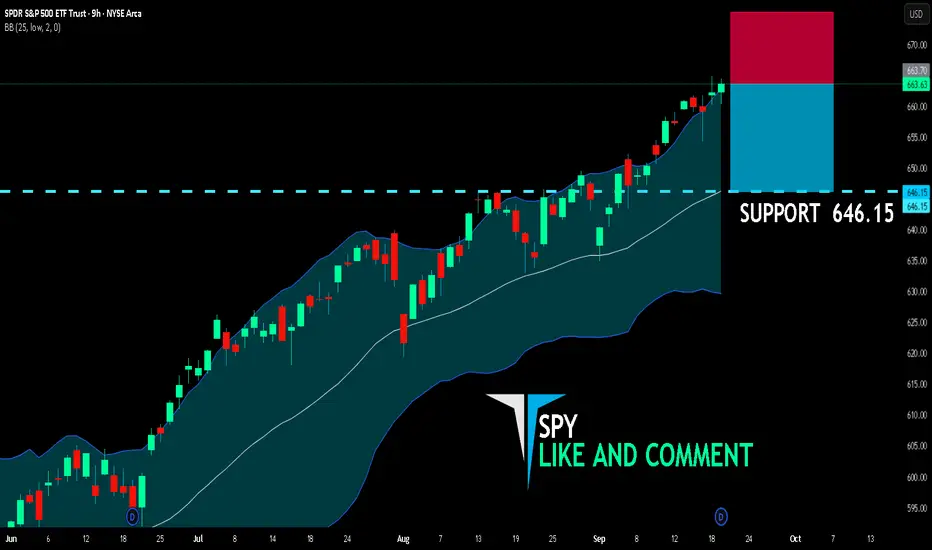
SPY SHORT FROM RESISTANCE
SPY SIGNAL
Trade Direction: short
Entry Level: 663.70
Target Level: 646.15
Stop Loss: 675.36
RISK PROFILE
Risk level: medium
Suggested risk: 1%
Timeframe: 9h
Disclosure: I am part of Trade Nation's Influencer program and receive a monthly fee for using their TradingView charts in my analysis.
✅LIKE AND COMMENT MY IDEAS✅
USOIL (WTI Crude Oil) Intraday & Swing Outlook🛢️ USOIL (WTI Crude Oil) Forecast – Intraday & Swing Outlook 🚀📉
Asset Class: USOIL (SPOTCRUDE / WTI CASH)
Last Closing Price: $62.796
Date/Time: 20th Sept 2025 – 12:50 AM UTC+4
🔍 Market Context
Crude oil remains in a volatile zone as macro factors like OPEC+ policy, global demand recovery, and geopolitical risks continue to steer momentum. Traders must prepare for short squeezes, traps, and breakout plays this week.
📊 Technical Overview
Chart Theories Applied:
📈 Elliott Waves – corrective Phase B nearing end.
🔄 Wyckoff – signs of re-accumulation spotted.
🔺 Head & Shoulders (Inverse) – potential bullish reversal.
🔮 Gann Angles & Time Cycle – short-term resistance clustering near $64.50.
🛠️ Indicators
🔵 RSI (H1) → Neutral zone (48–52).
📏 VWAP Anchored → $62.20 (support pivot).
📉 EMA 20 / EMA 50 → Bullish cross on H4 confirmed.
🎯 Bollinger Bands → Expansion phase → Expect high volatility.
🕒 Timeframe Strategies
📌 Intraday (5M / 15M / 1H / 4H)
Buy Entry (Scalp): $62.20 – $62.50 🟢
TP1: $63.20 🎯
TP2: $63.85 🎯
SL: $61.80 ❌
Sell Entry (Scalp): $63.80 – $64.20 🔴
TP1: $63.00 🎯
TP2: $62.40 🎯
SL: $64.70 ❌
📌 Swing (Daily / Weekly)
Buy Zone: $61.50 – $62.00 🟢
Targets: $65.20 / $67.40 / $70.00 🎯
Stop Loss: $60.50 ❌
Sell Zone (Rejection): $67.40 – $68.00 🔴
Targets: $64.50 / $62.20 🎯
Stop Loss: $68.80 ❌
⚠️ Risk Management
Volatility expected due to Fed rate guidance & OPEC+ commentary.
Stick to 2–3% capital risk per trade.
Watch for bull/bear traps near breakout zones.
📌 Summary
Intraday: Range $62.20 – $64.20 ⚖️
Swing: Upside bias if $61.50 holds strong 💹
Key Resistance: $64.50 / $67.40
Key Support: $61.50 / $60.50
🔥 Bias: Short-term sideways → Medium-term bullish above $61.50.
For individuals seeking to enhance their trading abilities based on the analyses provided, I recommend exploring the mentoring program offered by Shunya Trade. (Website: shunya dot trade)
I would appreciate your feedback on this analysis, as it will serve as a valuable resource for future endeavors.
Sincerely,
Shunya.Trade
Website: shunya dot trade

CHF/JPY SELLERS WILL DOMINATE THE MARKET|SHORT
Hello, Friends!
We are going short on the CHF/JPY with the target of 184.981 level, because the pair is overbought and will soon hit the resistance line above. We deduced the overbought condition from the price being near to the upper BB band. However, we should use low risk here because the 1W TF is green and gives us a counter-signal.
Disclosure: I am part of Trade Nation's Influencer program and receive a monthly fee for using their TradingView charts in my analysis.
✅LIKE AND COMMENT MY IDEAS✅

GOLD BEARISH BIAS RIGHT NOW| SHORT
GOLD SIGNAL
Trade Direction: short
Entry Level: 3,653.06
Target Level: 3,487.88
Stop Loss: 3,762.88
RISK PROFILE
Risk level: medium
Suggested risk: 1%
Timeframe: 1D
Disclosure: I am part of Trade Nation's Influencer program and receive a monthly fee for using their TradingView charts in my analysis.
✅LIKE AND COMMENT MY IDEAS✅

CAD/JPY BEARS ARE STRONG HERE|SHORT
Hello, Friends!
CAD/JPY is making a bullish rebound on the 12H TF and is nearing the resistance line above while we are generally bearish biased on the pair due to our previous 1W candle analysis, thus making a trend-following short a good option for us with the target being the 106.590 level.
Disclosure: I am part of Trade Nation's Influencer program and receive a monthly fee for using their TradingView charts in my analysis.
✅LIKE AND COMMENT MY IDEAS✅

AUD/JPY SHORT FROM RESISTANCE
Hello, Friends!
The BB upper band is nearby so AUD-JPY is in the overbought territory. Thus, despite the uptrend on the 1W timeframe I think that we will see a bearish reaction from the resistance line above and a move down towards the target at around 96.239.
Disclosure: I am part of Trade Nation's Influencer program and receive a monthly fee for using their TradingView charts in my analysis.
✅LIKE AND COMMENT MY IDEAS✅

BITCOIN BEARS WILL DOMINATE THE MARKET|SHORT
BITCOIN SIGNAL
Trade Direction: short
Entry Level: 117,076.48
Target Level: 111,750.81
Stop Loss: 120,567.13
RISK PROFILE
Risk level: medium
Suggested risk: 1%
Timeframe: 1D
Disclosure: I am part of Trade Nation's Influencer program and receive a monthly fee for using their TradingView charts in my analysis.
✅LIKE AND COMMENT MY IDEAS✅

GBP/CAD SENDS CLEAR BEARISH SIGNALS|SHORT
GBP/CAD SIGNAL
Trade Direction: short
Entry Level:1.875
Target Level: 1.843
Stop Loss: 1.896
RISK PROFILE
Risk level: medium
Suggested risk: 1%
Timeframe: 1D
Disclosure: I am part of Trade Nation's Influencer program and receive a monthly fee for using their TradingView charts in my analysis.
✅LIKE AND COMMENT MY IDEAS✅

GBP/JPY BEARS ARE GAINING STRENGTH|SHORT
Hello, Friends!
Previous week’s green candle means that for us the GBP/JPY pair is in the uptrend. And the current movement leg was also up but the resistance line will be hit soon and upper BB band proximity will signal an overbought condition so we will go for a counter-trend short trade with the target being at 199.769.
Disclosure: I am part of Trade Nation's Influencer program and receive a monthly fee for using their TradingView charts in my analysis.
✅LIKE AND COMMENT MY IDEAS✅

GBP/NZD SELLERS WILL DOMINATE THE MARKET|SHORT
Hello, Friends!
GBP/NZD uptrend evident from the last 1W green candle makes short trades more risky, but the current set-up targeting 2.264 area still presents a good opportunity for us to sell the pair because the resistance line is nearby and the BB upper band is close which indicates the overbought state of the GBP/NZD pair.
Disclosure: I am part of Trade Nation's Influencer program and receive a monthly fee for using their TradingView charts in my analysis.
✅LIKE AND COMMENT MY IDEAS✅

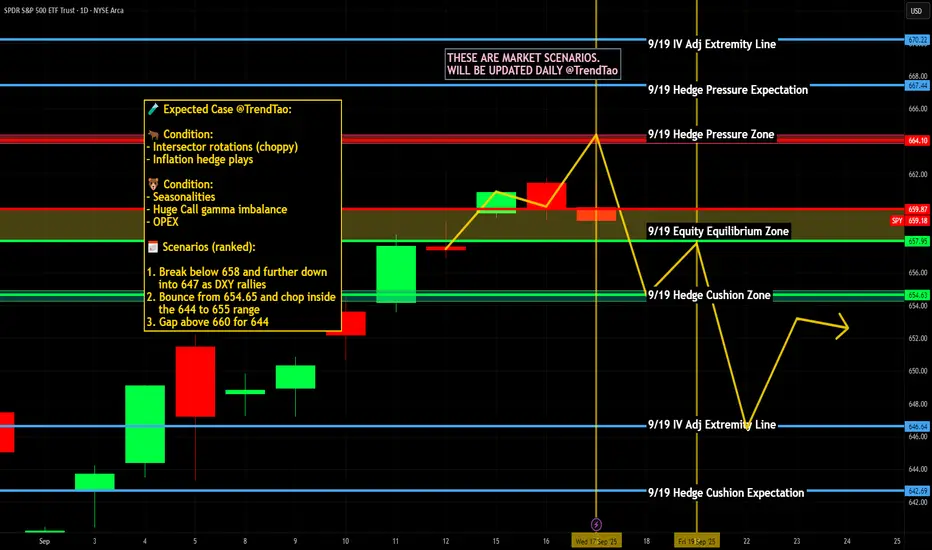
$SPY / $SPX Scenarios — Thursday, Sept 18, 2025🔮 AMEX:SPY / SP:SPX Scenarios — Thursday, Sept 18, 2025 🔮
🌍 Market-Moving Headlines
📉 Post-Fed digestion: Markets recalibrate after Wednesday’s 🚩 FOMC decision + Powell press conference.
💵 Dollar & yields watch: FX and Treasury moves reflect how traders interpret the Fed’s updated path.
💻 Tech + growth trade: Positioning in AMEX:XLK and high-beta names remains key as rates reset.
🛢️ Energy chatter: Oil volatility keeps AMEX:XLE and inflation hedges in focus.
📊 Key Data & Events (ET)
⏰ 🚩 8:30 AM — Initial Jobless Claims (weekly)
⏰ 8:30 AM — Philadelphia Fed Manufacturing Survey (Sep)
⏰ 🚩 10:00 AM — Conference Board Leading Economic Index (Aug)
⚠️ Disclaimer: Educational/informational only — not financial advice.
📌 #trading #stockmarket #SPY #SPX #Fed #Powell #joblessclaims #economy #Dollar #bonds #tech #oil
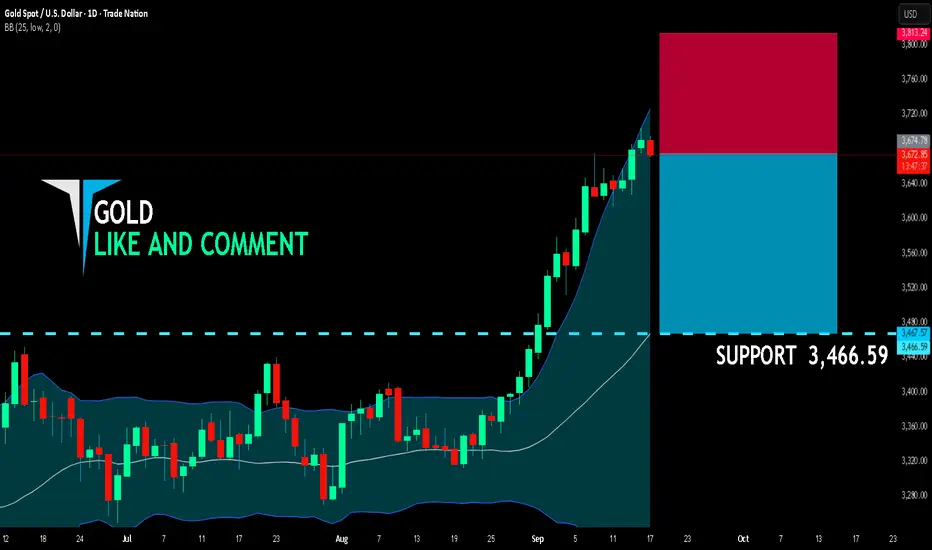
GOLD BEARISH BIAS RIGHT NOW| SHORT
GOLD SIGNAL
Trade Direction: short
Entry Level: 3,674.78
Target Level: 3,466.59
Stop Loss: 3,813.24
RISK PROFILE
Risk level: medium
Suggested risk: 1%
Timeframe: 1D
Disclosure: I am part of Trade Nation's Influencer program and receive a monthly fee for using their TradingView charts in my analysis.
✅LIKE AND COMMENT MY IDEAS✅
GBP/AUD BEST PLACE TO SELL FROM|SHORT
GBP/AUD SIGNAL
Trade Direction: short
Entry Level: 2.043
Target Level: 2.034
Stop Loss: 2.050
RISK PROFILE
Risk level: medium
Suggested risk: 1%
Timeframe: 3h
Disclosure: I am part of Trade Nation's Influencer program and receive a monthly fee for using their TradingView charts in my analysis.
✅LIKE AND COMMENT MY IDEAS✅

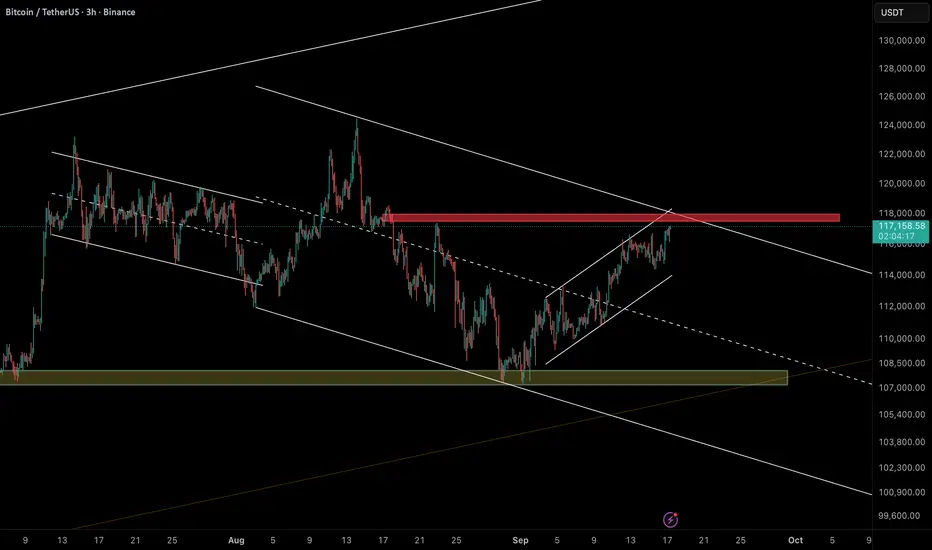
Bitcoin at Critical Resistance – Reversal or Breakout?Bitcoin (BTCUSDT – 3H) is testing the 117.5k – 118k resistance zone, which coincides with the upper boundary of the descending channel.
So far, this level has acted as a strong rejection zone several times.
🔎 Key Insights:
• Structure: Price has formed a rising channel/wedge, often seen as a corrective bearish pattern.
• Resistance: 117.5k – 118k (major supply zone + channel top).
• Supports:
• 114k (short-term channel support)
• 107k – 108k (major support zone + channel bottom).
📌 Scenarios:
• Bearish (more likely): Rejection from 118k → downside targets at 114k and 107k – 108k.
• Bullish (alternative): Break & close above 118k → potential rally toward 122k – 124k.
⚠️ As long as BTC stays below 118k, downside risks remain higher.
USDT Dominance on Thin Ice – Breakdown Likely AheadThe USDT dominance chart remains trapped inside a descending channel, with the key resistance sitting around 4.40%.
Despite short-term bounces, the structure still favors a bearish continuation.
The critical support zone lies at 3.85% – 3.70%, which is the most likely target if dominance fails to break above 4.40%.
🔑 Key Points:
• Main resistance: 4.40% – 4.60%
• Bearish target: 3.85% – 3.70%
• Overall structure still bearish unless 4.60% is reclaimed.
👉 A breakdown here would be bullish for altcoins, as money flows out of USDT.

SILVER BEARS WILL DOMINATE THE MARKET|SHORT
SILVER SIGNAL
Trade Direction: short
Entry Level: 4,275.6
Target Level: 4,185.4
Stop Loss: 4,335.0
RISK PROFILE
Risk level: medium
Suggested risk: 1%
Timeframe: 3h
Disclosure: I am part of Trade Nation's Influencer program and receive a monthly fee for using their TradingView charts in my analysis.
✅LIKE AND COMMENT MY IDEAS✅

EUR/NZD SENDS CLEAR BEARISH SIGNALS|SHORT
EUR/NZD SIGNAL
Trade Direction: short
Entry Level: 1.972
Target Level: 1.961
Stop Loss: 1.979
RISK PROFILE
Risk level: medium
Suggested risk: 1%
Timeframe: 3h
Disclosure: I am part of Trade Nation's Influencer program and receive a monthly fee for using their TradingView charts in my analysis.
✅LIKE AND COMMENT MY IDEAS✅
