USD/CHF Bearish Setup: Technical Analysis & Trade OpportunityPattern Formation: Bearish Bat Harmonic Pattern:
The USD/CHF is currently forming a Bearish Bat Harmonic Pattern, which suggests a potential reversal to the downside. The pattern is nearing completion at a key resistance level, providing a strong setup for a bearish entry.
Key Resistance and Fibonacci Confluence:
The pair has received a significant rejection from a crucial resistance zone, which aligns precisely with the 0.786 Fibonacci retracement level. This confluence strengthens the bearish outlook, indicating that sellers are defending this area effectively.
RSI Analysis:
Bearish Divergence A clear Bearish Divergence is evident on the 4-hour Relative Strength Index (RSI), further supporting the bearish sentiment. As the price makes higher highs, the RSI is making lower highs, indicating weakening bullish momentum and signaling a potential reversal.
Trade Setup:
Entry, Stop Loss, and Take Profit Levels
Entry Level: 0.86325
Stop Loss: 0.86955
Risk Management:
The stop loss is set slightly above the resistance level to protect against false breakouts and unexpected volatility.
Take Profit Targets:
TP-1: 0.85695 - This level provides a conservative target for traders looking to secure initial profits.
TP-2: 0.85065 - A medium target that aligns with further downside potential, giving room for extended profits.
TP-3: 0.84435 - A more ambitious target for traders expecting a deeper retracement.
Conclusion:
The USD/CHF pair presents a compelling bearish setup based on the Bearish Bat Harmonic Pattern, resistance at the 0.786 Fibonacci level, and bearish RSI divergence. Traders should monitor price action near the entry point and follow proper risk management, as outlined in the trade setup.
Bearishbatformation

AUDCHFIs AUDCHF exhausting at strong resistance level?
As the price is been on high bull run but now it seems like price is lacking bullish momentum after reaching at resistance level and bearish divergence suggesting the sell pressure is about to start.
If the bears took control , the 1st target could be 0.5660 followed by 0.5610.
What you guys think of it

USDPKRDouble Top Formation
Difficult to go below trendline
However, if Bat Pattern in action
It is what it izzZZZ :D
Bearish Divergence

2310:TASI: SAHARA INTERNATIONAL PETROCHEMICAL
Formation of Bearish Bat in process
Support from Ascending trendline (Point C of Bearish Bat Pattern)
Entry now with TP at every identified fib level
Trail your stop loss accordingly

Another huge bearflag forming.Seeing as it was 6 months ago that the 200MA on the Daily was touched it makes sense for the trend to gravitate towards it now. This does however coincide with a near perfect bearish bat Gartley harmonic and when the 200MA target is combined with the bearish bat and the chart is turned upside-down, yet another huge bearflag can be seen, which target coincides neatly with the 0.618 retracement Fib.

Week07 - EURAUD | Bearish Bat Chart PatternBearish Bat pattern is about to formed as point C didn't break last lower low and now its bullish towards the point D on currency pair EURAUD.

Bearish Bat Pattern in GailHello traders. I've observed bearish bat pattern in NSE:GAIL
Price Action seems to be Rejecting the PRZ of a Bearish Bat on the Daily that could lead to a Moderate Retrace before seeing Higher Prices.
Hello Trader. Above is purely my opinion. It doesn't mean that you need to trade accordingly. Please note that I'm not Sebi registered advisor or technical analyst. Trade on your own conviction and please consult your advisor before investing.

AMZN - Confirmed 15 Minute Bearish BatLooking for potential price compression into tomorrow's speech by Chairman Powell.

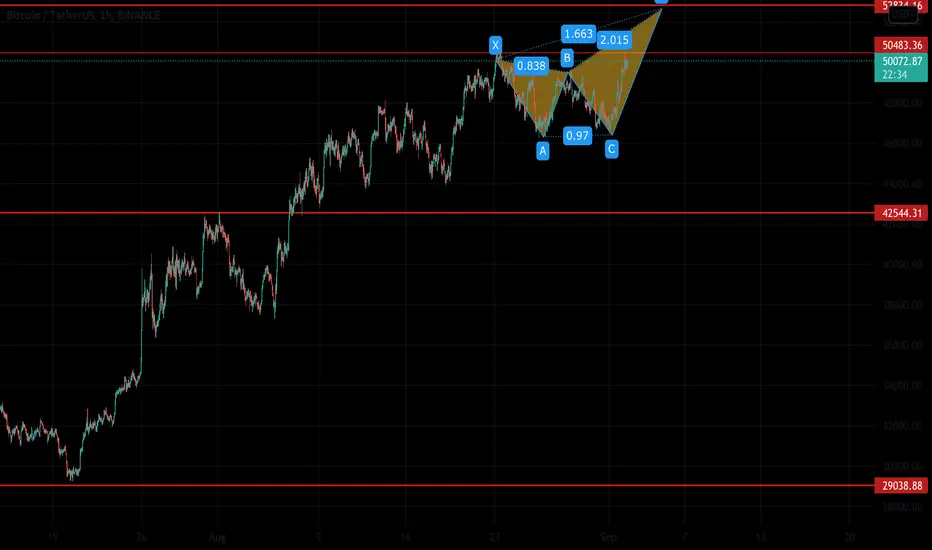
Bitcoin Making bearish Bat Pattern on 1HBitcoin bounced back from $46k levels to $50k . and it also going to make Bearish bat on 1H which can cause short pull back from 52k levels
$52k Level is a high Supply zone and the Hedge area !
This is only my observation and opinion not a financial advise !
Twitter @Crypt001337


CADJPY Potential Bearish Bat and Three Drives PatternsSharing the chart to combine the harmonics with Cycle Sniper and Breakout Sniper Indicators.
Potential Bearish Bat and Three Drives Patterns are shown on the chart.
Potential Breakout Levels as described on the chart.
I will update accorging to Cycle Sniper and Breakout Sniper signals.
Happy New Year !!

Australian Dollar/ U.S. Dollar: Bearish BAT FormationSo, we continue buy Australian Dollar into this trend in H1 timeframe and well, I see a long opportunity of 100 pips. So, as the same of Euro/U.S. Dollar, we hope a bought approximately at $0.73 USD.
At the moment, we find up the level of 2.24 and 2.618 of Fibonacci to complete this bearish BAT formation.


Bearish bat harmonic patternBearish bat formation on SPX. Once the D point has confirmed I will be looking to open a short & setting stop loss as shown.

FKLI TRADING : 124) BEARISH GARTLEY PATTERNthis is trade 124 frm haidojo trading...CLOSE ATTENTION to the :
- a possible bearish bat pattern formation in hourly chart...with range to short frm 1597-1605...SL a few points abv 1605...1st tp 1587,
2nd tp 1560
fkli-aug closing close to the 1585 resistance level tdy...
resistance : 1585- 1605 (the red colored rectangle )
support : 1547-1560
lower support : 1512-1520
WARNING!
RISK DISCLAIMER : this is juz a trading idea...trading stocks, futures or forex might incur a huge risk to your account/funds… DON’T LOSE MONEY THAT YOU CANNOT AFFORD …any idea(s) of trading in this episode SHALL NOT be regarded as a hint of BUYING or SELLING. It is MERELY a trading journal and it has been used for educational purpose only… trade at your own risk!
**your "LIKE" and "FOLLOW" are my main source of motivation to continue posting more valuable contents...TQ**

FKLI TRADING : 121) bracketing the market with advanced patternthis is trade 121 frm haidojo trading...2 messages here tdy...
1) a possible bearish bat pattern formation in hourly chart...with range to short frm 1597-1605...SL a few points abv 1605...1st tp 1587,
2nd tp 1560
2) lower level we have long-awaited bullish cypher pattern ranging frm 1512-1520...SL a few points below the 1500...1st tp 1560,
2nd tp 1587...
with these 2 possible advanced patterns, we successfully bracketing the market within the range of 1605 - 1500...and make a simple
call-to-action plan...
resistance : 1585- 1605 (the red colored rectangle )
support : 1547-1560
lower support : 1512-1520
WARNING!
RISK DISCLAIMER : this is juz a trading idea...trading stocks, futures or forex might incur a huge risk to your account/funds… DON’T LOSE MONEY THAT YOU CANNOT AFFORD …any idea(s) of trading in this episode SHALL NOT be regarded as a hint of BUYING or SELLING . It is MERELY a trading journal and it has been used for educational purpose only… trade at your own risk!
**your "LIKE" and "FOLLOW " are my main source of motivation to continue posting more valuable contents...TQ**

BPCL | LONG TRADEHey guys,
BPCL has a very good setup right now. It seems to be forming a bearish bat with the second impulse wave in the formation.
This trade has an RR Ratio of 6.82. So that pretty much is a very good number to give in.
Sell in the red region and buy back lower at the 0.382 retracement.

#BearishBat #Australia 200 #Index #ShortWe have a bearish bat pattern near-completion on the 60 minute Australian 200 index.
Entry @pprox 6038.5
S.L. @pprox 6069.2
T.P. 1 @pprox 5984.4
T.P. 2 @pprox 5929.2

NIFTY50 - Daily Upate#NIFTY50 - These were two harmonic probabilities, I shared yesterday, and nifty closed at Bat pattern resistance zone 9490-9515.
Sgx nifty is almost flat, so nifty is gonna open flat near pattern resistance, hence resisting near those levels can take nifty to 9350 -9330 levels.
On the flip side only a decisive break of 9500 levels, will open up the next harmonic shark probability that will take nifty to 9770 levels.
Important levels to watch
Resistance 9490 - 9515
Support 9350- 9330
Below 9200 - The shark harmonic Probability will be negated.

GBPAUD Short Trade Idea 4HR TFOn the 4hr time frame GBPAUD has painted part of a Bearish Bat Pattern.
If we get a completion of the pattern by price reaching the D point be on the lookout for reversal patterns, perhaps on a smaller time frame (30m though I prefer to check the 1hr) before entering the trade.

#Litecoin 690% profit in next #Bullrun, #BearishBAT in process?#Crypto #Bullrun2020
#Litecoin is Back in #Accumulation Zone, I have been charting Major crypto for accumulation & I believe 2020 will be the year we will see some good action from #Crypto.
as you can see on the chart there are 2 possibilities, we are in process of building a Bearish BAT that should pump the price from the support level of 36-25$ all the way to 300$ along with it we might be building a Double bottom pattern as well that should get us to at least 138$
Another one for accumulation is #ETH -
make sure to leave a comment & if you agree then hit that thumbs up
#DYOR
remember I am not a financial advisor & this are all just my thoughts :)

GBPJPY Inverse Head And Shoulders and Potential Bat PatternTechnicals:
Price closed above EMA50
Inverse Head And Shoulders Pattern became validated.
Potential Retest of the broken neckline is a buying opportunity.
Take Profit is as described in the chart.
Potential Breakout of TP1 could confirm TP2 and Potential Bearish Bat.
Invalidation of Inverse H&S is described.
Fundamentals:
Strong Yen as a safe haven however a technical correction in all JPY pairs is likely.
Oversold and cheap GBP.
Pay Attention:
Strong risk management is needed due to Brexit based volatility in GBP pairs.
Have a nice weekend!
