CHFJPY Sell IdeaD1 - Price is moving inside a bearish flag and is holding below the downtrend line, potential bearish hidden divergence.
H4- We have two critical zones that has formed based on the fibo levels of the cycles, the top of the daily bearish flag pattern and the daily downtrend line.
Price has currently reached the first critical zone, bearish divergence. Until this critical zone holds may expect bearish moves.
Alternatively if the price moves higher then the next area to look for bearish setups with bearish evidences would be the second critical zone.
Invalidation: If the price moves higher and breaks above the daily downtrend line then this sell idea would be invalidated.
Bearish Flag

BTCUSD - Bear Meat to fuel the next Bull RallyThere is a Bear Flag forming on the short side of things. This should help pull down the RSI, MACD, Stoks, etc. etc. So long as we don't break the multi-year trend line from my other charts and the 20/40 week moving average remains crossed (which it did last night) All these Bears are going to get skinned and their meat used to fuel the next Bull Rally. Not only will the Bulls be buying hand over fist but the shorts will be right there with them doing the same. The next couple of weeks should be exciting !
Good luck!
(My weekly update below)

Bitcoins Upwards Trend Line in Danger or Just a RetestHere we can see how ETH followed the 'rules' quite well, with staying below that resistance. For bitcoin it was more difficult to determine that level. Rather had seen it stay below the 8700ish. But it was weekend and they pushed it up with very low volume all the way up from the 8300/8400.
Now we can see why they did it, because volume was that low, they created a stop loss zone for shorts and pushed it up from the 8600 to eventually 8850 even. Why i think this theory is likely, because we moved up with very low volume, but even more, selling volume was much bigger at those 2 drops. Even looks like that final push up from 8750 to 8850 was just to close longs or fill up shorts.
These are theories that can be a bit subjective, so now to the facts. On the left we can see a clear up trend line, which we are testing once again. So normally if it breaks with good volume we should see at least a retest of the green support on the left. At this point it's very likely to happen, unless we see that bear flag range (in the middle chart) fail. So we should stay below the 8550ish from now on. The longer we hang around that red trend line, the bigger the odds it will break.
Previous analysis i talked about an ABC correction, where we possibly even completed it with that big drop few days ago (similar to 2 weeks ago, yellow circles). But with this drop and the reasons described above, good chance that it might become a normal bigger ABC this time. The target of C wave, is IMO always a subjective thing. Usually it's a similar size as wave A (so around 1000/1200) so a drop to like 7900/7900. But it could hold above 8000 as well but also drop much more even. A lot will depend on the volume. That volume shows the market intentions a bit. On the daily we can see that volume is still showing that bull trend is in favor. No matter what my thoughts on lower time frames are, i don't become really bearish until i see a big sell volume candle, reaching those yellow circles. So even if i would be bearish now, i don't assume the trend for the coming weeks/months will be down again up until we see that big sell volume. Also means, if sell volume doesn't start to
To give an impression of this, chart below shows a few of the previous highs in 2018. During the 5K movement a month ago, i kept mentioning this fact, that as long as we don't see this, we should not assume that the high is set already. I saw many people already thinking that the high is set already because of numerous reasons. Those reasons were legit, normal TA, but you simply can not ignore the King of all indicators, which is volume. Volume are buyers and sellers and the buyers and sellers determine all the TA patterns and all the indicators out there.
Anyway, for now i think we should keep it simple, bears are a bit in favor here at this point. As long as the bulls don't break this bear flag in the middle on the upside, chances of a break of that red trend line remains likely. But we should also not forget, as long as it doesn't break, it's simply still is a upwards trend line. For it's just always a sign, that when we see a drop at nr 1 and then a second test, without being able to make a higher high first (so break the break the 9000ish first), it can be a sign of top formation. Or at least that it needs more consolidation before moving up again. If this last case is what we are seeing now, it could be we are going to see like an upwards triangle from 27-05 at the 8000. As i have drawn on the left. Of course anything is possible, but seeing a second triangle immediately after the one we had at 6800/8400 a few weeks ago, is not likely.
So my short term view is down, as long as we stay below the 8550ish and for ETH around 265/7. Before i forget, in the beginning where i talk about volume increase if we do drop and break the bear flag, we should see it increase from around that yellow circle at 8350/8400.
Please don't forget to like if you appreciate this :)
Previous analysis

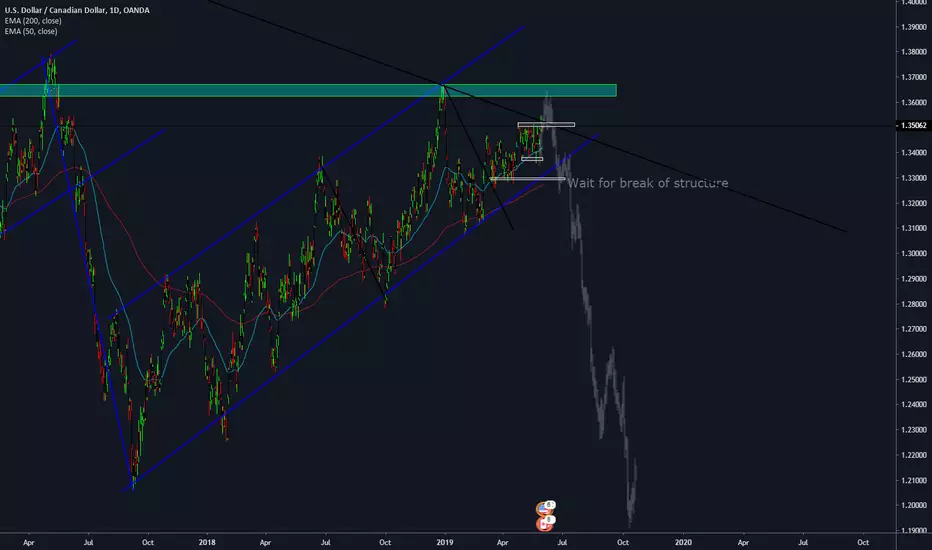
USDCAD 1,700 PIP DROP INCOMINGAs you can see, we have a series of bearish flags.
I am looking for price to double top off 2k18's previous high at the 1.36500 level before declining.
I'd wait for nice daily priceaction off the highlighted level for a risky entry
for a safer entry id wait for a break of structure
it would also create MACD divergence
Signifying sellers coming into the market.
GBP/CAD 4-HOUR TIMEFRAME SHORTGBP/CAD recently broke out of the daily corrective structure that started out in early September 2018. This was in the form of an 800 pip move. We are expecting this drop to continue, as price is currently making a smaller corrective structure, and therefore we can expect a continuation to the downside after this bear flag is complete. It will also be interesting to note how the sterling will react to the resignation of the second woman-prime minister of the UK, Theresa May, thirteen days from now on the 7th of June. I hope there will be more selling. In bears we sell!!!

USDCHF false break out and bear flag, Part 2Okay so far the counter move of the wedge/triangle fake breakout, is going perfectly. Broke that bear flag and accelerated down. So keeping the speed of the drop as it should be in the big bearish wedge view. Because if we continue like this coming week, and break that green support around 0.99, we could possibly even see it continue to drop (in waves) to 0.96 and maybe even the 0.93/2 zone.
The markets can sometimes open with a gap after the weekend, but when ignoring that we can see what looks to be a basic bullish wedge. Ideally we see it go up and getting rejected below that red resistance zone on the right. This would keep the speed of the drop even better than perfect. If we see it break and get rejected at the red in the middle, it would still be good speed. Think 1.01 should be the real max. Breaking this will kill the speed and we could see a completely different outcome then.
So for now, wait and see how this plays out at opening.
Previous analysis:

USDCHF Sell IdeaD1 - Currently it looks like the price is moving lower towards the dynamic support.
H4 - Price broke below the bearish flag pattern.
We may now look for pullbacks and sells with bearish evidences.

USDCHF false break out and bear flagLooks like USDCHF made a a false breakout 2 weeks ago. Broke up on the upside of that bullish wedge and broke down again. Past half year i assumed this was a big bearish wedge, while knowing there was a chance it might be an ascending triangle. Because of that big rally a month ago, it looked like the triangle won. Now it seems that one failed as well, which usually suggest a counter move.
Now to give it a bit more wiggle room, think we can say that if the green support around 1.0050 breaks, the pull back has probably failed. But then we want to see a fast drop from that bear flag. Think for a normal flag, should see it drop within 48 hours or so.
Previous analysis:

ETH Bearish flag A bearish flag seems likely to be forming on KRAKEN:ETHUSD . It may be part of a larger ABC correction (wave 4). I’ll be looking for a break below the lower trend line of the bear flag to enter a short position. I’ll target between the 1:1 extension (ABC) and the 50% retracement of wave 3 ... $208 - $213.

GBPAUD Broken and Retested: Flag, H&S, And Ascending TrendlineAfter reversing off of the .5 fib retracement, GBPAUD is giving us a nice opportunity to follow the trend further downward.
We have multiple confirmation signals including:
1) A broken and retested ascending trendline
2) A broken and retested Bear Flag
3) A broken and retested Head and Shoulders Pattern
We also have a potential AB=CD pattern with the D point converging with the 1.414 extension of the AB impulse leg.
First target will be the most recent support.
Second target will be the 1.272 extension of the AB impulse leg this area is quite a strong area to take profit because the 1.272 extension has nice confluence with the next level of structure
Third target will be the 1.414 extension of the AB impulse leg.
Final target will be the 1.618 extension of the AB impulse leg, a level which also shows strong confluence with structure.
Please Like, Comment, and Follow
Goodluck!

Trade Ideas AnalysisA Bearish Flag forms on 4-hourly chart, trade engaged as on the 1-hourly chart(right) it was a bearish gartley that has reached the 1st target level.
Compare with his counterpart, CADJPY, this is a better pair to short as there's a previous support level. on the higher timeframe

$BTC bearflag in play on lower timeframes?$BTC bearflag in play on lower timeframes?
$BTC bearflag in play on lower timeframes?

GBP/AUD: Bearish Flag PatternFirst, let take a look at daily chart.
On daily TF, GA has formed a nice doubletop.
Now on H4 TF, waiting for breaking the flag before taking any decision.
Wish you trade safe and sound.

EURAUD Bear Flag, Partially Formed Head and Shoulders and ABCDEURAUD is giving us a nice opportunity to sell the market.
After completing a large ABCD pattern, and reversing from resistance, a bearish continuation pattern is forming.
We have a nice bear flag (blue) along with a partially formed head and shoulders pattern.
The smaller BC impulse found resistance at the .618 retracement of the AB leg + structure.
Target: If we project the AB leg from the C point, our D point target correlates nicely with support looking left. This area also has confluence with the 1.272 and 1.414 extension of the AB impulse leg.
Goodluck!

5th of may cadusd bearish set up.cadusd has broken ascending trendline and made a bearish flag pattern. Waiting for price to break out so I can enter.

ETH Double bottom or Bear flagThe market is at a turning point now it seems. Going to keep this one short.
2 options here, it's either a bear flag or a double bottom. For the double bottom we need to see it move inside of a small bull flag as we can see on the left. So needs to stay close against the neckline of the W bottom for a while, maybe a few hours. If that will happen, a break upwards is very likely to happen.
If we see rejection at the current level, so if we drop again below 155ish, than the bear flag option will become much more likely to happen.
At this point it's difficult to say which one it will be. For the bulls i would say, play it safe and wait a while to see that small bull flag play out first. Because than your chances go from 50/50 to almost 80/90%. For the bears, its more difficult, because if it starts to drop it will likely continue to drop.
Based on my BTC analysis, for now i prefer a bullish outcome, but only if btc can hold current levels.
As we can see from my previous analysis, so far it has been moving as planned, so the bullish version would be ideal. Would have been so much easier to say things if we didn't have that Finex issue hanging over the market. But feels like most already forgot about it. Tether is also on it's way up again, which is good.
Previous analysis:
