AUD/USD: 0.382% sell entryAussie it's look bearish and for 2 occasion it's make a confluence of 0.382% of Fibonacci to continue sell.
This it's the H4 timeframe and we broke down this bearish channel. For that, I put a short position in the $0.7340 USD with the SL at $0.7364 USD (24 pips) and target at $0.7244 USD (over 70 pips)
Bearishsetup

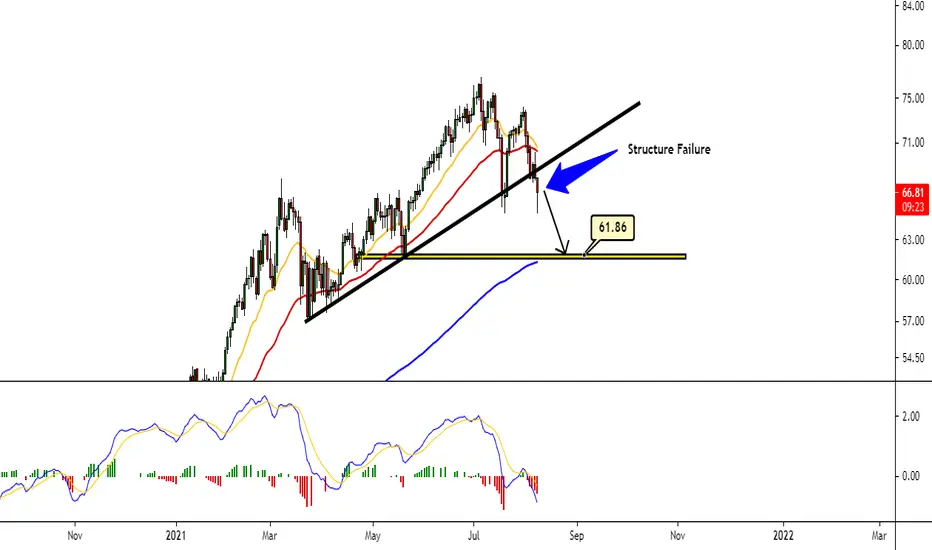
WTI Crude Oil: Bearish ContinuationOil could to continue down as we failure this bullish structure. Next support to $61.86 USD.
MACD it's bearish indication to sell Oil.
That could to to happen with Cardano!!!Cardano it's look weakness in front of Ethereum. Because Ethereum it's takeover power of cryptocurrencies like Cardano, XRP, Chainlink, and also Bitcoin. Ethereum rally it's showing us that it's so powerful than Bitcoin. For that, this scenario could to happen if Cardano continue crashing in front of Ethereum.
Cardano may to go down to 0.0003 ETH approximately and more down than 0.0002 ETH. If that happen, I may to get over 28,000 Cardano coins if Cardano down to 0.0003 ETH or over 40,000 Cardano coins if Cardano down to 0.0002 ETH. Now I have this plan in Cardano that may to weakness more as Ethereum strenghten the trend.
I don't going now to buy altcoins when Ethereum takeover power!!!

XRP/Ethereum ratio plan to buy XRP soon possible!!!This it's just my plan, now I take in note the following factor to determine to buy XRP in front of Ethereum.
If XRP reach down to 0.0002 ETH and accumulating 9 ETH. I may to bought in range of 40,000 XRP-45,000 XRP coins in hold. That it's so much coins
But, XRP could to continue down more of 0.0002 ETH. But I take in note the Ethereum market cap and Dominance to take a plan when to sell all my Ethereum. Now, I invite you to have 2 plan in cryptocurrency to accumulate, and also 3 in the same time. For example: Ethereum, Cardano, XRP and Bitcoin. And also, you can to add another cryptocurrency like Vechain, or many anothe to have a good plan to accumulate your main cryptocurrency.

XRP/BTC it's look bearish scenario!!!I look that XRP it's interesting to invest, but not in currencies, if you're so smart and inteligent, we can firstbly invest in Bitcoin when XRP down in front of Bitcoin and you can to take more power to buy XRP to hold.
As I hold 0.34 BTC. if XRP down to 632 satoshi. I could to hold over 53,000 XRP coins just if XRP continue down more, I'm enfocous in this part if XRP down to 632 satoshi, I going to buy XRP and hold 53,000 XRP in this opportunity. As also, I find up that when XRP making a bullish volatily hard and reach or equal the Cardano price, I may to change my 53,000 XRP to 53,000 ADA. This it's so theory. But if in case that XRP down to 632 satoshi, I will going to buy in this level of Bitcoin value.
I'm interesting in this cryptocurrency for my plan B. And you can to copy me if you like to invest like a professional in cryptocurrency.

ADA/BTC it's look bearish in front of Bitcoin ratioCardano it's looking bearish in front of Bitcoin as Take control of the altcoins now!!! These are my watch level to look in the future to buy Cardano here.

ETH/USD: Ethereum fight to break up the resistance lineLooking Ethereum in H8 timeframe, it's look bearish. But now. I'm in short position too together with Cardano. I put my next trade in the downtrend toward $1,730 USD. This candlestick pattern in H8 timeframe it's bearish reversal and during this uptrend in the end fof the near of $2,200 USD. I see a group of bullish loss that put Ethereum into this sell.
I look that as I trade in based the Daily timeframe that the persspective it's look Ethereum bearish. I canceld and closed up my long position in Ethreum around of $2,020 USD.
s3.tradingview.com
This it's the chart of Daily timeframe, we see a descending triangle in formation. That put Ethereum extremely bearish to $1,000 USD. You can view my another analysis on Ethereum where you can to click down of the link to related idea.

Big Warning!!! Ethereum could to crash 40%Ethereum forming a descending triangle, and that put in risk that Ethereum may to crash the vaue if cryptocurrencies doesn't make support in their key support zones.
My perspective in Ethereum it's becoming more bearish as the same with Cardano. If that happen in Ethereum, Cardano may to crash too. But in Daily timeframe, Cardano forming a bullish riisng wedge, the best perspective it's to check out the market in weekly or monthly timeframe to know where Cardano leading for.

BTC/USD: Bitcoin could to leading down toward the EMA 200At the moment, anayzing the weekly timeframe, it's look extremely bearish for Bitcoin. I thinking that Bitcoin could to leading down toward the EMA 200 in the average price of $19,000 USD. That level it's a higher price when Bitcoin reached on 2017 near of $20,000 USD per coin. THE RSI and MACD are bearish together with the price action.

Bitcoin form a bearish flag; bearish signal!!!At the moment and analyzing in H4 timeframe, I see that Bitcoin form a bearish flag that we forming between yesterday and today. Guys, the moment to sell cryptocurrencies are putting for investor the option to get cash and for the moment, don't invest in cryptocurrencies. This drop could be a big crash in the crypto-markets as China take control over citizens to prevent to use Bitcoin, and that put a Bitcoin in the risk by the China Government. But guys, if you save cash in what you get profitable, you can to buy more cheap cryptocurrencies and more coins that you have now.
s3.tradingview.com
Now, if you look the H8 timeframe, Bitcoin it's making a pull back below of $35,000 USD key resistance in H4 timeframe, and I believe that Bitcoin it's not forming any bullish flag that I show you yesterday, just that Bitcoin could to continue crashing in the next days.
s3.tradingview.com
Now, based in this theory, Bitcoin could to crash 28% to go to $25,000 USD approximately or crash 50%, and that put a Bitcoin price to $17,000 USD. in any mode, if that occur, Ethereum, Cardano, XRP and cryptocurrencies going to suffer more.
Now, I put a sell order limit at $32,600 USD in my trading app with the SL at $34,000 USD and my specific target will be $25,000 USD.
***As I buy Cardano coins, I decide to sell again. In the morning, I tweet that I sold my Cardano coins to get cash for now, There's not any good moment to invest in Bitcoin or any cryptocurrencies as the trend it's becoming more bearish.

Perspecive in Ethereum!!! Sell!!!That will be the 2 support at $1,370 USD and more down than $900 USD if Ethereum reach both or one support. For that, this will be my traidng plan enfocous to short Ethereum!!!

Time to short Ethereum!!!Just I want to share my perspective how I see Ethereum. Ethereum brokedown the simetric triangle and right now, we are in the ressitance to confirm, but we can't to entry in the short position, just I may to hope in this timeframe analyzing in H4 timeframe.
If the next candlestick in formation show us a bearsih pattern, we can to entry to short Ethereum. My next forecast it's that Ethereum could to reach down to $1,650 USD approximately.

Update: Bitcoin form 100% Shoulder Head Shoulder; bearish patterAt the moment of this analysis. Bitcoin down below of $35,000 USD. i was in the good time in the just moment when Bitcoin down and make a volatile movement. But well, I can't to analyze it when Bitcoin form a bearish flag, but at the moment, I do not entry. but I am so near to entry in short position, but if you entry, ok, no problem, but I can to update my perspective how I see Bitcoin during this next days.
s3.tradingview.com
Remember this analysis, BItcoin it's into this simetric triangle and the trend need to be defined. But guys, I did very well in my past analysis where I commente that Bitcoin form a shoulder head shoulder (bearish pattern), but I did very well my analsyis so precise. Now, if I see that BItcoin show us another entry to short, I will entry in this position until my target at $32,600 USD.


UKOIL - SELL NOW !- Wednesday OPEC+ Meeting cancelled and keeps its plan to raise output (starting in May)!
- Problems in Oil Alliance between Russia and Saudi Arabia!
- Russia aims for a selling price of $42 to $45!
- BEARISH SETUP in final stage ! It can only be a matter of hours! SELL NOW !

USOIL - SELL NOW !- Wednesday OPEC+ Meeting cancelled and keeps its plan to raise output (starting in May)!
- Problems in Oil Alliance between Russia and Saudi Arabia!
- Russia aims for a selling price of $42 to $45!
- BEARISH SETUP in final stage ! It can only be a matter of hours! SELL NOW !

Bitcoin still bearish based in my perspective point!!!At the moment, I see recently that Bitcoin starting to up, but in general, Bitcoin it's below of the 3 EMAS: 200, 50 and 21.That mean that Bitcoin still in the bearish movement until $45,000 USD, that it's a Daily strong support and the best price to continue buy more Bitcoin. I know that the market it's overbought and that chances could to jump the Bitcoin price to down.
In Daily, it's bearish. But in H4 it's could to form another simetric triangle, and that could be a possibilities that Bitcoin it's in the middle point to down. And also, in H4 we see a bullish divergences, but remember, that not guarantize that Bitcoin up by divergences, use always the price action, in that case, Bitcoin still bearish until $45,000 USD. Now, depending what happened today, if Bitcoin just make a support above of $50,000 USD and continue up in the next hours, my others perspective it's that maybe Bitcoin could to form a shoulder head shoulder inverted in H4 timeframe.

USOIL - Will history repeat itself !?Chart from 2019 - Don't look it like today?
Setup for a LONG DEEP FALL are nearly done! Be prepared! This will be HUGE!

Elliott Wave Analysis: TESLA With Bearish Setup FormationHello traders and investors!
Yesterday we shared $AAPL Apple and today we want to show you another, similar wave structure on $TSLA Tesla.
As you can see, Tesla made an impulsive five-wave drop in February, which actually suggest a reversal from the top into a higher degree correction, as five-wave cycle is barely the first leg A of a three-wave A-B-C corrective movement.
Well, recent recovery looks like a complex w-x-y corrective rally in wave B, which is now trading at key resistance zone here at the channel resistance line around 61,8% - 78,6% Fibonacci retracement.
So, if we are on the right path and if Tesla starts sharply falling back below 700 region, then we should be really aware of much bigger sell-off within wave C that can push the price even down to 500-400 support zone.
Be humble and trade smart!
If you like what we do, then please like and share our idea!
Disclosure: Please be informed that information we provide is NOT a trading recommendation or investment advice. All of our work is for educational purposes only.

Elliott Wave Analysis: APPLE Approaching ResistanceHello traders and investors!
Today we will talk about Apple, its price action from technical point of view and wave structure from Elliott Wave perspective.
Well, if you are familiar with Elliott Wave, then you know how useful can be when analysing the markets.
We have noticed very interesting pattern on Apple, where we can see a five-wave drop from the highs in February. A five-wave reversal usually indicates for something bigger and that's why we labeled it as a higher degree wave A of bigger and deeper A-B-C correction.
If recent five-wave drop is wave A, then current recovery should be as part of a three-wave correction in wave B. And we can clearly see a three-wave a-b-c movement, which is not approaching key 61,8% - 78,6% Fibonnaci retracement, where ideal resistance would be here in the 130-140 projected resistance zone.
If we are on the right path, then a reversal down can be around the corner and if this happens, then we can easily expect a sell-off within wave C towards projected 110 - 100 support zone.
Be humble and trade smart!
If you like what we do, then please like and share our idea!
Disclosure: Please be informed that information we provide is NOT a trading recommendation or investment advice. All of our work is for educational purposes only.

Profitable Patterns: Fibonacci RetracementsLarry Pesavento is a 50 year veteran trader. He began his career trading full time in 1967 while in graduate school getting an MBA in Finance following a BS in Pharmacy. In 1982 he became a member of the Chicago Mercantile Exchange where was a local in the S&Ps currency pits. Following this he worked for a commodity corporation in Princeton New Jersey from 1985 to 1986.
''Pattern One and Two are reaction patterns. The move from point B can be 38%, 50%, 61%, 70.7%, 78%, 100% ( double top or bottom). The only time I use the 38% retracement level to find a trade entry is when the move from A to B is one of tremendous thrust (three to five times normal trading range bars). The market will give you strong clues as to what it will do next if you watch the retracements in new moves. If it reacts only 38% on the first reaction swing, then a high probability exists that the next swing or two will also be 38% reactions.''
- Larry Pesavento, Profitable Patterns for Stock Trading
Found this post valuable? Make sure to LIKE and FOLLOW for more!

NAS100USD THE SITUATION IS PRETTY CLEAR 🧨🧨🧨Theres is a W formation on the weekly time frame. We can definitely expect the completion of the pattern with a retracement to the neckline.

Overview: Does 30% correction it's enought to stop and bought?At the moment, as we see in Daily and Hourly timeframe, this it's very important for Bitcoin in long term looking to weekly timeframe.
I have these 2 perspective so possible for the Bitcoin price. My first perspective it's that Bitcoin its right now in the possible correction of 30% to stop this correction in the level of $42,000 USD and well, in this zone it's a key point to bought in this level to make trading.
In case that Bitcoin break out the $42,000 USD, we can to see a strong correctio toward the $29,000 USD approximately and that it's a correction of 50%.
For that, this it's my bearish setup plan in case that Bitcoin break down the $42,000 USD key support.
And finally, I want to share you an interesting data that in the past on the previously bull run of Bitcoin on 2017 we have the similar event that was occur in the same months in February 2017, now we are in February 2021 and we see that this it's repeat the same movement what Bitcoin do in the past. For that, I share you this screenshoot what I analyze it for you.
Guys, if you found out that this idea it's sound interesting, I invite you to share this analysis with others people, traders and investor who analyze BItcoin or have a simiar plan, and also to sum my followes who follow me in my trading view, in the past 2 days I overpass the 1,000 followers, and overpass the 4,000 points ot my trading view reputation. That's excellent for me to work my talent.
