AXS: two 40% pumps are coming...Hi!
AXS remains in a clear uptrend, trading cleanly inside a rising channel. Price held the mid-range support and is now pushing higher, suggesting buyers are still in control. As long as the lower channel support holds, the structure favors continuation.
The next upside objectives align with the marked resistance zones, with the first target near the prior high and a higher extension toward the upper channel. Overall bias stays bullish while price remains above support.
the first target area: $2.65
the second target area: $3.3
Beyond Technical Analysis

Gold was moving in a sideways range lets see what next ?Gold remains in a bullish consolidation phase after hitting a new record high near the 4700 mark for the first time. The rally was supported by a weaker U.S. dollar and fears of renewed trade tensions, which sparked a strong rush into safe-haven assets.
Markets are now awaiting the European response to former President Trump’s threat to impose tariffs on eight European nations. Investors are closely monitoring developments related to Greenland-linked investment concerns, as any escalation could further influence risk sentiment.
From a technical if price maintains a higher structure and bulls manage to break resistance once again, further upside targets are seen in the 4765–4785 zone. However, if price shows weakness, immediate support is expected around 4704, followed by a deeper support area near 4685.
You may find more details in the chart,
Trade wisely best of luck buddies,
Ps; Support with like and comments for better analysis thanks for Supporting.

Bitcoin Price Update – Clean & Clear ExplanationBitcoin highlighting a key pullback into a major demand zone after a strong bullish move BTC previously broke out strongly, rallying from the lower consolidation range to a local high near 97,500 after the rally, price entered a corrective phase, forming lower highs and lower lows the correction is currently bringing price back into a strong demand/support zone around 89,000 – 90,500 USDT.
the current drop has brought BTC back into a major demand zone around 90K–88.5K, which also aligns with a rising trendline support from earlier price action.
This zone has acted as a strong accumulation area in the past, increasing the probability of a bullish reaction or bounce.
“If you come across this post, please like, comment, and share. Thanks!”

No One Is Talking About the Compounding EffectCompounding is the quiet force behind long-term trading performance, yet it receives far less attention than entries, indicators, or win rates. Most traders focus on how much they can make on the next trade. Very few focus on how consistently they can protect capital so growth can stack over time.
Compounding works only when losses are controlled. A small drawdown requires a modest recovery. A large drawdown demands exponential effort just to return to break-even. This is where many traders unknowingly sabotage themselves. They chase higher returns while ignoring how volatility, overexposure, and mistake clustering interrupt the compounding process.
The math is simple, but the behavior is difficult. Consistent gains, even small ones, build on each other. In contrast, irregular large losses reset progress. A trader who averages steady, controlled returns often outperforms one who alternates between big wins and deep drawdowns. The difference is not talent. It is durability.
Compounding is also sensitive to frequency. More trades do not automatically mean faster growth. Each trade carries execution costs, slippage, and decision risk. When frequency increases without a proportional increase in edge, the compounding curve flattens. Fewer, higher-quality trades allow gains to accumulate without being eroded by friction.
Risk scaling plays a critical role. Increasing size because the account grew is logical only when conditions remain supportive.
Scaling during volatility expansion or structural uncertainty increases the chance of giving back compounded gains. Accounts grow fastest when size increases follow stability, not excitement.
Time is another overlooked variable. Compounding rewards patience. It favors traders who stay in the game long enough for probabilities to express themselves. Missing a trade has little impact. Breaking discipline has a lasting one.
The compounding effect does not reward aggression. It rewards consistency, restraint, and respect for risk. Traders who understand this stop measuring success by single trades and start measuring it by how smoothly their equity curve progresses. Over months and years, that mindset separates short bursts of performance from sustainable growth.

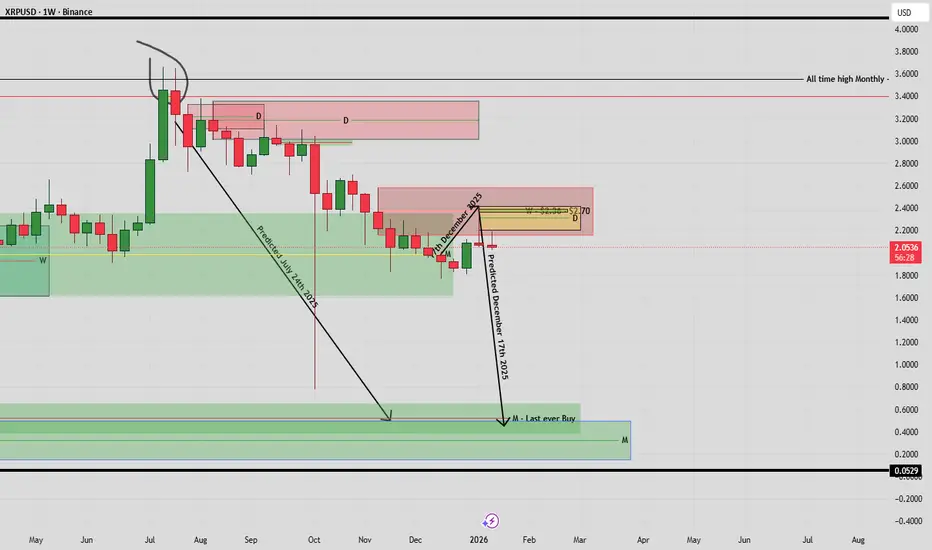
XRP has been BEARISH since JULY 24th 2025! IT STILL IS!BINANCE:XRPUSD
Back in July 2025 , when XRP was at all time highs, nobody could see that XRP was in a Veraxis zone to the downside.
Price was screaming bearish whilst price was allegedly bullish. To back up my call, i added a note on Tradingview notes, dated 24th July 2025 to make an embedded receipt of this prediction. My note said:
"XRP must go down to AT LEAST $1.50 and potentially to 0.50c, as we are now in a HEAVY sell."
Roll on October 10th 2025, the so called " Crypto Crash " zoomed price to 0.77c, which shocked the crypto space. To me, this was just the beginning.
The black arrows on my chart annotate on the days i wrote the notes.
THIS MOVE IS NOT OVER.
As price progressed, many Veraxis zones to the downside were created and were respected, however the most recent one printed 10th November 2025, and on 17th December 2025 i embedded another receipt/note to say:
"XRP will now continue its journey down to AT LEAST 0.50c, with potential to go down to 0.38c. Resistance may have to be hit first at $2.36 - $2.60 before it happens."
And as you can see from the annotated arrows, price retraced EXACTLY to that price 19 days later. The journey is now continuing down.
For context. When a Veraxis zone prints, price 9 times out of 10 MUST return back to it. I call the price of 0.50c - 0.38c as this is an untouched Veraxis zone.
One caveat as it's price over everything: Price is currently in a Veraxis zone to the upside which is contradictory to my prediction of lower prices, and price 'could' move up from here.
However, my back testing has trumped this move up in my opinion, as the Veraxis zone at 0.50c below current price, must be touched FIRST . If price does indeed spike up from this current Veraxis zone of $2.05, then i will temporarily adapt to price, but with always the expectation that 0.50c MUST be then touched in future.
SAFE MY PEOPLE!
(This analysis is built on the Veraxis framework — a methodology shaped from first principles and refined through extensive independent research. Veraxis, derived from Latin for “The True Pivot Point,” reflects a unique approach to market structure that isn’t sourced from external strategies or conventional teachings. It represents my own interpretation of how price truly pivots, reacts, and reveals intent.
As always, this is not financial advice. Trade safely, stay disciplined, and let the data speak.
)
Bitcoin (BTC/USD): Inverse Head & Shoulders Breakout SetupHi!
The chart shows a clear shift in structure after a prolonged downtrend. Price broke the descending trendline that had capped Bitcoin for months, signaling weakening bearish control. Following that break, an inverse head and shoulders pattern formed, with a left shoulder, head, and right shoulder resting on an ascending trendline.
The zone around 100k–102k stands out as the key resistance and measured target of the pattern. Current price action shows higher lows and improving momentum, suggesting buyers are in control as long as price holds above the rising support near the right shoulder.
If Bitcoin maintains this structure and confirms strength above the neckline, a move toward the 102k target is technically justified. However, failure to hold the ascending trendline would weaken the bullish thesis and could trigger another range or pullback.
Overall, the bias remains cautiously bullish, with confirmation dependent on a clean continuation toward the neckline resistance.
Disclaimer: As part of ThinkMarkets’ Influencer Program, I am sponsored to share and publish their charts in my analysis.

Solana (solusdt): a correction and a possible bounceHi guys!
As you can see Solana breakout from the resistance line but it was a false breakout and then started a drop there!
I see the drop will continue at least until the gray area and then price could rise from there!
short position target: $123

A stock market bubble, Gold is the saviour! - January 2026A thought for the audience, have a read, comments below… does this make sense? With everything that is happening in the world.
Does this sound familiar?
1. Stock market bubble! 1929 style crash is imminent. AI tech bubble crash will collapse the indices and destroy retirement accounts if action is not taken.
2. An investment in Gold and Silver is now paramount to protect your wealth. Act now before fiat currency collapses to zero.
Throughout social media those two narratives are ringing out so loud, it is all I hear. On one hand News outlets warn us of a stock market bubble and imminent crash. On the other are self made gurus talking up the importance of a position in Gold or Silver.
Some facts on the above 5 month chart:
1. Bear markets typically last 14 years (the pink boxes). It is unlikely any investor born in the last 30 years has experienced one, unless Mummy and Daddy opened a trust fund for you.
2. Bear markets are separated by 18 year business cycles, this is a well known economic fact (the space between the pink boxes).
3. The last bear markets began in the year 2000, 1968, and 1937.
4. Market crashes of 70% and more, which is widely being touted as what we should expect, occurred 1930 and.. er never again.
5. Crashes were seen from 1930 of course, typically 45%. However it wasn’t the crashes that got you, it was the opportunity cost. The cost of being long during a bear market was crushing.
Are we heading into a stock market bear market? No. But we're all prepared for it, as it were certain.
Consider this:
a) Since the last bull market peak in the year 2000 the S&P 500 is now up 360%
b) During the same period, Gold per ounce is up 1700%
c) Gold has been in a bull market since the year 2000, which also include a stock market bull market, highly unusual. In fact, a 1st.
My question to the audience:
If we’re in a stock market bubble, how is Gold to protect wealth when it has almost returned 5x times more than the stock market?
Is we’re in a stock market bubble, why is this bubble (one of smallest bubbles at 360% compared to the previous ones of 1200% and 600% before it) one of the worst we've ever seen?
Look forward to reading your answers!
Ww

GOLD Price Update – Clean & Clear ExplanationGold trading within a medium-term ascending structure, respecting an upward sloping trendline drawn from previous higher lows. Price action remains constructive overall, but short-term consolidation is visible.
If Price is holding above the rising trendline, indicating bullish market bias multiple demand and supply zones are marked, highlighting key reaction areas Previous rejections near the trendline (circled areas) confirm it as a strong dynamic support/resistance gold is currently consolidating around 4,670, forming a tight range recent candles show indecision, suggesting accumulation before a directional move.
A successful hold above the trendline and a breakout above 4,690 could trigger a rally toward 4,710 if Failure to sustain above 4,660 may lead to a pullback into the 4,640 demand zone, with deeper correction possible if that level breaks.
“If you come across this post, please like, comment, and share. Thanks!”

GOLD Price Update – Clean & Clear ExplanationGold is moving inside a rising trendline, which shows the overall structure is still bullish. However, price is currently trading in a consolidation zone and reacting strongly around key supply and demand areas.
Two possible scenarios are shown:
🔼 Bullish Scenario
If price holds above the support and respects the trendline a breakout above 4,620 – 4,630 could push Gold toward the 4,645 psychological level this would confirm continuation of the bullish trend.
🔽 Bearish Scenario
If price fails to hold above 4,590 – 4,580 a breakdown could send Gold toward the 4,570 to 4560 support zone a clean break below this support may trigger stronger selling pressure.
Gold is at a critical area. Holding above support favours buying toward higher levels. Breaking below support favours selling toward lower zones. Traders should wait for confirmation before entering, as the market is deciding its next major direction.
“If you come across this post, please like, comment, and share. Thanks!”

GBPUSD well-defined bullish structureGBP/USD is currently trading within a well-defined bullish structure after respecting a rising trendline that has acted as dynamic support. Price previously consolidated inside a broad range and has now broken above the upper boundary, signaling a potential continuation of upside momentum.
The recent impulsive move shows strong bullish strength, followed by a healthy pullback, suggesting buyers are defending higher levels. As long as price holds above the trendline and the broken resistance zone (now acting as support), the bullish bias remains intact.
Tecnically if the bulls manage the pullback or continuation for higher highs toward the marked targets, while a clear break below the trendline would invalidate the bullish setup so we see upside 1.35400 to 1.35800,
You may find more details in the chart,
Trade wisely best of luck buddies.
Ps; Support with like and comments for better analysis thanks for supporting.

Bitcoin Technical Outlook (Both Scenarios)Bitcoin is currently moving in a neutral zone, and traders are waiting for a clear breakout on either side to confirm the next strong momentum. Price action shows indecision, so direction will depend on which side gains control first.
Technically, the bullish continuation depends on how well the key support level holds. If buyers defend support and bullish momentum returns, Bitcoin could push higher. Expectations of possible Federal Reserve rate cuts and upcoming important U.S. economic data are major factors that could create sharp volatility across BTC and the broader crypto market.
If Bitcoin maintains support and bulls regain strength, the upside targets are around 98K to 100K A strong break above resistance with volume could open the door for further upside.
If price fails to react positively and breaks below the support zone, selling pressure may increase. This could trigger a downside move toward 88K and possibly extend to 84K.
You may find more details in the chart,
Trade wisely best of luck buddies,
Ps; Support with like and comments for better analysis thanks for Supporting.

GOLD | New ATH Above $4,730 as Safe-Haven Demand SurgesGold Breaks Above $4,730 on Weaker Dollar & Safe-Haven Demand
Gold prices surged past the $4,730 level for the first time, supported by a weaker U.S. dollar and renewed safe-haven demand amid rising geopolitical and trade-related concerns.
The U.S. Dollar Index slipped to 98.70 (−0.7%), making gold more attractive for non-USD buyers.
At the same time, a mix of geopolitical uncertainty, concerns over central-bank independence, and elevated U.S. debt levels has unsettled investors, driving capital flows toward gold and silver over currencies and government bonds.
This comes after an already exceptionally strong performance for precious metals, reinforcing gold’s role as a hedge against policy and macro uncertainty.
Technical Outlook (GOLD)
The price pushed higher by approximately $110, exactly as outlined in the previous idea.
Short-Term Structure
While trading below 4733, a retest is likely toward 4718–4710
From this zone, bullish momentum is expected to resume
Bullish Continuation
A rebound from support would target: 4742
A confirmed break above 4742 opens the way toward: 4757 - 4784
Bearish Risk
A bearish scenario becomes valid only if geopolitical tensions ease
Sustained price action and stabilization below 4710 would shift momentum bearish
Key Levels
Pivot Line: 4733
Resistance: 4742 – 4757 – 4784
Support: 4710 – 4695 – 4678
PREVIOUS IDEA:

USNAS100 Price Update – Clean & Clear ExplanationUSNAS100 price is currently trading around 25,218, showing strong bearish momentum after a sharp breakdown from the rising trendline support.
Price previously respected the ascending trendline, but once this support was broken, sellers took full control and pushed the market aggressively to the downside. This breakdown signals a shift from bullish structure to short-term bearish continuation.
US100 has broken its upward support and turned weak. Any bounce toward resistance is a chance for sellers. If price stays below 25,600, we can expect more downside toward 25,100 and possibly 24,800.
“If you come across this post, please like, comment, and share. Thanks!”

ETHUSD CRACK! Wave 3 Warning!🚨When it rains, it pours. We’re seeing concurrent breakdowns across multiple asset classes, consistent with the risks I’ve been flagging for some time.
ETH is at stage 5️⃣ Panic / Liquidity Event, more on this later.
ETH is now down -47% from ATH, after Wave 1 down.
ETH has been trading below the Death Cross X countertrend Wave 2, flagging out "Deeking"(Honey ticking)
Now it is Cracking the Flag. (Like many other asset classes)
🚩 Warning us that Wave 3 down is coming!
1️⃣ Early Drop (-5% to -10%) — Denial Phase
2️⃣ Correction Phase (-10% to -20%) — Reassurance Phase
3️⃣ Official Bear Market (-20%) — Commitment Trap
4️⃣ Deep Decline (-30%) — Moral Pressure Phase
5️⃣ Panic / Liquidity Event (-40% to -50%) — Narrative Flip
6️⃣ Late Stage / Bear Rally — False Hope
At Stage 5️⃣ Panic, you will hear these phrases.
“This was a black swan”
“No one could’ve predicted this”
“It’s different this time — but markets adapt”
“Valuations are now attractive”
“Big Money won’t allow a collapse”
📌 Translation: The damage is done. Rewrite history.
I need to make another post to get you all ready for what is to come, so you don't get suckered like I did when I was first starting out.
I paid the price, so you don't have to.
#FAFO
If you enjoy the work:
👉 Drop a solid comment
Let’s push it to 6,000 and keep building a community grounded in raw truth, not hype.

BUY BTCUSDPrice is sitting inside a strong demand zone: 90,800 – 91,300
Previous drop was impulsive → liquidity grab into demand
Structure above still favors higher highs if demand holds
Primary Plan (high-probability):
Expect a reaction bounce from 91k
First push toward 93,500 – 94,000
Minor pullback
Continuation toward 96,500 – 97,800 (major supply)
Targets:
TP1: 93,500
TP2: 95,000
TP3: 97,500 – 98,000 (strong resistance / profit zone)
Invalidation (don’t ignore this):
1H close below 90,700 → bullish idea fails
Below that → next stop 89,500 – 88,800

AUDCHF SELL- Trendline Break 4hrAUDCHF was in an uptrend from 18th November, multiple trendline touches, at the 7th of January it began to consolidate. It has now broken the upwards trendline and broken this area of support during consolidation. Strong selling opportunity. comment your thoughts below

Looking for a retrace BTCMonthly chart is bearish. (expected price 57500)
This is a possible zone for a leg up on the daily chart.
Anchored Harmonic Lattice Mapping (AHLM)
Description
A price-structure decoding technique that anchors a fixed harmonic ratio lattice to a higher-timeframe reference, then resolves price movement as discrete, quantized transitions between invariant harmonic levels. Each swing is treated as a complete triad (high–mid–low), enforcing structural symmetry and resonance across timeframes.

Bitcoin likely to revisit 57,500.00Anchored Harmonic Lattice Mapping (AHLM)
Description
A price-structure decoding technique that anchors a fixed harmonic ratio lattice to a higher-timeframe reference, then resolves price movement as discrete, quantized transitions between invariant harmonic levels. Each swing is treated as a complete triad (high–mid–low), enforcing structural symmetry and resonance across timeframes.

Just a beautiful image BTCAnchored Harmonic Lattice Mapping (AHLM)
Description
A price-structure decoding technique that anchors a fixed harmonic ratio lattice to a higher-timeframe reference, then resolves price movement as discrete, quantized transitions between invariant harmonic levels. Each swing is treated as a complete triad (high–mid–low), enforcing structural symmetry and resonance across timeframes.

GOLD 4750 BREAKOUT Gold looking to retest its highs and cross above ( 4750.655 ) and carry on with its trend towards higher highs

TSLA Remains A Dead TradeDouble top, Rising wedge failure with a minor Crack followed by two major CRACKS!
For four years now, people have been chasing narratives rather than value. "Pilot testing" makes no difference. It's all baked in and then some. Don't lose your money chasing narratives.
As I have been warning for a long time now.
If narratives mattered more than price, this wouldn’t look like this.
Look for the previous low to break.
THANK YOU for getting me to 5,000 followers! 🙏🔥
Let’s keep climbing.
If you enjoy the work:
👉 Drop a solid comment
Let’s push it to 6,000 and keep building a community grounded in truth, not hype.

The Geopolitics of OIL market: The Demise of OPEC+..!The End of the Oil Monopoly: Is Trump’s Energy Gambit the Death Knell for OPEC+?
For decades, the Organization of the Petroleum Exporting Countries (OPEC) and its expanded alliance, OPEC+, have functioned as the world’s "central bank of oil." By tightening or loosening the spigot, they have dictated global prices, often to the detriment of Western economies. However, a tectonic shift is underway.
If the Trump administration succeeds in its high-stakes strategy to revitalize and control Venezuelan and Iranian oil production, the world may be witnessing the terminal decline of OPEC+ as a geopolitical force.
The Strategy: Flooding the Market
The core of the "Trump Doctrine" on energy is simple: abundance. By bringing the world’s largest proven reserves—specifically those in Venezuela and Iran—back into the formal international market under U.S. influence, the administration aims to create a permanent global oversupply.
* The Venezuela Factor: With U.S. forces recently intervening in Venezuela and the administration seeking $100 billion in private investment to rebuild its crumbling infrastructure, the goal is to ramp production from under 1 million barrels per day (bpd) to 3 million or more.
* The Iran Squeeze: Through a combination of "maximum pressure" and potential military/political shifts, the administration seeks to neutralize Iran’s "shadow fleet," either by stopping its flow to China or redirecting it into the regulated market where it can no longer fund regional instability.
Breaking the "Cartel"
OPEC+ relies on cohesion. When the U.S. produces record amounts of shale and simultaneously unlocks the taps in Caracas and Tehran, the "market share" of the Saudi-led cartel evaporates.
* Price Irrelevance: If the U.S. can sustain a "sub-$50" price environment through sheer volume, OPEC+’s primary tool—production cuts—becomes a suicide mission. Members like the UAE and Iraq, who need revenue for domestic diversification, may eventually refuse to participate in cuts that only benefit non-members.
* The Loss of Spare Capacity: As OPEC+ members are forced to keep their oil in the ground to support prices that refuse to rise, their "spare capacity" becomes a financial burden rather than a strategic asset.
Controlling the "Dragon" and the "Bear"
The most significant impact of this energy surge isn't just at the gas pump; it’s the decapitation of the financial engines of Russia and China.
1. Bankrupting the Russian War Machine
Russia’s economy is a "gas station with nukes." It requires oil prices to stay well above $60–$70 to balance its budget and fund its military. If Trump’s actions keep global benchmarks near $50, Russia faces a permanent fiscal crisis. By controlling the marginal barrel of oil via Venezuela, the U.S. effectively sets a ceiling on Russian power.
2. Severing China’s Energy Lifeline
China is the world’s largest oil importer. For years, it has relied on "discounted" oil from sanctioned regimes like Iran and Venezuela to fuel its economy while bypassing the U.S. dollar.
* The End of Discounts: If the U.S. controls the marketing of Venezuelan crude and blocks Iranian "shadow" exports, China loses its cheap, off-book energy.
* The 25% Threat: Trump’s warning of 25% tariffs on countries buying Iranian oil forces Beijing into a corner: pay full price for U.S.-regulated oil or face a trade war it cannot win.
The Verdict: A New Energy Order
The demise of OPEC+ would not mean the end of oil production in the Middle East, but it would mean the end of oil as a weapon. If the Western Hemisphere becomes the primary source of global growth in supply—led by the U.S., Guyana, Brazil, and a revitalized Venezuela—the center of gravity for global energy shifts from Riyadh and Moscow to Houston and Washington. In this new world, oil is no longer a tool of extortion, but a commodity of American-led stability.
Enhanced by AI (Gemini)
