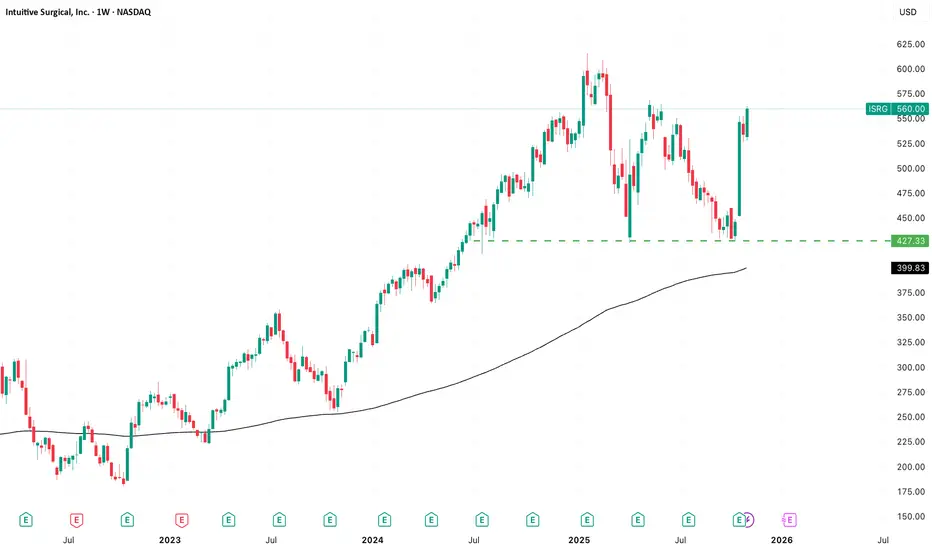
ISRG - Institutional Conviction Meets Relative Strength#ISRG -the "A" grade stock i'm watching for 15 years...
While the Nasdaq puked 1.9% yesterday and AI stocks shed $500B in value, Intuitive Surgical (ISRG) quietly held the after earnings gap and is eyeing new highs. This is what institutional buying looks like when conviction meets opportunity.
The Setup:
Crushed Q3 earnings Oct 21: $2.40 EPS vs $1.99 est (20% beat)
Revenue: $2.51B vs $2.41B expected
Gapped up and HELD for two weeks
83.64% institutional ownership - the smart money is loaded
Yesterday's Action:
Market environment: Tech bloodbath, fear everywhere
ISRG response: Breakout to $548
This is textbook relative strength. When a stock refuses to go down with its sector and instead breaks out, institutions are telling you something.
The Fundamental Story:
20% global procedure growth (da Vinci robots)
da Vinci 5 adoption accelerating beyond expectations
100,000+ procedures completed on new platform
No real competition in robotic surgery!!
The Trade I 'Missed':
I was busy. Away from the desk. Classic. The best setups always happen when you're not watching. But that's exactly what makes this worth sharing - if you're looking at healthcare/medtech and wondering what has real institutional support, this is your answer.
Current Price: $560
ATH: $616 (Jan 2025)
When institutions own 83.64% of a stock and it breaks out during a sector-wide selloff, they're not done buying. They're just getting started.
Not financial advice. Just what I'm watching, now getting in will be tricky, but this one is surely worth the watch.
What are you seeing in medtech/robotics? Drop your tickers below.
#ISRG #IntuitiveSurgical #MedTech #HealthcareStocks #RoboticSurgery #RelativeStrength #InstitutionalBuying #StockBreakout #TradingView #StockMarket #Medtech #DaVinci #HealthTech #MarketAnalysis #StockTrading
Beyond Technical Analysis
Nifty 50 Index - Intraday Technical Chart Analysis - 10th Nov.NSE:NIFTY
Nifty 50 Index — Chart Pathik Insights | 10-Nov-25
(If these levels and updates help you, take a second to boost, comment, or share—your engagement directly fuels my effort to keep these coming!)
Check this Link to Align With Positional Move Shared Earlier.
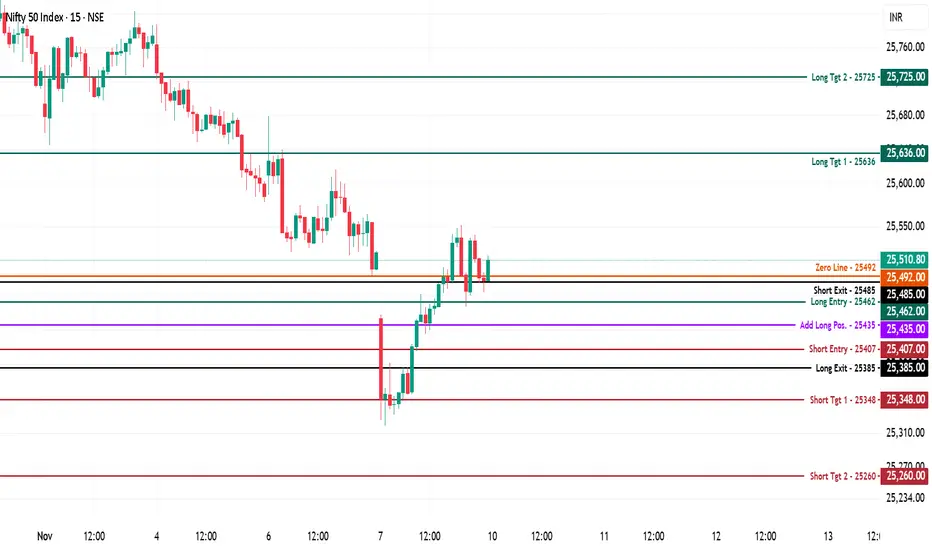
Nifty 50 is trading at 25,510 above the zero line (25,492), attempting to stabilize after a sharp recovery from recent lows. Intraday structure is shifting toward neutral-to-bullish, but volatility near the zero line and mapped pivots continues to invite both breakouts and sharp pullbacks.
Bullish Setup:
Longs can be initiated above 25,462, especially on sustained closes over the zero line and through prior resistances.
Upside Levels:
25,636: First target and congestion area for bulls.
25,725: Full extension for strong trend continuation plays.
Risk Management: Place stops near the add-long zone (25,435) or previous session lows should momentum reverse unexpectedly.
Bearish Setup:
Short side trades activate below 25,407, with increased conviction if a rejection at add-long or zero line triggers a strong downside move.
Downside Levels:
25,348: Immediate short-coverage target.
25,260: Aggressive extension if sellers regain momentum.
Risk Management: Cover shorts if reversal closes above long entry or recent highs, especially if volume spikes countertrend.
Neutral/Indecision Zone:
With 25,492 as the major session pivot, expect choppy action until expansion is confirmed in either direction.
Reference these levels for mapped risk, optimal entries, and disciplined profit-taking.
If you value these daily insights and want them to keep flowing, a simple share or comment shows it’s worth my time—let’s build this transparent trading community together!

EUR/USD Market Outlook – Bullish Projection from 1.14586 Demand The EUR/USD pair is expected to pulled back into a major demand zone around 1.14586, which aligns with a previously respected accumulation area on the chart. This zone has consistently acted as a reaction point, and current price behavior shows buyers stepping back in after a corrective move to the downside.
From this 1.14586 zone, I expect EUR/USD to continue pushing higher toward the major liquidity pool and previous swing high located around 1.1917 – 1.1918. This level represents a key supply zone that price left unmitigated during the last impulse, making it a logical target for bullish continuation.
The red line below price marks your stop loss, positioned beneath the deeper demand block around 1.1391 – 1.1392. This is an appropriate structural invalidation point: if price breaks below that zone, bullish momentum would be negated, and the upward projection would no longer be valid.
Summary of the Setup:
• Entry Bias: Bullish from the 1.14586 demand zone
• Stop Loss: Below 1.1391–1.1392 red line (structural invalidation)
• Primary Target: 1.1917–1.1918 previous high/supply zone
• Outlook: Expecting a continuation toward the high as long as price remains above the demand zone
This structure provides a clear risk-to-reward framework and aligns with the zones highlighted on my FOREXCOM:EURUSD chart.

Gold (XAU/USD) – 4H Market OutlookFOREXCOM:XAUUSD Bias: Short-term bullish retracement toward prior high
Price is currently reacting from a well-defined support zone around the 4,000 region, where buyers have shown repeated willingness to step in. The market has consolidated within this zone, forming a series of higher lows, which signals accumulation and potential exhaustion of the previous bearish leg.
My entry aligns with the structural demand. The rejection wick at the base of the zone suggests failure to break lower, strengthening the case for a bullish move. As long as price holds above the marked support, the market maintains a realistic path toward the previous swing high above 4,360, which is the projected target.
The bullish target area also aligns with the broad imbalance / inefficiency zone created during the earlier sell-off. Markets commonly retrace to rebalance these areas before deciding on the next major directional move.
Your stop-loss placement below 3,886, under the structural low and beneath the liquidity sweep, is logical. If price violates this level, it would invalidate the bullish thesis and confirm continuation to the downside.
In summary:
• Market is respecting a valid demand zone.
• Accumulation structure favors a bullish corrective leg.
• First major liquidity pool sits above 4,360 (your target area).
• Stop-loss below 3,886 protects the trade idea while honoring market structure.
⸻
Devil’s Advocate — What Could Break This Plan?
To strengthen your thinking, here are the strongest counter-arguments:
1. The “demand zone” may actually be redistribution.
If this is a bearish continuation, the sideways movement could simply be sellers reloading before pushing price to new lows.
2. Liquidity above 4,360 might NOT get hit yet.
Price could rally halfway into the inefficiency and reject aggressively without filling the entire imbalance.
⸻
Three Clarifying Questions you should ask(to tighten your analysis)
1. What confirms for you that this is accumulation and not redistribution?
2. If price only retraces to the midpoint of the imbalance (around 4,260), do you still hold full TP at 4,360?
3. What invalidation level—besides the SL—would signal loss of bullish momentum?

134kThis channel is not providing individualized trading or investment advice, nor is it a banking service, brokerage service, trading service, investment service or money management service

435This channel is not providing individualized trading or investment advice, nor is it a banking service, brokerage service, trading service, investment service or money management service

TATA Steel LimitedPrice has Bounced from Order Block, hence will go and hit target marked as T1 and T2

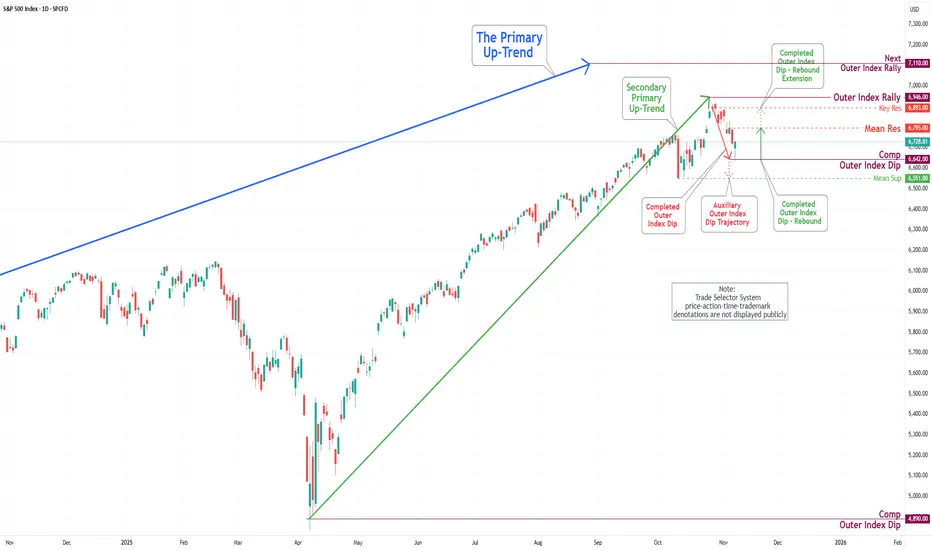
S&P 500 Daily Chart Analysis For Week of Nov 7, 2025Technical Analysis and Outlook:
During the recent trading session, the S&P 500 Index experienced a notable decline, underscoring the significance of our key target, situated at the Mean Support level of 6,740. The index has now completed the Outer Index Dip at 6,642. This positioning indicates the potential for further upward movement, with the target established at the Mean Resistance level of 6,795. The prevailing trend suggests a well-structured extension towards the Key Resistance level of 6,893, with an ultimate target for the Outer Index Rally set at 7,110.
Nevertheless, it is crucial to acknowledge the possibility of a substantial drawdown in the forthcoming week’s trading session. This may lead to a retest of the Outer Index Dip at 6,642, possibly resulting in a further decline to the Mean Support level at 6,551 before ultimately resuming an upward trajectory.
EUR/USD Daily Chart Analysis For Week of Nov 7, 2025Technical Analysis and Outlook:
During the most recent trading session, the Eurodollar market demonstrated considerable volatility, characterized by both significant downward and upward movements. The initial decline caused prices to decrease sharply, reaching and passing the Inner Currency Dip at 1.151, subsequently followed by a vigorous rebound that resulted in a retest of the Mean Resistance level at 1.159.
Current market analysis suggests that the prevailing sentiment is inclined toward a downward trajectory, with prices likely to target the Mean Support level at 1.153. There is a watchful expectation that this movement may lead to a subsequent retest of the Outer Currency Dip at 1.148. Furthermore, it is imperative to monitor the breakout thresholds for the currency, focusing on the two principal handles: Mean Resistance at 1.159 and Mean Support at 1.153.

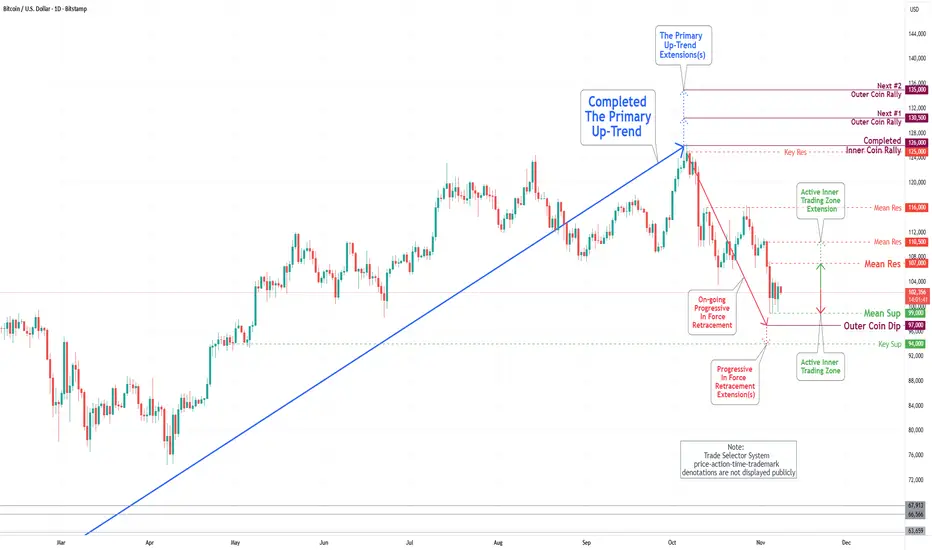
Bitcoin(BTC/USD) Daily Chart Analysis For Week of Nov 7, 2025Technical Analysis and Outlook:
In the previous trading session, the Bitcoin market experienced a notable drawdown over the past week, with the Mean Support established at 101,000, around which trading activity was concentrated. Presently, the price is actively maintained within the range defined by the Mean Resistance at 107,000 and the Mean Support at 97,000.
Current market analysis suggests the likelihood of a retest toward the Mean Support level at 99,000, with a primary emphasis on the potential for further downward movement toward the Outer Coin Dip at 97,000, which may extend to the Key Support level at 94,000. Nonetheless, it is vital to recognize the substantial rebound potential present at these critical levels.
BTC SELL PROJECTION. for buy continuation if $99,940 holdsBTC is set to Sell from $102,940 market cap down to $99,940. We may likely See some Strength from Around $99,940 Area, to further push the Digital currency Upward.
Failure for $99,940 Area to Hold. The Sell will Continue.
But for Now, BTC bounce off from $98,910. An historic Support, since then the digital Currency has traded above $98,910 for 2days now. So i am Having my buy limits at $99,940
#PIPLABB
DOYA
5min tf
1:5RR

SOL Short SOL Short 📉
In the medium term, I am bearish.
Rebalancing the bearish inefficiency (POI) is likely to lead to continued aggressive markdowns, which can be used to open a short position.

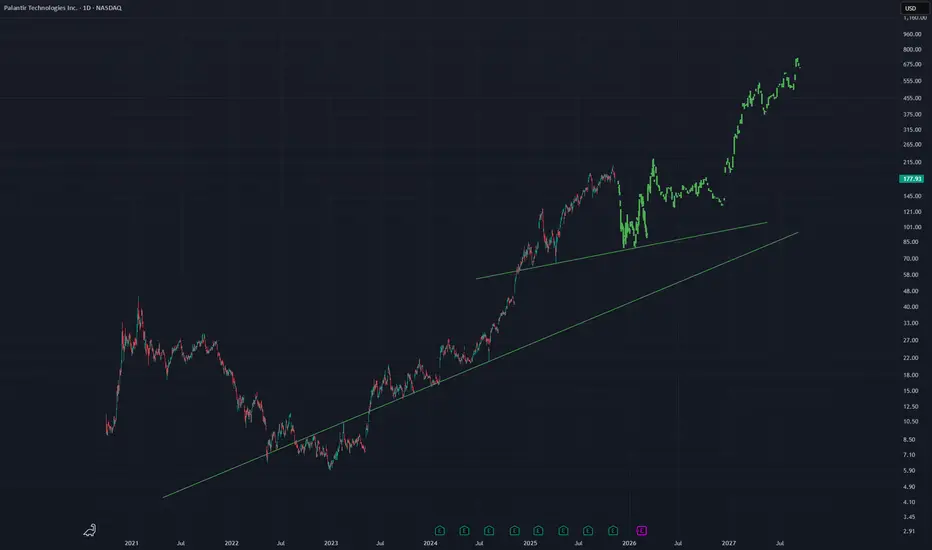
PLTR - Bars Pattern PredictionsUsing the bars pattern tool on this daily chart for PLTR to see if there will be a retest of a lower trend line before continuation upward
The lowest trend line probably will not be hit but i leave it there
See if future price action looks anything at ALL like this
YALLA XAUMO — GOLD (XAUUSD) | Weekly Institutional 📘 EDUCATIONAL ONLY — NOT FINANCIAL ADVICE
All times Africa/Cairo (UTC+2). Report time: Sat, 08 Nov 2025 — 10:09
🟡 YALLA XAUMO — GOLD (XAUUSD) | Weekly Institutional — COMPREHENSIVE (Approved Protocol)
Spot ref: 4,000.18 • GC1 (front): 4,009.8 • GC2 (next): 4,043.3
→ Term spread (XCM): +0.84% → Contango
— GC futures curve explainer —
• Contango → GC2 > GC1 (normal upward curve; storage/carry is priced in; not bearish by itself).
• Backwardation → GC2 < GC1 (near-term demand/supply stress; often bullish spot impulse).
• Term spread (%) → (GC2 − GC1) / GC1 × 100 → shows curve slope/steepness.
────────────────────────────────────────────────────────────────────
1) SNAPSHOT & MAP (W1 focus, using your attached GC1/GC2 & XAUMO boards)
• State: Balanced / Sideways around 4,000 handle (POC ≈ 4,000–4,001).
• Boxed range (cash): 3,976–4,027 (VA Low ≈ 3,988–3,990; VA High ≈ 4,010–4,012).
• Immediate inflection: 4,010 (accept above → 4,027/4,034), 3,996 (accept below → 3,983/3,976).
• Weekly VWAP bias: flat-to-slightly up; value building near 4,000.
2) XGM GATE MAP (where the week tends to open)
• Above 4,010 gate → bullish distribution to 4,027 → 4,034/4,043.
• Below 3,996 gate → bearish rotation to 3,983 → 3,976 → 3,965.
• Inside 3,996–4,010 → fade the extremes back to POC (4,000 ±).
3) GC FUTURES STRUCTURE (Daily)
• GC1 ~4,009.8, GC2 ~4,043.3 → mild contango (+0.84%) consistent with carry; no squeeze signal by structure alone.
• Basis vs spot ~ +0.24% (spot 4,000.18) → curve not pressuring immediate spot dislocation.
4) FIB-KICKER / VOLUME MATRIX (from your boards)
• Pullback magnets: 61.8% ≈ 4,004; 88.6% ≈ 4,010.
• Extension magnets: 118% ≈ 4,031–4,034; 138–150% ≈ 4,056–4,075 (stretch if RVOL expands).
• Volume note: rotation pockets inside 3,996–4,010; outside requires RVOL > 1.1 to sustain.
5) ICHIMOKU REGIME TABLE (directional read)
• 4H: Bullish continuation, “retracement in progress.”
• 1H: Mixed / tactical bearish on dips; flips bullish only above 4,012–4,016 acceptance.
• 15m/5m: Buy-the-pullback bias into 4,010 when momentum > EMA(9/21).
6) VALUE MAP (POC/VAL/VAH/VWAP)
• POC ~ 4,000–4,001 • VAL ~ 3,988–3,990 • VAH ~ 4,010–4,012 • WVWAP ~ flat ≈ 4,001
• Interpretation: Acceptance above VAH unlocks 4,027/4,034; failure at VAH reverts to POC then VAL.
7) XAUMO TREND MAP (confidence %)
• Weekly: Sideways-up (58%)
• 4H: Gentle up (55%)
• 1H: Neutral→up only above 4,012 (48% below / 56% above)
• 15m: Up on RVOL>1 / EMA9>EMA21 (60%)
8) KICKER PROJECTIONS (what good looks like)
• Bull path: Probe 4,004 → reclaim 4,010 → build above → 4,027 → 4,034/4,043.
• Bear path: Lose 3,996 → 3,988 → 3,983/3,976 → stretch 3,965 if RVOL>1.2.
9) SESSION BIAS TABLE (London/NY execution tips)
• London Open (LO): Fade early sweep toward 3,996/3,988, target mean (4,000) or VAH (4,010) if momentum confirms.
• pre-NY: If VAH holds support, squeeze to 4,027; if VAH rejects, short back to 4,000 → 3,996.
• NY Main: Break-and-hold above 4,012 tends to run stops to 4,027/4,034; miss = chop back to 4,000.
10) CROSS-ASSET HEATMAP (from your watchlist snapshot)
• VIX ~19 (calm-ish but reactive) • US30 +0.09% • NASDAQ −0.35% • XAU/EUR +0.44%
• Read: Mild equity softness + steady VIX = supportive on dips if DXY doesn’t spike.
11) LIQUIDITY MAP (where stops likely sit)
• Tops: 4,012–4,016 (acceptance flip), 4,027, 4,034/4,043.
• Bottoms: 3,996, 3,988, 3,983, 3,976, 3,965.
12) ECON-AWARE NOTES (weekly posture)
• With curve in mild contango and cash boxed at 4,000, news shocks likely decide who wins 3,996 vs 4,010.
• Plan: Execute technicals; expand size only when RVOL > 1.1 and ADX (LTF) rises.
13) EXECUTION CHECKLIST
HTF bias aligned? (Weekly/4H not fighting your 15m idea)
Above/below gate (4,010 / 3,996) decided?
RVOL > 1.1 and 9>21 EMA on entry TF?
SL1 = structure + ATR(15m)×0.6; SL2 (tailgate) trails behind EMA21/VWAP band
Partial at TP1; move SL1 to BE once +0.75R; trail SL2
14) TRADE SCENARIOS (examples; educational only)
A) Swing (weekly box breakout)
• Long 4,012–4,016 acceptance, SL1 4,004, SL2 trail 21-EMA(15m)
• TP1 4,027, TP2 4,034 (runner 4,043)
• Probability: 62% if RVOL > 1.1 and 1H flips up
• Alt (reversal): Short 3,996 break & hold, SL1 4,004, TP1 3,988, TP2 3,976 (prob 55%)
B) Edge-Fade (inside the box)
• Short 4,010–4,012 rejection (bear wick / delta stall), SL1 4,016, TP1 4,000, TP2 3,996
• Long 3,988–3,996 absorption, SL1 3,983, TP1 4,000, TP2 4,010
• Probability: 58% while range persists; stand down when RVOL expands >1.2
C) Scalping (5m→15m calibrated)
• Long on pullback to 4,001–4,004 with EMA9>21 & RVOL line up, SL1 3,997, TP1 4,008, TP2 4,012
• Short on fail back under 3,999 with EMA9<21, SL1 4,003, TP1 3,994, TP2 3,990
• Use SL2 tailgate once +0.6R; max hold 3–5 bars
D) Continuation (momentum burst)
• Above 4,027 with footprint expansion → quick run 4,034 then 4,043
• Below 3,983 with RVOL>1.3 → 3,976 then test 3,965
• Manage with SL2 trailing behind micro-swings
15) RISK MANAGEMENT (XAUMO style)
• Position tiering: ½ size inside 3,996–4,010; full size only after acceptance outside the box with RVOL>1.1.
• SL1 = structure+ATR buffer; SL2 = tailgate trail. If TP1 hit → lock BE, trail for TP2.
• No add-ons if ADX(15m) falling and RVOL<1.0.
────────────────────────────────────────────────────────────────────
ARABIC QUICK SUMMARY (ملخص عربي)
• السوق متوازن حوالين 4000. البوابة لفوق 4010–4012، وتحت 3996.
• سيناريو الشراء: تثبيت فوق 4012 → 4027 ثم 4034/4043.
• سيناريو البيع: كسر 3996 → 3988 ثم 3976.
• إدارة المخاطرة: SL1 هيكل + ATR، و SL2 تريل ورا EMA/VWAP. خُد جزء عند TP1 وحرك الباقي BE.
FRENCH QUICK SUMMARY (Résumé)
• Marché neutre autour de 4000. Portes: 4010–4012 (haussier) / 3996 (baissier).
• Achat: acceptance > 4012 → 4027 puis 4034/4043.
• Vente: rupture < 3996 → 3988 puis 3976.
• Risque: SL1 structure + ATR, SL2 suiveur; prendre TP1 puis basculer BE.
🏆 Winners trade with XAUMO

how to Stop Your Money Losing Value??Have you ever felt that despite your hard work, your purchasing power is fading? This is an invisible war, a war where your cash is on the losing side. But there are practical ways to protect your assets and even grow them in the long term.
Hello✌️
Spend 3 minutes ⏰ reading this educational material.
🎯 Analytical Insight on Ripple:
XRP is testing a strong support while moving on the descending channel. A confirmed breakout with solid volume could drive a 20% rally, targeting 2.80$. 📊🚀
Now , let's dive into the educationa l section,
🛡️ Understanding the Invisible Enemy
Inflation is the primary enemy of your capital. This phenomenon slowly but surely erodes the value of your money. When the bank interest rate is lower than the inflation rate, you are effectively losing your wealth. The main goal is to find a way to achieve returns higher than the inflation rate.
🌍 The Mindset of a Preserver
The first step is to shift your mindset from a "saver" to an "investor". Your money should work for you, not the other way around. This mindset forces you to always look for opportunities that not only preserve but also increase the value of your assets.
📈 Smart Diversification
Never concentrate all your assets in one investment class. A mix of different assets such as stocks, commodities, and digital assets can form a strong shield against market fluctuations. The principle of diversification significantly reduces the risk of losing your entire capital.
⚙️ The Art of Risk Management
Preserving capital takes priority over making profits. Only enter trades with capital whose loss would not affect your current lifestyle. Setting a stop-loss for every investment position is a necessity, not an option. This protects you from negative market surprises.
🧠 Mastering Psychology
Fear and greed are two powerful and destructive emotions in the market. The fear of missing out causes you to lose golden opportunities, and greed pushes you to hold investments at price peaks. To succeed, you must overcome these emotions and stick to your strategy.
🔍 Identifying Opportunities with Trading views Tools
This section focuses on the practical search for assets with potential. Analytical tools can provide you with a better perspective for this task.
Market Scanner: Use this tool to screen thousands of assets based on specific technical criteria. You can find assets that have crossed an important moving average or are consolidating within a specific range.
Creating Charts: Create different charts for one asset and use indicators in combination. Comparing an asset's performance against others can reveal its strengths and weaknesses.
Sharing Feature: Share your ideas and analyses with the large community of users and benefit from their feedback. This helps you see hidden aspects of a situation.
🎯Top Recommendations for Action
First, have a written trading plan for yourself and do not take any action without it. Second, always withdraw a portion of your profits from the market and convert them into lower-risk assets. Third, never stop learning; markets are dynamic, and yesterday's strategies may not work tomorrow.
🚀 Final Word
Preserving the value of money is not an event; it is a continuous process. This path is paved with education, consistent analysis, and emotional control. By using the right tools and adhering to principles, you can protect your assets against inflation.
✨ Need a little love!
We pour love into every post your support keeps us inspired! 💛 Don’t be shy, we’d love to hear from you on comments. Big thanks , Mad Whale 🐋
📜Please make sure to do your own research before investing, and review the disclaimer provided at the end of each post

BTC/USD WEEKENDERBTC remains in a controlled downtrend, trading within a bearish range between 116.432 and 98.952, holding near the key 100.996 level. Thursday’s daily low was liquidated and sharply reclaimed — confirming absorption on both sides of the market. Price structure has now printed a fourth consecutive inside day, showing compression while red daily highs remain exposed. Yesterday’s New York session stretched higher into the close, keeping short-term bias constructive within the broader range.
The current plan into the weekend is to monitor for a measured retracement toward the 105.000 area — a zone aligning with short-term equilibrium inside the larger bearish range. This level provides a clean reference for liquidity behavior and potential continuation signals into next week.
The IMF warned this week of rising global risk complacency, with high debt and inflated assets raising the chance of a sharper correction. Meanwhile, crypto shows quiet structural strength beneath the surface. Whales absorbed around 30,000 BTC and 400,000 ETH this week near the 100.996 volatility low, aligning with steady ETF inflows and falling exchange balances.
Smart money moves first — absorption always precedes expansion.
Discipline defines conviction, not direction.
— Institutional Logic. Modern Technology. Real Freedom.

BTC/USDT – 4H Market Outlook BINANCE:BTCUSD
Bitcoin is currently trading around the 102,000 zone, sitting directly inside a well-defined demand region that has previously acted as an accumulation area. The market has aggressively sold off from the 116,000–118,000 rejection range and has now tapped into the deeper liquidity pocket highlighted on the chart.
Price action within this zone shows repeated wicks into the demand block, signaling that sell-side pressure is slowing down while buyers are beginning to react. Structurally, the market has swept liquidity below the previous lows and is now consolidating above the 100,000 psychological value area. This behavior typically precedes a corrective move or a full bullish reversal.
Based on the current reaction and the broader market context, my expectation is for Bitcoin to push upward from this demand zone and target the previous major high. The imbalance left on the move down and the inefficiency between 112,000 and 116,000 create a natural upside magnet for price once bullish momentum resumes.
My invalidation level remains firm: the stop loss sits on the red line around 98,200. A clean break below this level would signal that the demand zone has failed and that further downside becomes highly probable.
For now, as long as Bitcoin holds above the current demand structure, the bullish projection toward the previous high remains the primary scenario.

I AM FXHUNTER / GBPUSDGBPUSD symbol analysis: The price has a high probability of being supported by the indicated area and moving upwards.

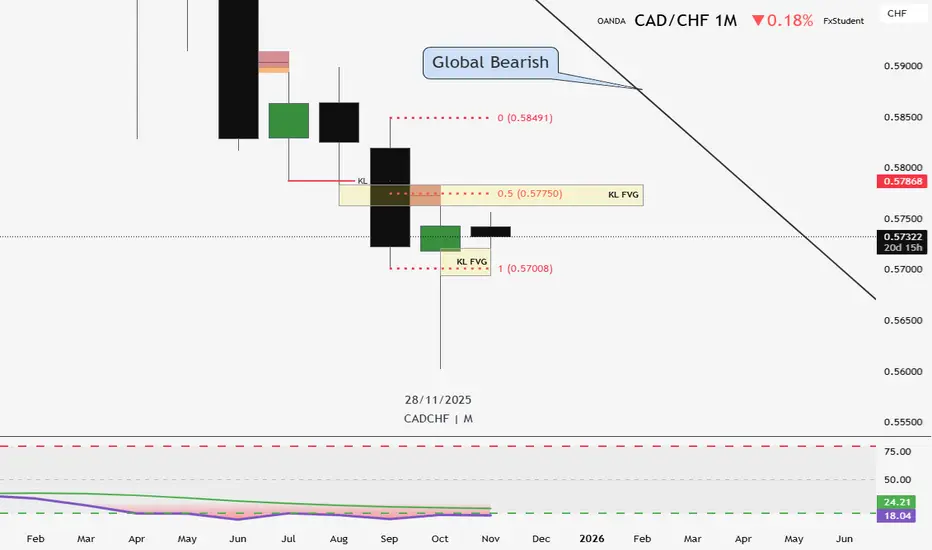
CLS CADCHF Analysis – Monthly, Daily, 1H📊 CLS CADCHF Analysis – Monthly, Daily, 1H
**Monthly (M):**
- A Clean Low Sweep (CLS) has been formed.
- The second candle is already confirmed.
**Daily (D):**
- Price has not yet reached the 50% retracement level.
- A Daily CLS has been formed.
- The second candle is currently developing.
**1-Hour (1H):**
- Market Structure Shift (MSS) has occurred.
- Price has already reached the 50% level.
**Trade Plan:**
- I’m waiting for price to retrace into the 61%–80% zone of 1H CLS before entering a long position.
- Target 1 (TP1): The 1H CLS range.
- Target 2 (TP2): 50% of the Monthly CLS, which aligns with a Key Level Fair Value Gap (KL FVG) and Key Level Previous Monthly Low (KL PML).
**Order Flow:**
- Currently bearish, so the ultimate goal is a conservative 50% retracement from the Monthly CLS.
OANDA:CADCHF
Mentor :
@David_Perk
I ARGUE THAT BITCOIN WILL FALL FURTHER!Bitcoin is building a bearish momentum and we’re likely going to expect further decline in price. The Daily chart remains quite bearish, the momentum of sellers keep getting stronger. The buyers seems not interested in current price. Therefore , I expect price to break below the $102k and sell further. A sell opportunity is envisaged.

FILUSDT - Massive bullish patternIt broke the main trendline with a massive daily candle.
A Golden Cross pattern is forming — the 25 EMA is about to cross above the 50 EMA, as you can see.
The coin has been in accumulation for 276 days, initially breaking down to sweep liquidity, and now it’s trading back near that range.
If it breaks upward, it could easily rally 300% or more from here.
Best Regards:
Ceciliones🎯

ETHUSD📉 Double Top – Strong Sell Opportunity
Pattern Overview
A Double Top is a bearish reversal chart pattern that typically forms after an extended uptrend. It signals that the buying pressure is weakening and that sellers are preparing to take control. This setup consists of two distinct peaks (tops) at approximately the same price level, separated by a moderate trough (the neckline).
When the price breaks below the neckline after forming the second top, it confirms the pattern completion and presents a strong sell opportunity.
Pattern Structure
First Top:
Forms after a prolonged bullish trend.
Marks the first significant resistance where price fails to advance further.
Volume typically starts to decline as buying pressure weakens.
Pullback / Neckline Formation:
Price retraces from the first top to find temporary support — this level forms the neckline.
The neckline acts as a critical level for confirmation.
Second Top:
Price rises again but struggles to break above the first top.
Often accompanied by lower volume, indicating reduced buyer interest.
A potential bearish divergence may appear on oscillators (like RSI or MACD).
Breakdown / Confirmation:
The sell signal is confirmed when the price breaks below the neckline with strong bearish momentum and increased volume.
This breakdown signals a trend reversal from bullish to bearish.
Trading Strategy
Entry (Sell Setup)
Entry Point: Enter a short position when the price closes below the neckline with strong bearish confirmation (candle body close below support).
Aggressive traders may enter slightly before the break if other indicators (divergence, bearish candlesticks) support the setup.
Stop Loss Placement
Place the stop loss just above the second top (or slightly above recent resistance).
This protects against false breakouts or pattern invalidation.
Take Profit Targets
Target 1: Equal to the height of the pattern (distance between the tops and neckline), projected downward from the neckline.
Target 2: Use support zones or Fibonacci levels as secondary targets for extended moves.
Risk–Reward Ratio
The ideal setup should offer at least 1:2 or better risk-to-reward ratio.
Wait for volume confirmation to avoid premature entries.
Technical Indicators Confirmation
Volume: Decreasing on second top, increasing on breakdown.
RSI: Bearish divergence (lower high on RSI while price makes equal highs).
MACD: Bearish crossover or divergence supports the sell bias.
Moving Averages: Price crossing below key moving averages (e.g., 20- or 50-period) adds confirmation.
Example Market Context
Suppose EUR/USD has been trending upward and forms two peaks near 1.1200 with a neckline near 1.1100.
After failing twice to break above 1.1200, price drops below 1.1100 with high volume — this confirms the Double Top.
Sell Entry: 1.1085
Stop Loss: 1.1215
Take Profit: 1.0965 (pattern height = 120 pips)
Key Takeaways
The Double Top pattern marks a transition from bullish to bearish momentum.
Wait for neckline confirmation to avoid false signals.
Combine pattern analysis with volume, oscillators, and market context for stronger confirmation.
Discipline in execution (entry, stop, and target) ensures effective risk management.
