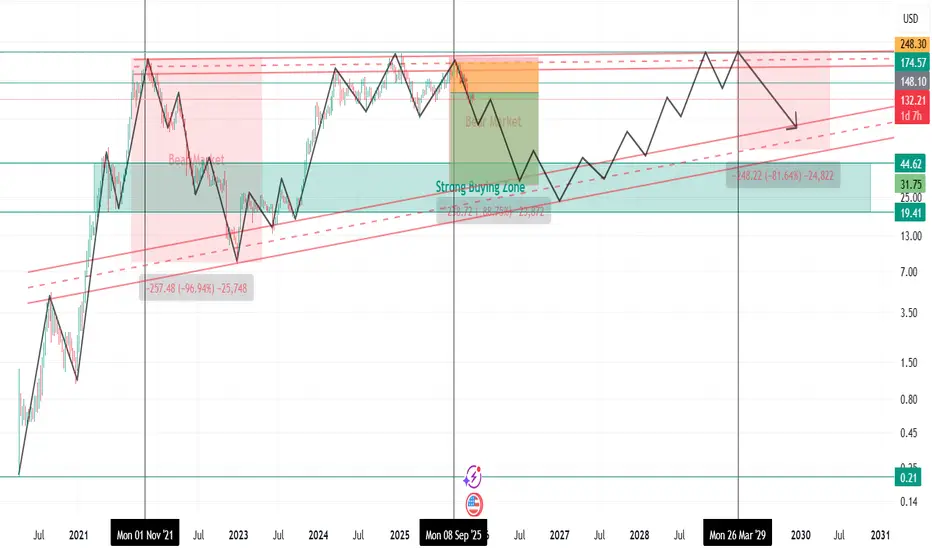
SOLUSD Long-Term Market Cycle Analysis |Bear Market Phase ActiveSolana (SOL) was listed on 10 April 2020 at around $0.21 .
During the 2020–2021 bull market (Altseason Phase-4) , SOL showed an exceptionally strong rally after listing and formed its all-time high near $260 on 6 November 2021 .
From that point, a major bear market started.
Between 7 April 2021 and 29 December 2022 , Solana remained in a clear downtrend , printing continuous lower highs and lower lows.
Price dropped from $260 to nearly $8 , resulting in a −96.9% correction , which is typical for high-beta altcoins during bear cycles.
A new bull market phase began on 30 December 2022 , but according to current market structure and cycle analysis , this bull phase has now ended around 13 September 2025 .
The overall structure has shifted bearish , and Solana is currently trading in a confirmed bear market phase starting from 14 September 2025 .
Key Resistance Zones (Strong Reversal Areas):
$148
$174
$210
These levels are expected to act as major supply zones , where strong selling pressure and reversals are likely.
Bear Market Outlook & Risk Projection
Bear market may extend until October 2026
A further downside move of up to −88% is possible within this cycle
If such a correction occurs, there is an 80% probability that SOL could trade in the $45 – $30 range during September–October 2026
Key Support Zones (Accumulation Areas):
$80
$45
$30
Trading Bias
* Avoid long positions during this phase
* Focus on short setups near resistance zones
* Trade with strict risk management and confirmation
Disclaimer:
This analysis is based on historical market cycles, structure, and technical behavior .
Not financial advice. Always manage risk.
Beyond Technical Analysis
Tesla Stock explained by Elliott Wave PrinciplesBack in March, Elliott Wave predicted a Bullish move for TESLA to around $500(link below). NASDAQ:TSLA was at around $230 at the time. Furthermore, Elliott Wave predicted that this Bullish move would have 3 Major waves. Fast forward 7 months later and we get a Major 3 wave move shown in Green as A,B and soon C. Elliott Wave is brilliant tool for analysis and helps to understand market dynamics.
With Wave A and B(Green) complete, Wave C expresses itself in 5 Waves namely 1,2,3,4 and 5 shown in Black. Using Elliott Wave Principles CORRECTLY offers precision and insight into the markets. What many term as chaos can actually be patterned. Did you cash in on this move that was predicted in March!?

EUR/USD: Sloping Inverse Head & Shoulders Breakout Toward 1.178Hi!
Let's analyze EURUSD
EUR/USD has completed a sloping Inverse Head & Shoulders formation, a pattern typically signaling trend reversal after a prolonged decline. The left shoulder, head, and right shoulder are well-defined, and price has decisively broken above the descending neckline, confirming the bullish structure. The breakout also aligns with the broader rounded bottom forming since October, adding confidence to the upward bias.
Price is now trending inside a steep ascending channel. As long as the pair respects the channel’s lower boundary and the retest zone around 1.1650–1.1670, bullish continuation remains favored. Short-term corrective dips into this area may offer potential re-entry opportunities.
The measured target of the sloping H&S projects toward 1.1780, which coincides with a significant supply zone. This confluence is likely where the next major reaction may occur.
Overall, the structure is logical and valid: reversal patterns, channel momentum, and neckline confirmation all support a continuation toward the highlighted target. Bulls remain in control unless price falls back below 1.1620, invalidating the upside scenario.
Disclaimer: As part of ThinkMarkets’ Influencer Program, I am sponsored to share and publish their charts in my analysis.

Gold prices are fluctuating upwards.Capital and Fundamentals: Dual Protection from Supply-Demand Dynamics and Geopolitics
1.Dual Backing from Central Bank and Institutional Capital
The global upsurge in central bank gold purchases persists. The net gold purchases by central banks worldwide reached 634 tons in the first three quarters of 2025, and 95% of the surveyed central banks plan to continue increasing their gold holdings in the next 12 months. The price range of $4,250 - $4,260 is close to the official gold purchasing cost zone, forming a rigid support for gold prices. In terms of capital flow, gold ETFs have attracted over 2.6 billion yuan in capital in the past 30 days. China was the largest single source of net inflows into gold ETFs globally in November. Institutional confidence in long-term allocation remains unshaken; although short-term profit-taking may occur, it will not affect the medium and long-term upward trend of gold prices.
2. Supply-Demand Gap Strengthens Long-Term Support
The global annual growth rate of gold mining output is only 1% - 2.9%. The global gold supply-demand gap will exceed 800 tons in 2025, and the cumulative gap in China from 2025 to 2027 will soar to as high as 1,888 tons. This huge gap mainly stems from the contradiction between the slow growth of mined gold output and the skyrocketing demand. Specifically, the demand for gold in the technology sector (such as photovoltaic cells and chips) has surged by 30% - 45% year-on-year, and the demand for retail consumption has also increased by 29% year-on-year. The pattern of tight supply relative to demand has laid a solid fundamental foundation for the steady rise of gold prices.
3. Geopolitical Risks Drive Additional Safe-Haven Demand
The peace talks between Russia and Ukraine have reached a stalemate. The United States' seizure of Venezuelan oil tankers has escalated tensions between the two countries, and the situation in the Middle East remains intractable. Persistent global geopolitical uncertainties have provided sustained safe-haven buying support for gold. Meanwhile, silver has hit an all-time high, approaching $63 per ounce. The significant linkage effect across the precious metals sector has greatly boosted market sentiment toward gold, further reinforcing the positive momentum in the gold market.
Gold trading strategy for next week
buy:4265-4275
tp:4290-4330-4330

Improved capital flows + strengthening technical indicatorsCapital Flow: Diminishing Selling Pressure & Institutional Accumulation on Dips
The capital side has shown the characteristic of "structural improvement": ① The open interest of perpetual contracts has dropped by nearly half since October, with excessively crowded trades cleared out, making the market structure healthier. ② On-chain data indicates that institutional wallets have been continuously increasing holdings within the $88,000 - $91,000 price range. Coupled with the supply-side reform where the U.S. strategic reserve freezes 6% of the circulating supply, the tradable chips have contracted. ③ The capital flow of ETFs has seen a marginal recovery. Some institutions have been accumulating positions through OTC channels amid the volatile market. The volume of large orders of 50 coins or more per transaction has increased by 12% month-on-month, and the selling pressure has entered a state of exhaustion.
Policy Dividends: Regulatory Confirmation of Rights & Strategic Reserve Backing
U.S. crypto policies have formed long-term favorable support: The Bitcoin Strategic Reserve Act has incorporated 200,000 BTC into the permanently non-saleable reserve, which has essentially restructured the supply-demand pattern. The coordinated regulation between the federal and state governments has established the world's first multi-level compliance system, reducing institutional concerns about policy risks when entering the market. Although short-term policy dividends have not directly driven price increases, they have provided a "value anchor" for the $90,000 mark, avoiding the risk of sharp declines and forming a margin of safety for long positions.
Bitcoin trading strategy
buy:89000-90000
tp:92000-93000-95000
sl:88000

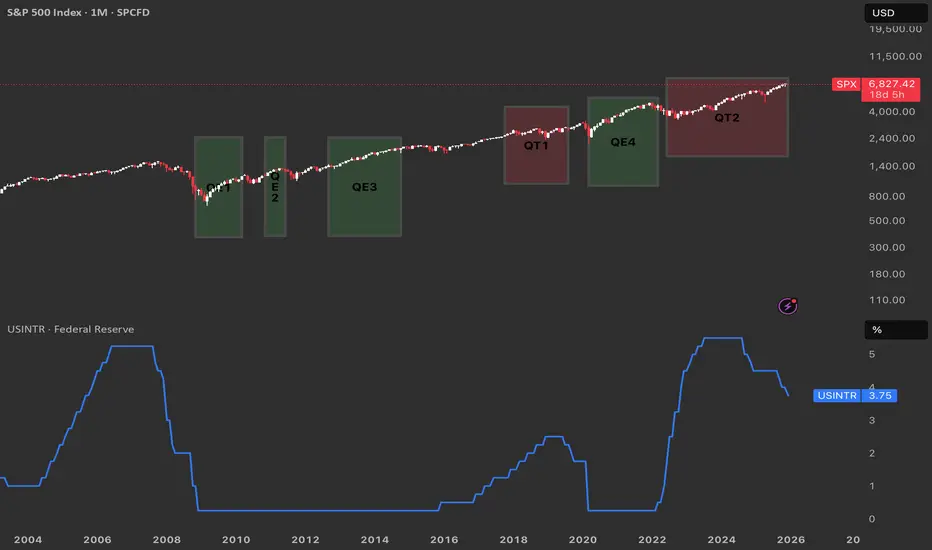
From QE to QT. Reading the Fed’s Cycle from the ChartQuantitative Easing (QE) is when the Federal Reserve buys large amounts of Treasuries and mortgage‑backed securities to expand its balance sheet, inject liquidity, and push interest rates lower across the curve.
Quantitative Tightening (QT) is the opposite: the Fed allows its bond holdings to roll off or sells securities, shrinking the balance sheet and tightening financial conditions.
QE near zero rates
Historically the Fed has only launched QE when the policy rate was pinned near zero and conventional rate cuts were basically exhausted, as in 2008–2014 and again in 2020–2022.
QT at elevated rates
By contrast, QT has been used only once the Fed had already hiked rates to clearly positive, “elevated” levels and wanted to normalize the balance sheet from those earlier QE waves.
What ending QT in December could imply
QT effectively ended around 1 December, it suggests the Fed may feel comfortable pausing balance‑sheet tightening while rates are still high, opening the door later to cuts if growth or markets weaken.
In that setting, the market could start to price a shift from outright restriction toward neutrality, which often coincides with more two‑sided volatility in risk assets.
Echoes of the QT1 → QE3 window
The period after QT1 and before QE3 saw rates come off their highs and then a major shock (COVID-18 crysis) that helped justify easier policy again.
A similar path is plausible here: a “black swan” type event in the coming year could hit growth or credit, force a rapid drop in rates, and trigger a new QE‑style response that would rhyme with the QT1‑to‑QE3 sequence your chart visually captures.
BTC, The Spiral of Doom: Multi Spacetime Analysis (-O_o-)Behold the Golden Spiral of Destiny! We are witnessing a textbook collision between sacred Sanskrit geometry and market exhaustion.
1. What goes up... usually hurts coming down. The moon lost its magnetic pull, and gravity decided to stop being polite. Result? A 13% face-plant from the highs in merely 7 days, then continued dumping. We attempted a bounce at the spiral line, failed miserably, and are currently trapped in the purple box until further notice.
The Rejection: Notice how price is struggling to breathe? The key level killing the momentum right now is that red line at $94k.
The Current Box: We are currently trapped between $88,750 and $94,500. Having crossed the second line of the spiral without a breakout, the structure is heavy. The spiral demands a sacrifice, and right now, and gravity is there to help. The ceiling is solid.
2. The Weekly View: "The Hangover" While the Daily chart shows the immediate slide, the Weekly chart is likely screaming momentum divergence. The massive extension above the moving averages indicates we stretched the rubber band too far.
We are in a mean-reversion phase. The Weekly candles are looking for a "higher low" to rest on, and the Spiral suggests that resting point is much lower than where we are sitting today.
Other factors:
The Macro Headwinds: Before we look at the targets, understand why the spiral is heavy. Global liquidity is actively tightening.
- Bank of Japan Fears: Renewed fears of interest rate hikes from the BOJ are draining the "cheap money" that often fuels crypto speculation.
- ETF Outflows: Institutional flows have reversed, with record outflows (over $1.2 billion) confirming a "risk-off" shift among the big players.
- Fed Stance: Hopes for aggressive rate cuts have faded, leaving markets without the liquidity injection needed to bring valuation and sustain it above $98k, even after december hawkish rate cut.
Outlook:
-Scenario A: The Spiral Slide (Bearish Primary) Probability: 80%
The Move: We fail to break the box lid at $94,565. Price bleeds slowly to the bottom of the consolidation, then flushes violently.
Target 1: We slice through the "Weak Demand Zone" around $82,000 like butter. (Note: Analysts see $80k as a confirmation level for a deeper bear trend).
Target 2: The spiral guides us perfectly to the "Strong Demand Zone" at $69K. This is the "Golden Pocket" retest of the previous cycle cheeky highs.
- Scenario B: The God Candle (Bullish Invalidation) Probability: 20%
The Move: A sudden, high-volume reclamation of $98,000.
Why this number? Breaking back above $98k puts us back inside the spiral's previous arc and proves the "Box" was actually a bear trap. Until then, any pump is just a lower high.
Final Word: Sanskrit Geometry has spoken. As long as we are below $94,500, the path of least resistance is down to $69,100. Keep your bids low and your stops tight.

$CGC: Monster upside possibleGM gents,
I know the stock moved 50% in one day. Since it's related to Trump, people will likely fade this because they hate him. But hear me out:
Every time there was a monthly uptrend signal on the chart, we saw an average rally of 341.75% (or 12.97 times the ATR value at the time of the signal).
Adjusting to today's ATR, that would equate to surging towards $35.72 within the next few months if the signal works.
Do with that what you will...
Best of luck!
Cheers, Ivan Labrie

Crude Oil short...GM gents, hope you're doing alright.
It seems Crude Oil was not cheap enough, technicals indicate it can crater from here for the next 2 months give or take...
Implications on macro are bullish risk assets, with some lag after the effect of cheaper energy materializes on earnings. For now the 70% spike in Nat Gas needs to be dealt with, although it seems that market topped already.
Signal is invalidated above the red dashed line.
Best of luck!
Cheers,
Ivan Labrie.


ETH versus the worldNot pretending to be an expert but I think that what we called higher highs and higher lows.

$ETHUSD: Mid term viewGM gents, hope you enjoy this video as I take you through all the relevant variables that I'm monitoring in the short and mid term in Ethereum.
Best of luck!
Cheers,
Ivan Labrie.

HERO ZERO Idea, Either Dhooom OR Dhadaaam : JPASSOCIAT JPASSOCIAT LTP 4.20
Ready For 4.90/ 6.30/ 7.60/ 8.40
If surpasses and sustains, Than 11.60/ 13.40/ 16/ 18
If surpasses above levels and sustains, Than, 20/ 23/ 26/ 31++
For investors with a long-term perspective and the ability to trail Stop Loss in sync with their risk apetite (Would suggest to review at each level shared)
Trade as per your risk management and investment plan.
#AtmanirbharInvesting

Bitcoin Daily Bear H&S The obvious scenario to lean into swing shorts. Everyone has an eye on this, and I don't think you can ignore it tbh.

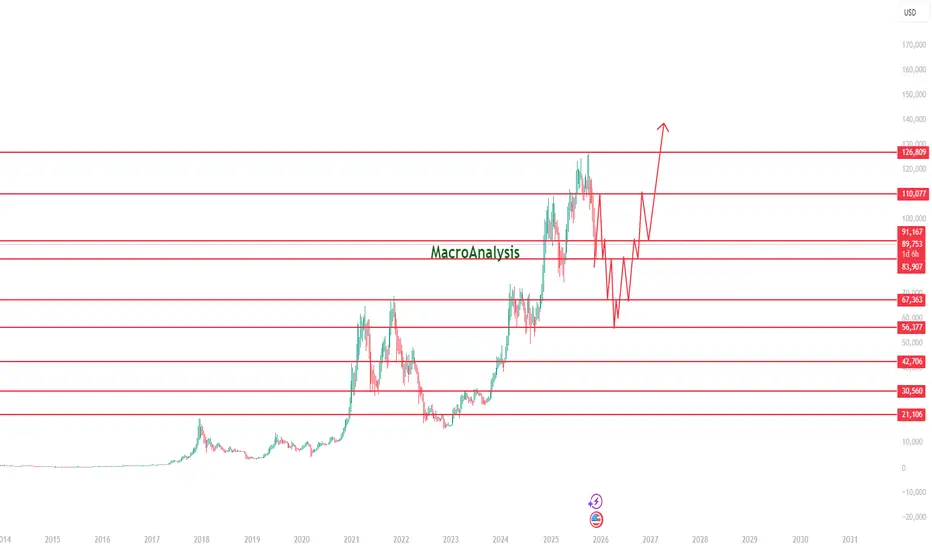
BTC Macro Roadmap: Multi-Year Support/Resistance Structure & ProThis chart presents a long-term BTC roadmap based on major weekly and monthly support/resistance zones, reflecting how BTC typically behaves during mid-cycle phases. Price has recently reacted to the 110K macro resistance, triggering a corrective leg that fits the broader rhythm of previous BTC cycles.
The projected path highlights a realistic multi-stage structure:
• Mid-Cycle Corrective Phase
BTC is forming lower highs and lower lows after the rejection from 110K, with a likely retest of key demand zones between 83K → 67K. Deeper liquidity sweeps into the 56K region remain possible before establishing a macro higher low.
• Accumulation Zone
Inside this lower region, BTC historically creates sideways, choppy movement—sweeping liquidity both directions as market participants reposition. This mirrors prior mid-cycle accumulation phases and sets the foundation for the next macro advance.
• Recovery Phase & Re-Accumulation
Once accumulation stabilizes, structure favors a recovery back toward 91K → 110K, driven by regained momentum and market strength. A successful breakout from this zone signals the beginning of the next expansion wave.
• Macro Expansion Phase
Clearing 110K opens the door toward 126K–140K, the next major macro resistance region and potential cycle extension target.
This idea isn’t a prediction—it’s a structural map, focused on how BTC historically behaves around cycle midpoints: parabolic advance → correction → accumulation → breakout → expansion. The chart emphasizes market memory, key levels, and BTC’s typical volatility during expansion phases.
Macro Levels to Watch:
• 110,077 – major resistance, recent rejection zone
• 91,167 / 89,688 – mid-level pivot controlling short-term direction
• 83,907 – key support that preserves bullish structure
• 67,363 – strong historical demand and liquidity magnet
• 126,809 – next major resistance above ATH
Tether Atom Bomb Gives Rise to Rainbow StablecoinWill crypto see a bull market continuation for the first time in history?
Or are we witnessing a typical market cycle that leads to the end game?
Follow me on X @BLUVNBU

S&P 500 Daily Chart Analysis For Week of Dec 12, 2025Technical Analysis and Outlook:
In the course of the recent weekly trading session, the S&P 500 Index exhibited significant gyrational volatility, reaching a Key Resistance level at 6,895 before retracting to the Major Mean Support level delineated at 6,816.
At present, this market positioning indicates strong potential for continued downward movement, with the primary objective focused on targeting the Mean Support level at 6,755 via heavily traded Mean Support at 6,816.
Nevertheless, it is crucial to recognize that, given current market dynamics, there is a substantial probability of a robust price surge to retest the critical Key Resistance at 6,900, which may be accompanied by a strong rebound to the Outer Index Rally target at 6,945.

EUR/USD Daily Chart Analysis For Week of Dec 12, 2025Technical Analysis and Outlook:
During the most recent trading session, the Eurodollar currency rose sharply, reaching the Mean Resistance level at 1.175, via the Mean Resistance level of 1.167. Current market conditions indicate that the price may pull back to the critical Mean Support level at 1.169.
However, it is also crucial to monitor the breakout level for this currency to the upside by a rise to the Interim Inner Currency Rally 1.178 via Mean Resistance 1.175.
Conversely, on the downside, a major re-ignited retracement may occur from the completed Interim Inner Currency Rally 1.178, with the possibility of extending to the Mean Support 1.163.

Bitcoin(BTC/USD) Daily Chart Analysis For Week of Dec 12, 2025Technical Analysis and Outlook:
During the most recent trading session, the Bitcoin market navigated within a channel defined by the Mean Resistance level at 93,500 and the Mean Support level at 89,300.
Current market sentiment suggests an upward move, with price action pointing to a retest of the Mean Resistance level at 93,500. Additional targets include the Interim Inner Coin Rally at 98,000 and a subsequent, significant objective: the next Interim Coin Rally at 102,500.
Given the prevailing dynamics of the cryptocurrency market, there exists a potential for an intermediate pullback to the Mean Support level of 89,300. This pullback could extend to further Mean Support levels at 86,400 and 82,400, ultimately culminating in the anticipated Outer Coin Dip at 78,500 before a notable upward momentum is expected to occur.


Why Pullback Happen In XAGUSD SilverThis video explains why a pullback occurs in XAGUSD Silver after a strong rally on the daily timeframe. The analysis focuses on how price reacts after extended momentum, how profit-taking and structure pauses develop, and how the market resets before the next directional move. By observing candle behavior, swing structure, and reaction zones, this breakdown highlights the natural process behind a pullback following a rally.
The objective of this video is to help understand daily timeframe price behavior in Silver through market structure and momentum analysis
⚠️ Regulatory Compliance
This content is provided for educational and awareness purposes only.
It does not constitute buy/sell or investment advice.
I am not a SEBI-registered advisor.
Please conduct your own research or consult a qualified financial professional before making any trading decisions.


MERL Update🚨📊 MERL Update
MERL has broken out above the red resistance zone 🔴🚀.
If momentum continues to hold, the first target will be the green line level 🟩🎯.
