XAUUSD Price Action Analysis
Gold is trading near the 5026 level in the early trading session. Price action around the 5010 zone is being monitored as a short-term demand and liquidity area. Holding above this level may support an intraday move toward the 5080 region.
A sustained break below 4995 would invalidate the current bullish intraday structure.
This analysis is shared for educational and observational purposes only. Market conditions may change, and all trading decisions remain the responsibility of the trader.
Beyond Technical Analysis

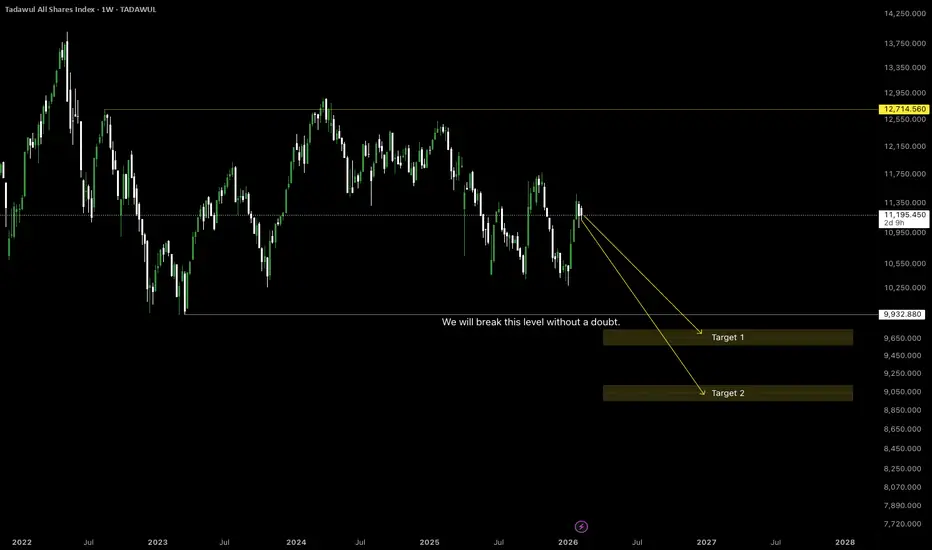
TASI ShortThis is my personal analysis, what i see from the chart is we are going down and im sure deeply that we are will break this level 9932, it's just matter of time.
TASI target is the 2 yellow boxes ( target 1 , Target 2 )
All the best
SILVER H1 | Price Action & Liquidity-Based AnalysisSilver previously tapped into a higher-timeframe bearish order block, which caused a sharp impulsive sell-off. The strong displacement confirms institutional selling pressure from premium levels.
Following the expansion, price swept sell-side liquidity below the prior lows, completing a classic liquidity grab. This was immediately followed by a bullish reaction, signaling short-term demand entering the market from discount.
Price is now retracing upward and approaching a key internal bearish order block, which acts as the nearest supply zone.
Key Trading Areas
POI / Demand Zone:
74.80 – 76.20
(Liquidity grab + bullish reaction area)
Internal Bearish Order Block (Supply):
88.50 – 90.50
(High-probability reaction zone)
Bullish Scenario (Intraday Continuation)
Entry consideration from POI (74.80 – 76.20)
Requires lower-timeframe bullish confirmation (HL, BOS, displacement)
Targets:
TP1: 82.00
TP2: 88.50 (internal OB)
Stop Loss:
Below liquidity low → below 73.80
Bearish Scenario (HTF Continuation)
If price reaches 88.50 – 90.50 and shows rejection,
Look for bearish confirmation on lower timeframes,
This would signal continuation of the larger bearish structure.
Bearish Targets:
• 82.00
• 76.00
• Sell-side liquidity lows
⸻
Conclusion
Liquidity has already been engineered.
Current move remains corrective until internal supply is broken and accepted.
Direction will be decided at internal OB reaction — patience is key.
Bias: Neutral → reactive
Method: Pure price action, structure & liquidity
Rule: Confirmation before execution

Order Block Tapped – Monitoring for Rejection vs. BreakoutGold has officially arrived at the $5,090 – $5,115 Bearish Order Block, a critical zone that previously acted as a "trap" for buyers before the recent crash. The price is currently reacting to this level, and while we are seeing a "small rejection" in the form of upper wicks on the 1H and 4H charts, the overall structure remains in a precarious balance.
Technical Evidence at the Block:
The Tap: The price hit the lower boundary of the supply cluster near $5,081 earlier today.
Rejection Signs: We are seeing initial signs of selling pressure as the RSI nears the overbought territory (60+) on smaller timeframes, which often triggers a "mean reversion" back toward the psychological $5,000 handle.
Liquidity Context: This Order Block sits right at the 50% retracement of the massive January collapse. Historically, smart money uses this "Premium" zone to close out long positions or enter new shorts.
Wait-and-See: With the US monthly jobs report delayed to February 11, the market is currently lacking the high-volume catalyst needed to break through this wall Decisively
The Rejection Case (Short-Term Bearish):
If 4H candles continue to close with long wicks inside the $5,090 – $5,115 zone, expect a "small rejection" back toward $4,937 – $4,950 (The Discount Demand).
The Breakout Case (Long-Term Bullish):
A clean daily close above $5,115 would invalidate this Order Block, turning it into a "Breaker Block" and opening the doors for a parabolic move toward $5,269 – $5,400.
Current Key Levels:
Immediate Resistance: $5,090 – $5,115 (The Tapped OB)
Immediate Support: $5,000 (Psychological Floor)
The "Safety" Zone: $4,937 (200-period EMA)
Final Thought: The Order Block has been tapped. We aren't chasing the move here—we are waiting to see if the rejection holds. If the bears can't push it back below $5,000, then this "rejection" is just a pause before a massive breakout.

Gold prices recover - consolidating below 5180⭐️GOLDEN INFORMATION:
Gold price (XAU/USD) attracts some sellers near $5,035 during the early Asian session on Tuesday. The precious metal edges lower amid improved risk sentiment and some profit-taking. Traders brace for key US economic data later this week, including delayed employment and inflation reports.
The yellow metal retreats after rising over the previous two days, as traders returned to equities on improved risk sentiment. The S&P 500 extends the rally to near its all-time highs following a volatile week. Additionally, hopes for the United States (US)-Iran negotiations could undermine a traditional asset such as Gold. Iran’s President Masoud Pezeshkian described the Friday nuclear talks with the US as “a step forward,” even as he pushed back against any attempts at intimidation
⭐️Personal comments NOVA:
Gold prices are stable, trading sideways around 5000, consolidating below resistance levels of 5080 and 5182.
⭐️SET UP GOLD PRICE
🔥SELL GOLD zone: 5180 - 5182 SL 5187
TP1: $5160
TP2: $5140
TP3: $5120
🔥BUY GOLD zone: 4903- 4901 SL 4896
TP1: $4920
TP2: $4940
TP3: $4955
⭐️Technical analysis:
Based on technical indicators EMA 34, EMA89 and support resistance areas to set up a reasonable SELL order.
⭐️NOTE:
Note: Nova wishes traders to manage their capital well
- take the number of lots that match your capital
- Takeprofit equal to 4-6% of capital account
- Stoplose equal to 2-3% of capital account

Raymond Limited : A 50% upsideRaymond Limited
New CFO taken over.
Stock at its base 410-420
A bit early entry, but 2% risk worth taking.
Enter between 420-425
SL - Below 411 (Closing Basis)
TGT 600+

Prop trading: capital under management or self-insurance?The market is changing rapidly, not gradually — it knows how to switch . Yesterday there were neat breakouts and trend continuations, today there are sudden shoots, sharp reversals, knocking out stops and moving on the news, which you will see after the candle has made a maximum and a minimum at the same time.
There is a lot of talk right now that the market has become more manipulative, nervous and volatile . And let someone argue with the wording, the essence remains: in such conditions, it is not the smartest and not the fastest who survives, but the one who respects the risk .
And here prop trading suddenly stops being a fashionable way to get money fast , and begins to look like ...** a protective contour . And not only for beginners, but also for strong traders who have already seen how easily the market takes away capital from those who decide to break the rules a little .
Disclaimer: the material is educational. Not an investment council.
1) What is prop trading really?
Prop trading (proprietary trading) — trading on the company's capital. In classical logic, everything is simple:
the firm allocates capital (or gives a risk limit),
the trader trades according to the rules,
profits are divided by agreement,
Loss is limited: there is a loss limit after which trading stops or conditions become tougher.
The main truth about prop sounds dry, but it's more important than all the advertising:
A prop firm does not buy signals — it buys manageable risk .
A stable trader is more valuable to a company than a genius who sometimes makes X's, but periodically makes a “peak" in drawdown.
---
2) Why prop has become relevant again right now
There is a feeling that the market has become tougher towards discipline in recent years. And this is evident from the typical stories.
Previously, you could afford to disrupt the risk a little bit : increase the leverage, move the stop, sit out the negative - and sometimes the market returned. Today, such a number increasingly ends the same way: a sharp move against a position , a series of liquidations, and you look at the chart not as a trader, but as a person who has just dropped an important thing from his hands.
Many previously successful traders lost deposits not because they forgot how to analyze, but because:
stopped complying with the risk,
began to catch up with the market,
confused confidence in the setup with the right to ignore the stop.
And against this background, the professionals had a very pragmatic idea.:
what if we stop substituting fixed assets for a series of mistakes or a “bad phase of the market"?
Hence the new perspective on prop: a prop firm is not easy money , but a way to take the risk of capital loss outside , keeping for yourself what you know how to trade.
The meaning is simple:
you risk your capital minimally (the cost of an attempt/subscription),
and you work at a volume that would otherwise be psychologically and financially too dangerous,
in fact, you shift the risk of a complete loss of the deposit to the prop rules.
---
3) The two worlds of prop firms: Don't confuse them
Today, the word prop firm refers to very different models.
A) Classic prop desks (traditional prop)
more often offline or hybrid,
selection through an interview/internship/verification of real trading,
capital is really “branded”, relationships are built for a long time.
Advantages: A more transparent model, less marketing, and a higher chance of a real career .
Disadvantages: harder to get in, stricter requirements, sometimes limited markets/instruments.
B) Online prop with challenges (evaluation model)
entry through a paid assessment,
Strict drawdown/day/series limits,
After completing the course, you will receive a “funded” account and profit-split payments.
Advantages: Accessibility, quick start, clear “entrance ticket".
Disadvantages: the rules are sometimes designed so that you compete not with the market, but with the mathematics of the rules.
---
4) A new class of traders: acceleration from $100 to “millions”
There is another reason why the prop theme has become popular: the market has brought a whole wave of people who sincerely believe that trading is overclocking .
You've probably seen these scenarios:
deposit of $100–$300,
shoulder 50–100x,
An all-or-nothing bet,
a few successful attempts — and the feeling that the grail has been found,
then one candle, and “why am I always being carried out?”
The problem is not that overclocking is impossible as a fact. The problem is that:
luck can be repeated a couple of times ,
but system trading cannot be built on a constant huge risk , because mathematics and variance will catch up with you.
The market can deliver a series of victories. But the market has never signed a contract to forgive such maneuvers . Sooner or later, the inevitable happens: one impulse against a position erases everything.
And that's where prop firms turn out to be for different :
A prop can give a beginner discipline and a loss ceiling (if he is willing to obey the rules),
experienced — to protect the fixed capital from a period of mistakes, emotions or the wrong phase .
5) What are you really paying for in the prop model
Prop is sold as capital , but in reality you are buying a combination of four things:
1. A risk framework (restrictions that cannot be persuaded)
Prop does not allow you to “merge everything to zero”. And sometimes it saves you from the most dangerous enemy— your own impulse.
2. The psychological contract
When you know that you will be turned off for a certain drawdown, you suddenly begin to respect the stop.
3. Infrastructure and access (not always)
Some models have a platform, data, fees, and conditions.
4. Funnel (if the business is built on paying for attempts)
If the company earns mainly on challenges, you are the client. If you are a trader, you are a partner. These are different worlds.
---
6) The advantages of prop trading when it suits your style
✅ Limited worst case scenario
Ideally, you only risk the cost of the attempt, not the entire deposit.
✅ Discipline is built into the rules
You don't need to reassemble your willpower every day. The frame will do it for you.
✅ Rapid growth of responsibility
You start thinking like a risk manager, not an X-hunter.
✅ Potential scalability
If you are stable, the company can increase the limits / give more accounts / improve the conditions.
---
7) Cons and pitfalls: Where even the strong ones break
## The main enemy is not the market, but the rules
Many fail not according to strategy, but according to the mechanics of limits.:
daily loss limit,
maximum drawdown,
equity calculation (including floating minus),
bans on news/overnight/weekend,
requirements for consistency.
The same regulation can be the norm for a scalper and a death sentence for a swing trader.
❌ Trailing drawdown is a hidden mine
If the maximum drawdown is considered from the peak of equity (and tightens after your profit), an unpleasant paradox arises: you have earned — and the usual rollback of the strategy begins to look like a violation.
This changes behavior: the trader is afraid of normal pullbacks, closes profits too early, and worsens expectations.
## Conflict of interest in the evaluation model
If a company earns mainly by paying for attempts, it is beneficial for it that there are many attempts, but only a few pass.
## Execution, spreads and toxic flow
Delays, widening spreads, paragraphs about “abuse” and latency — all this should be read in advance, not after problems.
❌ Consistency as a KPI trap
Restrictions on an “overly profitable day” can provoke overtrading and trading for the sake of the report.
8) Who is prop suitable for and who is not
### Suitable if you:
you already know how to trade and want to scale the risk without threatening the fixed capital,
understand the series, the variance, the inevitability of drawdowns,
ready to live by the rules.
### Not suitable if you:
looking for “magic capital" without a system,
trading martingale/averaging without restrictions,
emotionally “catching up” after the cons,
not ready to read the rules as a legal document.
---
9) The checklist: what to watch BEFORE payment
A) The mathematics of constraints
* Drawdown: fixed or trailing? by balance or equity?
* daily limit: on closed trades or on floating PnL?
* what happens in case of violation: closing positions or blocking?
* minimum trading days? a one-day profit limit? consistency?
B) Terms of trade
* fees/spreads, especially on volatility,
* is it possible to trade news,
* is it possible to hold positions through the night/weekend,
* Style restrictions: scalping, arbitration, copying.
C) Payments and legal aid
* payment frequency, minimum threshold, KYC,
* conditions for canceling payments in case of “violations”,
* reputation and payment history (preferably verifiable).
---
10) How to trade prop in an adult way so that it helps, not hinders
1) Choose a company for the style, not the style for the company.
A swing trader in tight daily limits will suffer.
2) Immediately build a risk plan for the limits.
Not “how much I want to earn", but:
what is the risk of the transaction,
how many cons are allowed in a row,
where is the stop for the day,
what I do after the series.
3) Not to “finish off the target”, but to protect statistics.
The best prop trader is not the one who made x, but the one who does not break down in a bad week.
4) Keep a journal as a risk manager.
Reason for entry, invalidator, violation of rules, quality of execution.
---
All the arguments about prop trading sound easy on paper. But the market doesn't read the articles — the market checks in practice. Therefore, we decided not to limit ourselves to theory.
Our team also accepted the challenge of the time and decided to go all the way from the inside out on their own experience:
test our trading strategy under real-world prop constraints,
understand where the rules really discipline and protect,
and where they start to get in the way and require an adaptation of the approach.
We took a challenge from a popular prop firm and will share with you not only the final results , but also the process itself:
how do we build a risk plan, how do we conduct transactions, what difficulties arise, what needs to be changed, and what is confirmed in practice.
The market has become more complicated. But this is not a reason to play all-in. This is a reason to grow up: build a system, keep the risk and survive where others burn out.

ETH — Price Slice. Capital Sector. 1839.34 BPC 3© Bolzen | The Architect | BPC Framework
Bolzen Market Institute
🏷 ETH — Price Slice. Capital Sector.
Publication date on TradingView: 08.02.2026
🏷 1839.34 — at the time of publication, the price had not been reached.
🏷 BPC — The Bolzen Price Covenant — Strength Index: 3
The energy block reflects the intentions of capital. The direction of capital flow is determined dynamically. The key mechanism of liquidations lies in the tendency of price to gravitate toward areas where real participants of the system are concentrated — regardless of whether they are in longs or shorts.
Such zones represent areas of asymmetric advantage: when the price approaches them, some participants are forced to close positions at a loss, others lock in profits, and a third group (institutional players) uses this flow to enter in the direction of the next concentration zone.
Institutional players generate energy blocks through miners. Subsequently, these energy blocks form the range of capital movement across various timeframes for exchange speculators. However, the ultimate goal in ensuring liquidity is to reach the energy block mark.
The results are presented in the dashboard for the international arena. It is necessary to manually determine, without third-party software, the direction of the impact node and the concentration of real system participants. This is achieved through high cognitive and intellectual effort — without templates and solely through pure chart analysis.
Three-dimensional analytics is intellectual property. The methodology is closed and does not require evaluation from the standpoint of the old world. We offer the ability to think but do not provide trading recommendations and are not educators.
We thank you and regard TradingView as an impartial platform for demonstrating the transition into a new analytical reality.
Quantum structure of obligations and capital movement in price formation within energy blocks.
🏷 Vertical chart — Energy Grid Dashboard.
🏷 Static tape No. 1: The price is published according to the production order of the energy block.
🏷 The energy block price is already ordered — not by time but by the priority of block execution. It is important not to confuse: block priorities dynamically reorganize in response to hidden energetic impulses, while the execution order of prices fixes their manifestation in the market. Each price in the dynamic tape is linked to energy production measurement indicators, unavailable to the general public. Those who see the structure before its manifestation do not follow the price — they anticipate it.
EΞ2Φ8Ψ45Θ·ζ⁻¹·106Λ732·Ω²
📎 Screenshot:
🏷 When trading from levels, use liquidation zones from BPC 10 and higher.
🏷 Bolzen Liquidity Map — ETH (numerical equivalent of the map):
Updated versions of the Bolzen Liquidity Map — ETH are in restricted access.
The permanent Energy Grid Dashboard for ETH and BTC is publicly available and intended for international institutional review.
Dear international community,
I thank the TradingView moderation for their neutrality and support of analytical work on a global scale, as well as everyone who follows my research. This platform serves as a space to demonstrate the contribution to analytical development.
Attention and time are your key resources. ATH — is emotion; timeframes — are your best allies. Thank you.
— The Architect
BPC — The Bolzen Price Covenant

BTC TOP is over
Based on my current BTC timing analysis, I remain bearish until September or October, unless there is a material change.
As long as the market structure, news flow, and sentiment continue to align with this scenario, they only reinforce my bearish bias.
It would take a genuinely strong and unexpected positive catalyst to invalidate this outlook.
I just noticed an error — from the halving to the LOW should be the TOP.

The Bullet Proof Engine
🛡️ Self-Funding Security for Institutional Whales ($100k+ Capital)
In the 2026 market, volatility is your engine, but insurance is your brakes. While most high-volume traders operate unprotected, the ******** Architecture transforms a primary expense—*************—into a self-funding investment.
📊 The Institutional ROI Matrix ($100,000 Capital)
This table demonstrates how institutional scale allows for "safe trading" that significantly outperforms unprotected strategies.
| Item | Monthly Cost (Est.) | Monthly Benefit (Est.) | Net Result |
|---|---|---|---|
| Premium | ($250 – $667) | $100,000 Safety Net | 95% Principal Insured |
| Startup Airdrops (VIP 10) | $0 | $3,000–$12,000 | Pure Passive Yield |
| Trading Fee Savings | $0 | $150,000 | Retained Capital |
| TOTALS | ($667) Max | $162,000+ Max | +$161,333 Profit |
⚙️ Strategic Implementation: ********** Account Sprint
To achieve maximum capital efficiency and yield, recruits must follow the Institutional VIP 10
* SubDividing ************
* Churning ************
* Swarm ************
* Airdrop Harvesting: Each sub-account qualifies for its own allocation, maximizing the "Square of VIP Level" multiplier.
* Self-Funding Mechanism: Even at maximum insurance rates ($667/mo), a single successful startup airdrop ($3,000+) covers your security for the entire quarter.
> The Logic: You are essentially buying a $100,000 bulletproof vest and getting paid $2,300+ a month just for wearing it.
>
📋 Final Onboarding Checklist
Before initializing the sprint, ensure the following are complete:
* KYC Verification: Complete KYC 2 on all 10 sub-accounts to unlock the Startup yield section.
* Active Coverage: ************
* Architect Hub: Confirm registration via the Architect Hub to ensure a 20% commission on the $300M+ volume flow.
Every day you aren't in this architecture, you are losing approximately $5,000 in fees and $100 in potential airdrops.

This Volatility Period: February 6th - 8th
Hello, fellow traders!
Follow us to get the latest information quickly.
Have a great day!
-------------------------------------
(BTCUSDT 1M Chart)
The price fell from the critical 69,000 - 73,499.86 range.
We need to see if it finds support near the previous high of 57694.27 to 61299.80.
I believe the price range it cannot return to is below the 42283.58 to 43823.59 range.
-
(1D chart)
This period of volatility is expected to last from February 6th to 8th.
Therefore, the key question is how far it can rebound.
We need to see if it can rise to the critical 69000 to 73499.86 range.
If not, we need to see if it can rise above the left Fibonacci level of 0.618 (65760.59).
The next period of volatility will be around February 17th (February 16th-18th), so the key question is where the price will begin its sideways movement after this period of volatility.
The 57694.27-61299.80 range represents the previous high point, the first significant uptrend, and thus holds some significance.
The M-Signal indicator on the 1D chart is still forming at 87944.84, so we should also monitor whether it re-forms after this period of volatility.
This is because an uptrend begins when it meets the minimum DOM (-60) or HA-Low indicator.
-
Thank you for reading to the end.
I wish you successful trading.
--------------------------------------------------
- This is an explanation of the big picture.
(3-year bull market, 1-year bear market pattern)
I will explain in more detail when the bear market begins.
------------------------------------------------------

Potential Massive Fibonacci Time Cycle TurnToday 02/09/26 the Dow Jones Industrial Average (DJI) made a new all-time high unconfirmed by the Dow Transportation Average, S&P 500, and Nasdaq Composite.
This high comes at the end point of a massive Fibonacci time cycles covering 97 – years.
The starting point is the DJI mania peak made in 1929.
The bisect point is the major peak made in 1966. This was the first time the DJI reached 1,000 and the climax of a 34 – year secular bull market that began in 1932.
The day of the DJI 1966 top was 02/09/66.
Today could be the start of a significant DJI decline.

ATH from there ?!!!It's very likely price might use that demand zone to push to the all time high (one can only hope :)
Entry: 4957
SL: 130 pips (4945)
TP: 1800+ pips
RR: 1:12+
Kindly wait for confirmation after price traps and induces early buyers at that engineered liquidity I marked as IDM • Structural Liquidity.

Could GU bounce off from 1.37?Seeing an area of price liquidity below at the 1.36 price region. Would be interesting to see what price action forms around 1.37 in the morning, and if any bearish confluences show up to validate this bearish idea.
Curious to see your guys thoughts for GBPUSD for this week too, considering we've got NFP mid week.
Aman | SMC Wolf FX

there is no need to make it difficultthere is no need to make it difficult.
BTC price is sitting on a beautiful support level and Bullish Order Block.
The files are expired.

A Major Warning Crash Signal for Markets!🚨 CAPE at 40.30: Second-Highest in History — A Major Warning Signal for Markets
The Shiller CAPE (Cyclically Adjusted P/E) ratio is one of the most respected long-term valuation metrics because it smooths earnings over 10 years, cutting through short-term noise.
Today, CAPE sits around 40.30 — a level seen only a handful of times in over 150 years of market history. Outside of the dot-com bubble, this is among the highest readings ever recorded.
Historically, CAPE levels above 30 have never been sustainable and have always been followed by major market drawdowns or crashes.
📚 Historical Precedents: What Happened Last Time CAPE Was This High?
🔥 1929 – Great Depression
CAPE exceeded 30
Followed by a market crash of nearly 90%
Economic depression lasting a decade
🔥 2000 – Dot-Com Bubble
CAPE peaked above 44 (highest ever)
Nasdaq collapsed ~78%
S&P 500 lost ~50%
Took years to recover
🔥 2008 – Global Financial Crisis
CAPE remained elevated into the mid-to-high 20s after years of excess
Valuations stayed stretched while debt, leverage, and housing bubbles expanded
Result:
S&P 500 fell ~57%
Global credit markets froze
Deep recession followed
⚠️ Important note:
CAPE does not always need to hit extreme highs right before the crash — prolonged overvaluation combined with leverage and credit stress has historically been enough.
🧠 Key Insight
Markets don’t crash because CAPE is high.
They crash because high valuations leave no margin of safety when stress arrives.
Right now, valuations are extreme while macro stress is building.
🌍 Macro Warning Signs Supporting the Risk
📉 China’s Structural Breakdown
Ongoing real-estate collapse
Developer defaults
Weak consumer demand
Spillover risk to global growth, commodities, and financial markets
🏢 Commercial Real Estate Crisis
Office vacancies at multi-decade highs
Refinancing risk as rates stay elevated
Banks and regional lenders exposed
Similar early warning signs seen before 2008
💣 Exploding Government Debt
U.S. and global debt at record levels
Interest costs rising faster than GDP
Limits governments’ ability to stimulate during downturns
Fiscal stress historically precedes recessions
📉 Yield Curve & Credit Stress
Extended yield curve inversion (classic recession signal)
Tightening credit conditions
Rising defaults in leveraged sectors
🚨 Why This Time Is Especially Dangerous
Unlike previous bull markets, today we have: ✔ Extreme valuations (CAPE > 40)
✔ High interest rates
✔ Heavy global debt
✔ Weak global growth
✔ Fragile real-estate sectors
✔ Tight liquidity conditions
This combination reduces the odds of a soft landing.
🧭 What History Suggests
When CAPE exceeds 30 during bull markets:
Returns over the next 5–10 years are poor
Corrections are sharp, not gradual
Crashes tend to coincide with recessions
Markets can stay irrational longer than expected — but valuation extremes are always resolved eventually.
📌 Summary
CAPE at 40.30 is a historic red flag
Similar conditions preceded 1929, 2000, and 2008
Current macro stress supports the risk of:
👉 Major market sell-off
👉 Potential recession starting this year
This is not about timing tops — it’s about recognizing asymmetric risk
⚠️ Ignore price — watch valuations, credit, and liquidity.

Gu trend flipping short?Gu currently dropping below my important 2 line (red) 20 week zone here which is indicating a bearish sign at least for the next coming week. The blue lines on my chart indicate another cycle at play that moves faster than the red one that also indicates the nearest line as resistance at 1.36599 with a mirrored angle at 1.34199. Although I do not need the full move to finish my phase 1 challenge, there is a likelihood that 1.34199 will be touched this week but I will only be aiming for the break of the previous week low. Finally we have the white lines that we can find at least 1- 2 entries a day that show up everyday but when you have 2 white lines such as these that are moving this close together it usually indicates a larger reversal is underway. Often times the chart may find confluence between the white support and resistance lines and the larger ones that line up either perfectly or within pips of each other. I am a seller at 1.36550 with a stop at 1.368 targeting last weeks low. If it does move higher than that for some reason then my alt short will be at 1.368 stops at 1.370 still targeting last weeks low at least! Good luck and happy trading!

Natural Gas MCX Future Intraday Analysis - 10 Feb., 2026MCX:NATURALGAS1!
NATURAL GAS Futures — Chart Pathik Intraday Levels for 10-Feb-2026 - 01:51 AM
(If these levels add value to your trades, a quick boost or comment goes a long way in supporting this free content and keeping our trading community thriving!)
Natural Gas MCX shows consolidation around 290 after downside pressure, with key resistance at 298-300 and support near 285—bearish tilt unless breaks higher decisively. Each comment or share builds the momentum for disciplined, structured analysis across our trading community!
Bullish Structure:
Longs activate above 298 (Long Entry), with confirmation as price sustains above this level and defends 292 support zone.
Targets: 307 (major booking zone), 315 (extended move on breakout)
Control: Stop or trail near 292 or 288 to manage risk
Bearish Structure:
Shorts open below 292 or on rejection at 298 after failed upside attempts.
Targets: 285 (partial/scalp), 280 (extended move if breakdown holds)
Control: Fast short covers required above 298 or on sharp reversals
Neutral Zone:
298 is today’s inflection—practice patience until a strong direction emerges above or below this level.
Every setup is designed for structure, plan, and logic—let the chart work for you, not your emotions.
Boost or comment if these levels help your preparation—help Chart Pathik keep delivering quality analysis to more intraday traders!

CHFJPY: Buy setupCHFJPY: Buy setup. Wait for a retest. The best area is the OB shown below the broken level.
Cheers

Nifty50 Index - Intraday Technical Analysis - 10 Feb., 2026NSE:NIFTY
NIFTY 50 Index — Chart Pathik Intraday Levels for 10-Feb-2026 - 01:41 AM
(If these levels add value to your trades, a quick boost or comment goes a long way in supporting this free content and keeping our trading community thriving!)
Nifty 50 is trading around 25,800 after recent consolidation, facing key resistance at 25,950 with potential bullish breakout signals if holds above 25,700 support. Each comment or share builds the momentum for disciplined, structured analysis across our trading community!
Bullish Structure:
Longs activate above 25,950, with confirmation as price sustains above this prior high and defends 25,800 support zone.
Targets: 26,000 (major booking zone), 26,100 (extended move on breakout)
Control: Stop or trail near 25,800 or 25,700 to manage risk
Bearish Structure:
Shorts open below 25,800 or on rejection at 25,950 after failed upside attempts.
Targets: 25,700 (partial/scalp), 25,500 (extended move if breakdown holds)
Control: Fast short covers required above 25,950 or on sharp reversals
Neutral Zone:
25,950 is today’s inflection—practice patience until a strong direction emerges above or below this level.
Every setup is designed for structure, plan, and logic—let the chart work for you, not your emotions.
Boost or comment if these levels help your preparation—help Chart Pathik keep delivering quality analysis to more intraday traders!

Natural Gas Mid-Season Update 2/9/262/8/26
After much consternation and many requests, I have put some time aside to put out a mid-season update. If you were lucky enough to take part in the historic run up, and drop down in prices the past 30 days, consider yourself well prepared for what I believe is about to come next. After all, once in a lifetime events are only supposed to happen, well, once in a lifetime. But I believe that we just might be setting up for a part two in the NG trade of a lifetime. First a brief understanding that the historic runup in the price of NG was primarily due to two events. The normal, mid-seasonal drop in NG prices, due to the expected January thaw. Which saw a market overly shorted. Due to the ever-increasing supply coming on in the market and the lack of expected demand in LNG terminals completing completion. Plus, the AI hype. Industry experts assured market participants that LNG and AI would deplete underground storage, and NG would be soon at historic heights. But as the late fall cold failed to shrink storage levels below 5-year averages, and injections continued well into withdrawal season, a familiar component of high NG prices reared itself in mid-December, the POLAR VORTEX. Soon many were caught off guard, as the early November rolled over and price began it steady climb to 5000 level. But when models began to predict the January thaw in mid-December, prices began their seasonal decent from withdrawal season highs. Or so traders thought. Some traders knew that this winter would be different. That, this polar disruption might just be here to stay for the foreseeable future. Plus, the synoptic teleconnections, ocean temps and early Siberian ice cover could possibly bring a different winter than years past. Which brings us to mid-January and the historic short squeeze. There are many insiders who indicate that 100% of Algos were short into the weekend of January 17-18. Which brought us to a multiyear high on 7439 on the NYMEX the day of options expiration. Now I had previously stated that there were two reasons, the first being the shorts. But the second, being the historic run up in spot prices at delivery hubs all on the US. See, after 2021 and winter storm Uri, natural gas end users were required to have one week spot pricing purchased in advanced after storm Uri shot same day delivery pricing to some of their highest levels on record. Which caused a series of events that led to final delivery consumers of electricity paying prices so high, that in some areas during that extreme cold spell would have bankrupted individuals, if it were not for government involvement. So, due to the high spot pricing and the short in the market, there was a rush for seller and buyers alike to see the price of NG hit the 7000 plus on contract expiry.
Now, that’s all in the past and that could never happen again, right? Well, like I stated earlier, this winter is going to go down as a winter of a lifetime. There continues to be indicators that this coming 10 days is another thaw that will be followed by another 20-day pattern of historic cold. Historic Arctic air to be specific. There is another Polar Vortex disruption in the works, and the teleconnection are beginning to confirm this. It is just that the models have not yet had the ability to see it due to the 15-day forecast they print. One would think that large institution trader learned their lesson being all short on the wrong side of the trade. Well, you would be wrong, and they might just be on the wrong side of the trade again. In my video I will explain how the Polar Vortex is again rearing its cold ugly head, it is showing up in Europe as I type. We like to look at Europe as the canary in the coal mine, for cold weather in the eastern US (where the population-based winter heating demand is). The two big winter teleconnections, the WPO and the AO are switching back to cold signals, there is still massive snow cover in the north and eastern US. The Great Lakes are almost completely frozen over, and we just switched to a 5-year deficit for NG storage. The best part is this cold should show up intime for contract roll over, which would lead to a situation like January, where users of NG would be forced to buy into an overly short market, that will have the beginnings of a squeeze, due to having to have one-week deliverable pricing due to spot prices rising. Not only does late February and early March look like historic cold, but we could again be looking at multi-year highs in pricing, before the shoulder season is upon us. So hit play on the video and decide for yourself. What will you tell you grandkids about the 2026 Nat Gas trading season. Were you one of the winners in the great squeeze of 26?
I do not believe that price will close the gap from mid-January, but there is a good possibility we find support at the 3000 level. We just fell below the 32.8% at 3280, Sunday Asia open. I expect that we will see rallies sold into until we either find support somewhere around 3000, or the model runs start to show what some of us are seeing. That we will finish this season having withdrawn storage to 1.5 TCF. We were on track 10 days ago of projection seeing storage down at 1.4 TCF, and there is a good possibility we end lower. This would set up the summer strip at an average of 4500. We are currently undervalued in the current contract, and the T+1 is a whopping 39% undervalued. So, if this plays out and the cold stays on until mid-March, this will not be a short the peak moment. Yes, there will be some consolidation, but do not wait for this to pan out and play the pricing down. Storage will be depleted, in the US and most importantly Europe. LNG will be producing at or above 20 BCF/d, and there will be a price war between the two competing factions. Keeping HH pricing elevated into the summer season, where another 2 BCF/d of LNG is planned to come online. The technicals have been set. 3000 is the floor and the high is now 7438. But we must first contend with the immediate high at 4425, and the 2025 high for NGH26 at 4811.
Keep it burning!


XAU/USD Gold Analysis (5M)Today’s gold strategy is all about patience. We are looking for a liquidity sweep followed by a confirmed re-test to trigger our long entry. Risk management is our priority:
1. TP 1: Once we hit the first target, we move Stop Loss to Breakeven (BE). Risk-free trade from there.
2. Trailing Stop: We’ll trail the price by moving the SL to newly formed higher lows, locking in profits while shooting for TP2 and TP3.
Note: Low impact news today, but stay sharp as volatility ramps up tomorrow!
GOOD LUCK TRADERS……………..;)
