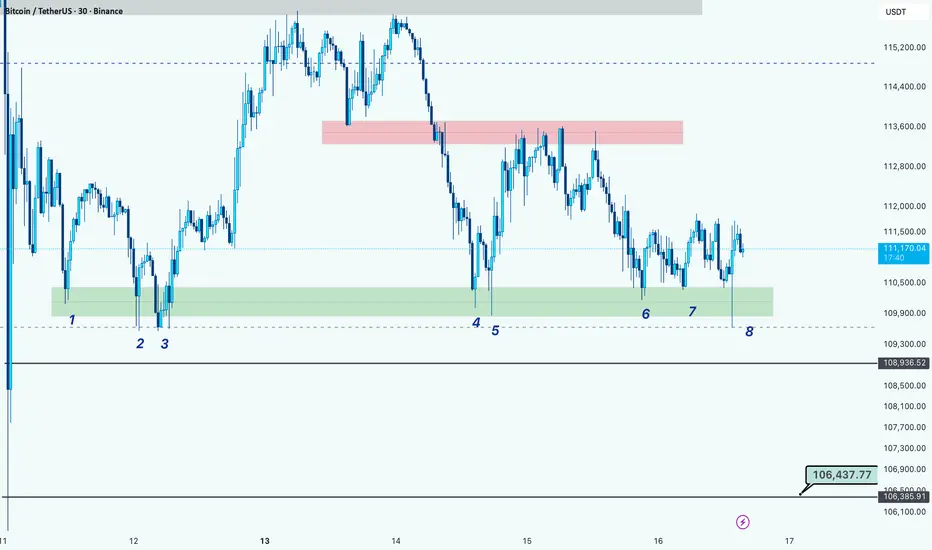
BTC Testing Key Support for the 8th Time, Breakdown Ahead?Hi guys!
BTC has tested the same support zone eight times around the $110,000 – $110,300 range (highlighted in green).
Repeated retests of a support level often signal weakening buyer strength, increasing the probability of a breakdown.
If the price manages to break below this zone, the next key support lies around $106,430, which could be the next target area for bears.
Beyond Technical Analysis
Tesla (TSLA) — Momentum Reload or Major Cooldown?The Next $400–$450 Decision Zone!
🧭 Weekly Chart — Big Picture Momentum
Tesla has printed one of the cleanest BOS (Break of Structure) patterns on the weekly timeframe since the post-2023 recovery, confirming that the macro downtrend has flipped into a sustained bullish expansion. The stock ripped from its $216 CHoCH base and is now consolidating above the prior macro breakout line near $425.
However, the latest weekly candle shows stalling momentum, forming a short-term distribution near the $430–$440 region. That zone lines up perfectly with the previous supply structure and fib confluence from 2022 highs.
The MACD histogram remains strongly positive but is beginning to flatten — early warning that buying pressure might be easing. Stoch RSI is also hovering near overbought at 85+, signaling the need for a short-term reset before the next leg.
* Bullish scenario: A weekly close above $436–$440 would confirm strength continuation toward $488–$500, the next liquidity zone.
* Bearish scenario: A close below $410 opens the door for a healthy pullback to $367–$376, a major equilibrium level with demand imbalance and previous BOS base.
Weekly takeaway: Trend remains bullish, but short-term overextension hints at a pause or mild retracement before another drive up.
⚙️ Daily Chart — Structure and Cooling Phase
The daily chart confirms Tesla’s minor pullback within the larger bullish wave. After breaking above $400 with strong momentum, price is now consolidating just above its breakout order block ($415–$420).
The BOS on daily shows continuation potential, but MACD has started printing red bars — suggesting that momentum is fading and a retest is underway. The Stoch RSI sitting high around 93 indicates the correction may continue until momentum rebalances.
* Bullish case: If TSLA can hold $416 and print a higher low, the next upside targets are $442 → $455, then $488 (supply zone).
* Bearish case: A daily close below $414 would invalidate near-term bullish control, triggering a slide toward $400–$397, a major demand block that aligns with GEX PUT support.
Daily summary: Still in bullish structure, but short-term retracement needed for healthy continuation. Watch for $415 hold as pivot.
⏱ 1-Hour Chart — Trading Plan
On the 1-hour chart, TSLA is forming a short-term consolidation wedge between $420 and $436 after multiple CHoCH and BOS flips. The stock is bouncing between mid-range liquidity pockets, showing clear indecision from both sides.
MACD is recovering from a previous bearish cycle, while Stoch RSI has crossed up from mid-levels — showing early signs of a micro-bounce in progress.
Volume confirms that buyers are active at $424–$425 zone, but strong resistance remains near $436–$440.
Trading Plan:
* Bullish setup: Enter above $436 breakout with target $445 → $455, stop at $425.
* Bearish setup: Short if $420 fails with downside target $405 → $400, stop at $430.
This structure allows swing-to-scalp flexibility — traders can lean bullish above $425 but must stay cautious until price reclaims $436 decisively.
💥 Options GEX & Institutional Positioning
Based on the Options GEX chart:
* Highest Call Wall: $450 — heavy resistance and likely magnet if bulls push higher.
* Next positive GEX zone: $445, where gamma flips positive and market makers chase delta hedges upward.
* Major PUT Wall: $400 — strong defense area, aligning perfectly with chart structure and demand.
* IVR 25.7 / IVx 67.7 → volatility premium moderate, favoring directional plays with limited spreads.
Gamma interpretation: As long as price holds between $425–$440, market makers maintain positive gamma, keeping price pinned and range-bound. A clean breakout above $440 could trigger a gamma squeeze toward $455–$460.
🎯 Option Strategy Ideas
1️⃣ Bullish Continuation Play:
* Buy $430C / Sell $450C (Oct 25 expiry) — risk ~$6 for a potential $14 reward if Tesla rallies to $450+.
* Aggressive intraday: Buy 0DTE/2DTE $430 Calls only if price reclaims $436 with volume.
2️⃣ Bearish Hedge:
* Buy $420P / Sell $400P (Oct 18 expiry) — ideal if $420 support fails and correction deepens.
3️⃣ Neutral Income Strategy:
* Expecting chop between $420–$440? Sell Iron Condor ($440C/$450C and $410P/$400P) to profit from time decay.
💬 Final Thoughts
Tesla remains one of the strongest setups in the market — the bullish macro trend is intact, but current levels are stretched. Expect sideways or minor correction before another breakout attempt. The $415–$425 area is the key battleground: lose it, and we test $400; reclaim $436+, and the rocket’s back on for $455–$480.
My TA continues to show high win-rate accuracy, and if you’ve followed previous analyses, you’ve seen how precise these levels play out.
If there’s any stock you want me to analyze next — even ones I don’t usually post — DM me and I’ll be happy to break it down for you.
This analysis is for educational purposes only and does not constitute financial advice. Always do your own research and manage your risk before trading.

The best thing you can do as a crypto traderLike many who trade crypto, I’ve got a bitter taste in my mouth after Friday night’s chash.
But with years in the market, I know it’ll pass.
Still, I wanted to give one honest piece of advice to anyone new to this space:
The best thing you can do is stay away from social media.
Everything you see there is fake.
The Lambos.
The “next 100x.”
The guys screaming into the mic about how to become a millionaire, how this coin will make you rich, or how “Trump will print millionaires again.”
You’ll hear about one whale wallet buying — next hour/day, another one selling — and you’ll ask yourself: why?
You’ll see the same people saying for over two years that the mythical altcoin season is just around the corner.
The same people who call for a “100x” no matter what the market does.
The same people who promise that XRP will hit $10,000 on November 21, and when that date passes, it magically becomes “by Christmas, by Summer, by Horses Easter (Romanian expression :) )”
And when one person says something ridiculous and it gets views, a hundred others copy it.
Then a thousand more come and make it even louder, more dramatic, more viral — because attention is currency, not accuracy.
Social media isn’t a place for trading.
It’s a place for noise.
For emotional manipulation.
For dopamine hits disguised as “alpha.”
If you want to survive in this market, learn to think independently.
The moment you stop looking for answers in influencers’ voices (of course, there are exceptions, but...), you’ll start hearing your own.
And that’s when you actually begin to grow as a trader.
P.S. And by the way — instead of scrolling on TikTok or whatever, pick up a real trading book.
At least there, you’ll find something concrete — not another fairytale about how to become a millionaire with the next meme coin.

Gold Have Chance to Growth a New zone 4225 to 4260 ?Gold prices surged to new all-time highs today, breaking above the $4,200 resistance before retracing slightly toward support. As seen before, the pullback attracted fresh buying interest, suggesting that bullish momentum remains intact.
Market sentiment continues to be supported by rising trade tensions — reports indicate that Trump is considering a ban on Chinese vegetable oil imports, while China is said to be preparing reciprocal port fees. These developments have increased safe-haven demand for gold.
Additionally, with the Federal Reserve maintaining its dovish stance, the overall macro backdrop remains supportive for further upside in gold prices.
A false breakout pattern appears to be forming, indicating a potential technical pullback before the next leg higher. The broader trend remains bullish, with no strong fundamental reasons for a deep correction at this stage. so from the current situation we could expect next target zone would be 4225 to 4260,
You may find more details in the chart.
Trade wisely best of Luck Buddies,
Ps; Support with like and comments for better analysis Thanks for Supporting.

“I Am Become Meme, Destroyer of Short-Sellers”: Gold at $4,200Remember those days where you could short gold and turn a profit? They’re gone. The precious metal is relentlessly pushing higher, breaking every short-seller’s dreams and portfolio.
It’s official — gold has gone full meme. The shiny metal that your grandparents swore by is now trending on Reddit threads, popping in Discord chats, and somehow getting the same hype energy as Nvidia NASDAQ:NVDA in 2023 and Dogecoin COINBASE:DOGEUSD in 2021.
Gold OANDA:XAUUSD just crossed $4,200 per ounce early Wednesday, notching a 60% gain year-to-date — its best run in modern history and enough to make short-sellers lose sleep and tons of cash.
Its market cap now sits near $30 trillion, which means there’s more money parked in gold than the nominal GDP of every country not named the United States.
Let’s unpack what’s fueling this blistering rally and why traders just can’t stop buying.
🪙 Gold as the Trade of 2025?
Not too long ago, gold was a boring asset that just sat there like a pet rock. Not anymore. The OG store of value is finding new meaning as the “asset for uncertain times.” That is, even amid an ongoing earnings season .
What’s driving it? Pretty much everything that usually rattles markets.
• Rate cut expectations: The Fed’s recent pivot toward easing has taken real yields lower — and gold loves that. Non-yielding assets look a lot more appealing when Treasuries don’t pay much.
• Geopolitical jitters: The Trump-Xi trade tension reboot has everyone looking for a hedge that doesn’t involve a risk disclaimer the size of a novel.
• ETF inflows: Gold-backed ETFs are hoovering up bullion at record pace as everyone seeks exposure to the precious metal.
Add in central bank hoarding — especially from China, India, and Turkey — and you’ve got a near-perfect cocktail for demand.
💰 Meme Metal or Market Masterclass?
Reddit’s r/WallStreetBets is now flooded with gold posts, some featuring rocket emojis other saying it’s one big bubble. Regardless, the retail crowd is buzzing with memes, showing that the age-old asset has reached its youngest audience.
Individual traders are clearly in on the move, and the narrative is simple enough to spread like wildfire — gold is going up, it’s at record highs, and there’s a clean number to chase: $5,000 .
Is it rational? Maybe not entirely. If 2021 taught markets anything, it’s that “meme energy” can be a legitimate technical indicator. But it will take more than undergrads buying on their iPads to move this $30 trillion behemoth.
⚖️ The Case for (Even) Higher Prices
The $5,000 target — just 20% away — doesn’t sound crazy to gold bulls. Here’s why:
• Fed momentum: With the labor market showing signs of cracking, two more rate cuts are priced in for this year.
• Central bank accumulation: Global reserves are quietly diversifying away from the dollar. It’s a structural de-dollarization move and (likely) not a phase.
• Broader liquidity wave: Investors are flush with cash, even amid the AI boom, and some of that money inevitably spills into gold.
😬 The Other Side of the Coin
But before you run to your local pawn shop with diamond hands, it’s worth noting: no rally goes vertical forever.
Gold’s RSI has hovered above 70 for weeks — deep in overbought territory. Historically, every time the metal’s gone this far this fast, there’s been a pullback of 10-15% to shake out the latecomers.
Add in profit-taking, potential surprise Fed commentary, and a stronger dollar bounce, and you could see a retest of support near $3,850–$3,900.
And don’t forget the opportunity cost. When rates eventually bottom, stocks and crypto could start reclaiming their allure. Gold doesn’t pay yield, doesn’t innovate, and doesn’t post memes — it just sits there, shiny and smug.
🥈 The Silver Lining
If gold’s story sounds wild, silver’s chart looks even wilder. Silver OANDA:XAGUSD topped $53.60 earlier this week — up 83% year-to-date — riding on both industrial demand and good old FOMO.
ETFs tracking silver have seen some of their largest inflows ever, with some day traders even rotating profits from gold to silver in hopes of juicing returns.
When both metals rally together, it usually signals broad market uncertainty — and a collective “we don’t trust anything else right now” mood.
Off to you : How are you navigating the gold rush? Are you in already, looking to get in, or calling tops and lower from here? Share your views in the comments!

When will gold continue to rise? 4300?⭐️GOLDEN INFORMATION:
Gold (XAU/USD) advances toward $4,210 during Thursday’s Asian session, hovering near a fresh record high as Fed rate-cut expectations and renewed trade tensions lift safe-haven demand. Traders now await comments from Fed officials, including Michael Barr, Stephen Miran, Christopher Waller, and Michelle Bowman, for policy cues. Earlier this week, Fed Chair Jerome Powell warned that slowing job growth poses a risk to the US economy, reinforcing prospects for two more rate cuts this year—supportive of the non-yielding yellow metal.
⭐️Personal comments NOVA:
The buying power shows no signs of stopping, breaking 4217 and continuing to increase in price. The whole market is very excited and focusing on investing in gold as the safest asset.
⭐️SET UP GOLD PRICE:
🔥SELL GOLD zone: 4275 - 4277 SL 4282
TP1: $4265
TP2: $4250
TP3: $4240
🔥BUY GOLD zone: $4154-$4152 SL $4147
TP1: $4165
TP2: $4180
TP3: $4190
⭐️Technical analysis:
Based on technical indicators EMA 34, EMA89 and support resistance areas to set up a reasonable BUY order.
⭐️NOTE:
Note: Nova wishes traders to manage their capital well
- take the number of lots that match your capital
- Takeprofit equal to 4-6% of capital account
- Stoplose equal to 2-3% of capital account

Amd - This is still not over yet!🚀Amd ( NASDAQ:AMD ) can rally another +25%:
🔎Analysis summary:
This month alone, Amd has been rallying another +50%. All of this happened because of an expected rejection at a major confluence of support. Looking at the rising channel pattern though, Amd can still rally another +25% before this rally might actually be over.
📝Levels to watch:
$300
SwingTraderPhil
SwingTrading.Simplified. | Investing.Simplified. | #LONGTERMVISION


BTC mainly accumulates, remaining force decreasesBTC Technical Analysis (1D Chart)
Bitcoin continues to move inside a rising channel, where the upper trendline has repeatedly acted as strong resistance (around $125,000–126,000), and the lower boundary has held as key support near $108,000.
After the recent rejection at the upper boundary, price has pulled back sharply and is now approaching the support zone at $108,000–108,500, which aligns with:
The bottom trendline of the ascending channel
The 200-day EMA (white line)
A previous reaction zone marked by strong bullish reversals in the past
If the support holds, BTC may see a technical rebound toward the EMA89–EMA34 zone around $114,000–115,000, or even back to the channel resistance near $125,000.
However, if price breaks below $108,000, it would confirm a bearish breakout from the channel, potentially opening the way toward $100,000–102,000.
Key Levels to Watch
Resistance: $114,000 – $115,800 / $125,000 – $126,000
Support: $108,000 – $108,500 (critical zone)
Trend: Neutral to bullish inside channel; bearish breakdown if $108K fails
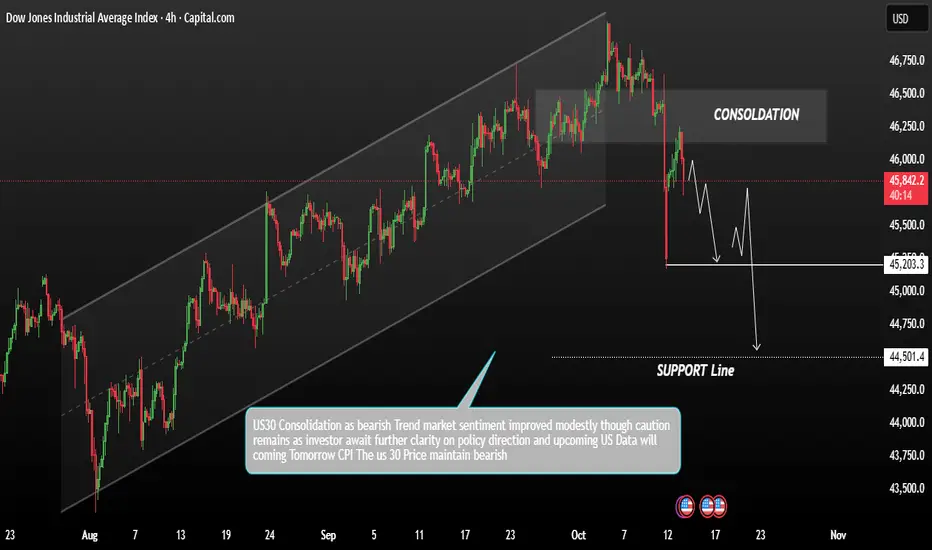
US30 remains in a broader bearish trendThe US30 futures advanced on Monday, recovering from Friday’s pullback as investors shifted back into risk assets following reports of a softer stance from former President Trump on China. This improved sentiment led to short-term buying across U.S. equity futures.
Technical Analysis
Technically, the US30 remains in a broader bearish trend, with the recent bounce seen as a potential pullback toward resistance As long as price holds below key resistance levels, the bias remains bearish, and a reversal to the downside is likely.
Resistance zone: 46,000 – 46,300
Support levels: 45,200 → 44,500
A rejection from resistance could confirm continuation of the downtrend, targeting the support zones mentioned above. However, a break and close above 46,300 would invalidate the bearish structure and open the way for further upside momentum.
You may find more details in the chart.
Trade wisely best of Luck.
Ps; Support with like and comments for better analysis Thanks for Supporting.
DOWNTREND CONTINUES - Sorry Twitter, I was rightDowntrend continues as forecasted 5 days ago
MTOPS calls the markets well ahead of time with highest levels of accuracy


gold on buy before sell#XAUUSD price still moving uptrend, now price needs to break 4283 for little correction on sell.
Buy limit on 2 times breakout 4250,target 4283, stop loss 4235.
Below the rectangle 4233-4230 holds bearish confirmation.

16/10/68 : XAUUSD ( US Session )Using it from US Session until 11.00AM , I'll new analysis and update at 12.00PM
Resistance
4260-4265
4250-4255
4245
Support
4234
4223-4229
4213-4218

It's time for gold to take a break. It's "Time"e for gold to take a break. It won't be easy for gold to break through 4296.

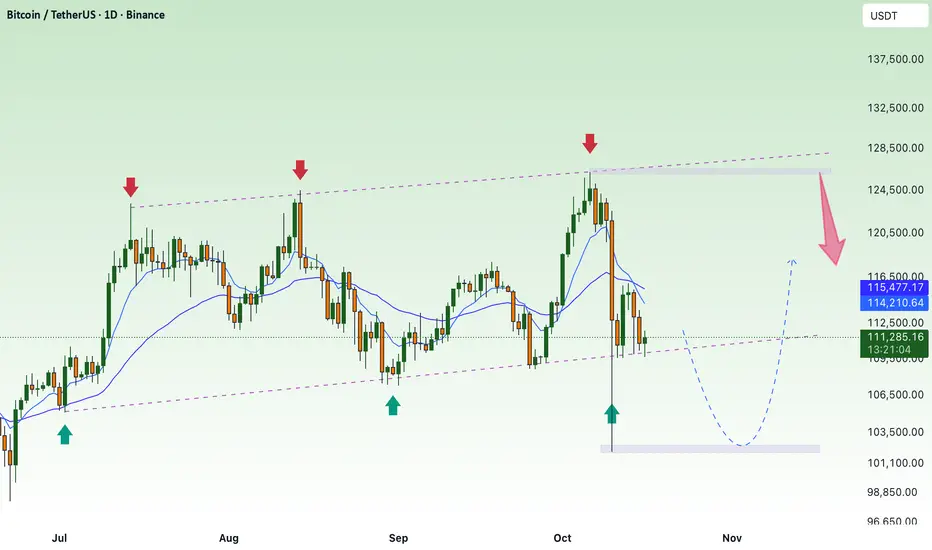
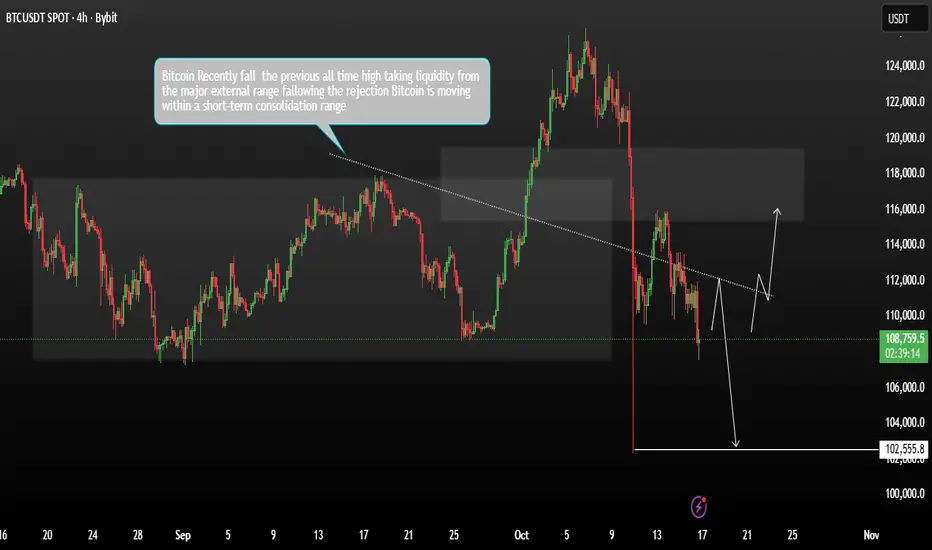
Bitcoin sharply rejecting preparing for a deeper retracementBitcoin recently reached a new all-time high before sharply rejecting from major resistance. The move appears to have taken liquidity from the highs, signalling a potential exhaustion of buyers and an early indication that the market may be preparing for a deeper retracement.
Following the rejection, BTC has entered a short-term consolidation range with a bearish bias. Momentum indicators suggest that the market is currently testing key support levels and may continue trending lower if buying pressure remains weak.
Key Levels to Watch:
A price close above 110K could open the path toward 116K before facing another potential rejection. If Bitcoin fails to close above 110K, a move down toward 102K is likely as the market seeks deeper liquidity and a stronger demand zone.
You may find more details in the chart.
Trade wisely best of Luck.
Ps; Suppor with like and comments for better analysis Thanks for Support.
CCJ/QQQ long NYSE:CCJ NASDAQ:QQQ AMEX:NUKZ $CCJ/NASDAQ:QQQ
Secular shift and outperformance in uranium and nuclear energy companies compared to QQQ

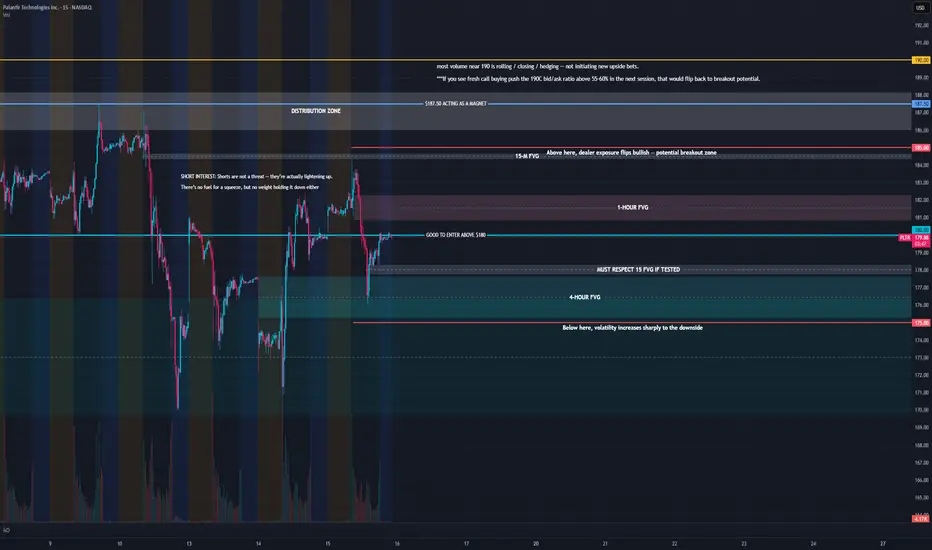
PLTR – Eyeing a Short-Term Push Into the 185–190 ZoneDescription
Been tracking PLTR’s short-term setup and the options flow is starting to paint a pretty clean picture.
Most of the call interest for this week is stacked between $185–$195, with the heaviest concentration around $185–$190 — basically forming a near-term “gamma magnet.” Dealers tend to hedge long when price trades into that zone, which usually supports upside momentum rather than capping it.
Short interest sits around 2.3% of float, and the cost to borrow has stayed soft. That’s not a squeeze setup, but it’s enough to say there isn’t a heavy wall of short pressure right now. Meanwhile, the bid/ask ratios on the 195–200 calls are rising above 55–60%, showing traders are rolling exposure higher rather than closing out.
In short — we’re seeing a healthy rotation of call volume upward while the lower strikes (180–182.5) stay firm. That’s constructive for a potential 3–5 day continuation move.
My Plan:
Watching for a hold above $181–182 to stay in the bullish zone
If PLTR clears $185 with volume, expecting momentum to build toward $188–$190
Planning to take partials there — could stretch to $192 if the OI at 195–200 keeps growing
Cut below $179.50 if it loses call wall support
This isn’t a “rip your face off” squeeze setup — it’s more of a steady gamma-fueled drift higher while dealers stay long hedged.
EURUSD ShortElite analysis
reacted from daily structural liquidity
Targeting lower structural liquidity

43% gain on Ramelius. This is why I sold.Thanks for viewing,
May 22nd to Oct 13th. It wasn't a trade - and I didn't have a stop-loss. Actually, I intended to hold for multiple years. This is why I exited.
- RBC Capital rated them "underperform," based on their projections of Ramelius gold production in 2026 to 2028.They think that production challenges have been understated and will lag even the early indicative lower production numbers for 2026 & 7 as can be seen in their most recent corporate presentations.
- They have delayed their production outlook/ forecast. This is seldom indicative of good news.
- Their production in FY 2025 was just over 300,000 ounces, but this is set to drop to the 200,000+ range for 2026 and 136,000+ in 2027 while they tail-off production at one mine and ramp-up another. ~30% to ~55% less production? No bueno! The "+" represents additional ounces added by Dilgaranga being developed and producing - how much and when is unknown. But I will be looking to re-enter sometime in 2027-8 when things look a little more certain. Their goal appears to be 500,000 ounces in 2030 at this stage. Quite a bit of uncertainty about how and when they will get there at this stage.
Actually, that is about it. Why should I hold a stock while it is predictably underperforming the other gold miners on the ASX 300? Especially, when I can buy back in later at a lower price. It is a great Company, has very low production AISC costs, and has acquired some very high-grade gold resources. When Dalgaranga comes online it will go gangbusters.

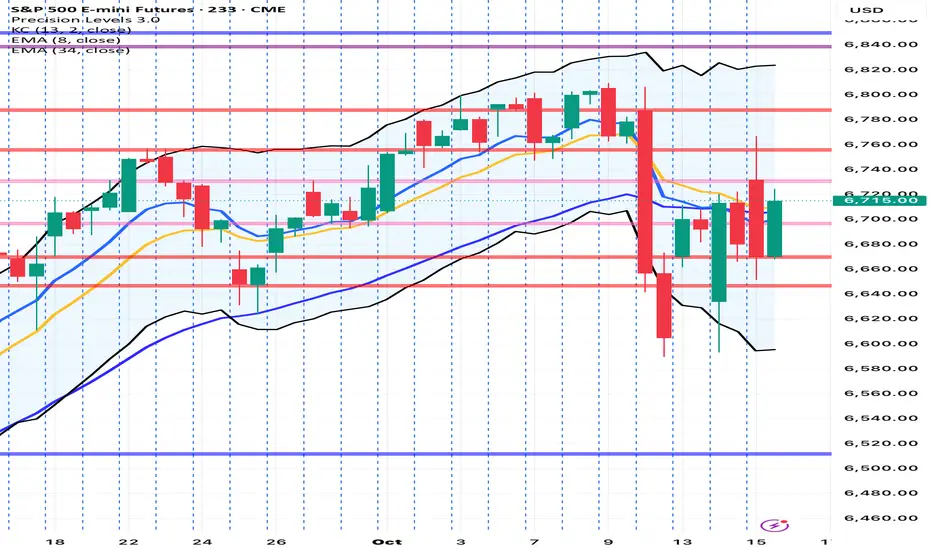
What's going to happen today ?Don't know what today is going to bring, what do you guru's think about ?
possible entry for short and long looking at volume nodes and aggression of the market..
Above value area high of yesterday so retracement to POC of yesterday is possible before any big moves happen.
I thought normally London is mean reversing but i think time will tell.
Have a good day all of you, and remember trade safe (full margin full risk)

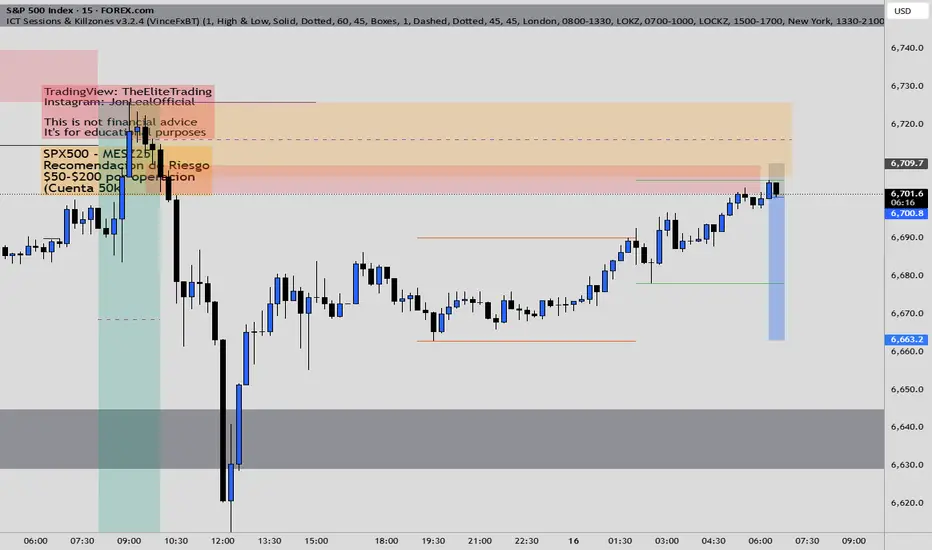
What next ! Bull and Bears. Who is strongest I have few levels above 6730 & 6755 to keep going up and I have 6669 and 6646 below to keep going down .. in between very lateral .. CME_MINI:ESU2025