XRP Breaking Up, Could Go to ATHsXRP is breaking out of this descending wedge it has traded in for the last couple months. October 10th was probably a big leverage flush, and the last few months have effectively washed out any remaining weak hands.
Since Oct 10th was the biggest candle down that XRP has had in a very long time, there's a decent chance it is ending a larger pattern now and going to head to new ATHs from here. This is also true for many other cryptos.
In an even relatively mild bull market, XRP could run to at least $10 next year as the rest of the market also sees significant gains.
Momentum indicators are showing bullish divergences here, and with daily and potentially weekly wisemen signals, as long as XRP holds above $1.77 then we've likely bottom and are about to begin a nice rally from here.
Bill Williams Indicators

Inverse Head & Shoulders (NZD/JPY)Setup: possible long term bottom and bullish trend reversal
- inverse head and shoulders (pattern incomplete)
Signal:
A) At current breakout
B) Buy on gap fill during pullback
Nornally I follow trends - but seems like FX market bottoming out in several places...
Is this a bottom? or trend still lower, and better sell?

Crypto Whale Builds $900M BTC, ETH, SOL Positions —GreenBayChartAt GreenBayChart, we’ve long emphasized that the most reliable edges in crypto come from tracking structured smart-money behavior rather than headline noise or retail sentiment. Today, one of the market’s most historically accurate large traders — frequently associated with key turning points including the 1011 crash cycle — has once again captured attention. On-chain forensics and derivatives flow data reveal this entity has aggressively rebuilt leveraged long exposure across Bitcoin, Ethereum, and Solana, with total notional value now surpassing $900 million. Unrealized mark-to-market profits sit near $40 million, while cumulative realized gains over the past several months reportedly approach $135 million.
This is not impulsive speculation. This is deliberate, high-conviction positioning executed during a period of price compression — exactly the kind of structural signal GreenBayChart has repeatedly highlighted as a precursor to meaningful trend legs.
Diversified High-Conviction Exposure: BTC, ETH, SOL — Institutional-Grade Allocation
GreenBayChart’s wallet clustering and perpetuals positioning analysis shows the book is intentionally balanced across risk profiles:
Bitcoin serves as the low-beta core, capturing macro liquidity flows, ETF inflows, and dominance-driven stability.
Ethereum targets medium-beta utility growth: Layer-2 scaling acceleration, staking/restaking yield expansion, RWA tokenization momentum, and renewed spot ETF interest.
Solana delivers high-beta convexity — leveraging network throughput, memecoin flywheel activity, and DeFi rotation potential.
This diversified structure is textbook institutional risk allocation: anchor + growth engine + volatility amplifier. It reduces single-asset reliance while maximizing upside capture across different market regimes. At GreenBayChart we view this as clear evidence of disciplined capital deployment rather than directional gambling.
Precision Timing & Unrealized Gains: Accumulating at Compression Zones
Current unrealized profits hover around $40 million, with historical realized gains nearing $135 million across the broader campaign. GreenBayChart on-chain reconstruction confirms the majority of entries were layered in during late-2025 / early-2026 consolidation — precisely when funding rates had cooled, open interest had stabilized, and retail conviction was low.
This aligns perfectly with the trader’s documented playbook: build during uncertainty, scale on structure confirmation, and hold through noise. Entering near visible support clusters dramatically improves the position’s risk/reward asymmetry — a pattern GreenBayChart has tracked across multiple cycles.
Ethereum Positioning Stands Out: Whale Accumulation Meets Converging Catalysts
GreenBayChart notes outsized emphasis on Ethereum within the $900M exposure. This coincides with several tailwinds we monitor daily:
L2 TVL surpassing $180B and driving increased base-layer settlement demand
Upcoming Fusaka/Glamsterdam upgrades promising significant latency and throughput improvements
Restaking protocols expanding sustainable yield surfaces
Spot ETH ETF flows resuming after January consolidation
Historically, visible whale accumulation in ETH during BTC dominance plateaus often precedes sharp ETH/BTC ratio inflections and capital rotation phases. When that rotation begins, beta compression tends to be violent and sustained — a setup GreenBayChart flags as high-probability.
Leveraged Positioning Without Overheating: Healthy Smart-Money Signal
Derivatives metrics analyzed by GreenBayChart show open interest expansion is measured, not parabolic. Funding rates remain range-bound (±0.10–0.20%), avoiding the extreme overcrowding that typically precedes violent mean-reversion events. This balanced environment favors trend continuation over blow-off tops or sharp reversals — precisely the conditions professional traders seek when deploying large size.
The lack of crowded longs combined with clear smart-capital accumulation is one of the strongest bullish confluences GreenBayChart identifies.
Implications of This $900M Whale Trade for Market Structure
Positions of this magnitude reshape micro-dynamics:
Liquidity providers adjust spreads and hedging behavior
Short sellers raise stops or reduce aggression as perceived downside risk grows
Momentum algorithms scan for breakout confirmation (local high breaks, funding flips, volume expansion)
GreenBayChart does not treat any single wallet as gospel. No $900M position guarantees an immediate vertical move. However, sustained, diversified accumulation by high-conviction actors during compression phases has repeatedly preceded extended directional trends rather than quick spikes followed by distribution.
Key levels and signals GreenBayChart is watching:
ETH/BTC ratio for early rotation confirmation
Perpetual funding rates and OI delta for conviction strength
On-chain exchange inflows (potential partial exits) vs. continued wallet accumulation
Bitcoin dominance — a decisive breakdown often unleashes alt-beta expansion
In summary: when capital of this caliber positions with patience and structure during uncertainty, the odds of a measured bullish resolution rise materially. The $900M crypto whale trade is live and active. Whether it quietly reinforces the floor or ignites the next leg, one thing remains consistent — conviction this disciplined rarely appears without purpose

Sol Leads CrossChain Flows Dominates Weekly Crypto ActivitySolana has become the superior blockchain in cross-chain capital movement. In the course of the previous week, the percentage of bridged and purchased tokens attributed to CRYPTOCAP:SOL was almost 67.8. This domination makes Solana way ahead of rival networks. The network remains popular among traders and users due to its speed and cost effectiveness. The confidence in the Solana infrastructure is reflected in capital rotation into it. The statistics show active trading and not sporadic speculation. The industry players are also evidently moving towards Solana as a settlement layer of choice.
Real Network Demand is Signaled by On-Chain Growth
The dominance of Solana is not limited to token bridging. The network activity is still increasing in several metrics. In the last year, the application revenue has hit the new heights. The supply of stablecoins in the network was growing. There was also a great increase in decentralized volumes of exchange. These indications point to the organic ecosystem development. Solana has developers who are working. Users are still making transactions on a daily basis. This continuous use confirms the status of Solana as a high-performance blockchain.
The Institutional Interest Enforcement Lends Solana more strength
The contribution of institutional adoption to the growth of Solana increases. SOL is becoming the preferred platform and used for quick execution and scaling operations by funds and platforms. The network is also efficient in terms of throughput. This renders it appropriate to large scale financial applications. Reliability and speed are important to institutions. Solana does not disappoint on either side. Such a consistent stream of institutional attention makes the network grow story more stable.
2026 Adds Momentum on a Long-term Basis
In the future, a number of stories justify the optimism that Solana has. Systems On-Chain AI agents are starting to communicate with systems. Assets tokenization in the real world keeps on gaining momentum. There is the growth of prediction markets and stablecoin payments. There is also an ecosystem development of privacy-oriented tools. The trends are in line with the technical strength of Solana. The network establishes itself as a base of automated and machine driven economies. The momentum keeps on growing as more people embrace it.

Hyperliquid Eyes HYPE Token Recovery with Massive Burn ProposalThe Hyper Foundation has submitted a proposal to burn all HYPE tokens in the Assistance Fund. If Hyperliquid validators agreed to burn, it would reduce both the circulating and total supply. This will trigger a recovery in HYPE price.
On December 17, the Hyper Foundation announced the Assistance Fund HYPE token supply burn proposal. The foundation requires validator voting on the proposal to proceed with the burn mechanism. It likely comes to solidify confidence in Hyperliquid and HYPE price, which has dropped more than 50% in a few months.
The Assistance Fund plays a crucial role in the Hyperliquid ecosystem by automatically converting trading fees into HYPE tokens as part of the L1 execution. These tokens are stored in a special system address (0xfefefefefefefefefefefefefefefefefefefefe), which, like the zero address, has never had a private key or control over the funds in the address. As a result, these tokens are irretrievable unless a hard fork is executed.
If passed, the current 37 million HYPE and all future tokens in the address will be burned from the total supply. The current tokens represent almost 13% of the circulating supply.
Validator Voting Timeline and Governance Process
The validator voting will decide whether the tokens held in the Assistance Fund address should be burned or not. A “Yes” vote would mean validators agree to treat these tokens as permanently removed from circulation.
The Hyper Foundation also mentioned that the vote will cement a consensus to never authorize any protocol upgrade that could access the locked tokens.
Validators are required to express their vote in the governance forum by December 21 at 04:00 UTC. Users can then stake to validators who align with their perspective until December 24 at 04:00 UTC. The final outcome will depend on a stake-weighted consensus measured at the close of voting on December 24.
Some validators, such as the Kinetiq x Hyperion, have even voted in favor of the proposal to burn all tokens in the Assistance Fund address.
HYPE Token Price Gains Community Reactions
The Hyperliquid community expects the burn to trigger a recovery in HYPE price by reducing its supply, boosting overall confidence in Hyperliquid. As the voting deadline approaches, the community is watching closely, anticipating a positive shift in token dynamics.
As CoinGape reported earlier, the launch of the first spot Hyperliquid ETF in the U.S. is also near, as Bitwise amended S-1 for its Hyperliquid ETF. It revealed a management fee of 0.67% and BHYP as the ticker symbol.
HYPE price jumped 2% after the Assistance Fund HYPE token supply burn proposal, currently trading at $26.66. The 24-hour low and high are $26.21 and $28.02, respectively. However, trading volume has dropped by 5% over the last 24 hours.
CoinGlass data showed massive buying in the derivatives market. At the time of writing, the total HYPE futures open interest jumped 3% to $1.52 billion in the last 24 hours. The 4-hour HYPE futures open interest has climbed almost 4%, with a more than 5% jump on both CME and Binance.

The Bill Williams Strategy ExplainedWe all know the market doesn’t always play nice, but the Bill Williams Fractal Indicator can help you read between the lines. If you're focused on fine-tuning your entries and exits, let’s break down how fractals can be a useful tool in your strategy.
What is the Bill Williams Fractal Indicator?
At its core, the Bill Williams Fractal Indicator is a technical analysis tool that identifies potential reversal points in the market. This indicator is based on the fractal definition by Bill Williams, who described fractals as price patterns that can be used to predict potential shifts in price direction.
In simple terms, a fractal pattern consists of five consecutive bars or candlesticks on a chart. The middle bar of this pattern represents a local peak or trough, while the two bars on either side of it are smaller. A bullish fractal occurs when the middle bar is a higher high than the surrounding bars, and a bearish fractal appears when the middle bar is a lower low.
Bill Williams Fractal Definition
The Bill Williams Fractal is defined by a sequence of five consecutive bars. The middle bar represents the peak (for bearish fractals) or trough (for bullish fractals), surrounded by smaller bars on both sides. When price breaks the high (for bearish fractals) or low (for bullish fractals) of this central bar, it signals a potential breakout.
How Does the Bill Williams Fractal Trading Strategy Work?
The Bill Williams Fractal Strategy is a proven approach in crypto trading. Whether you're a beginner or an experienced trader, using the fractal strategy can provide valuable insights into potential market reversals and breakouts. By combining the Bill Williams Fractal Indicator with effective risk management, you can improve your trading edge.
A common method is to use the 200 EMA to gauge the overall trend. If the price is below the 200 EMA, traders tend to focus on lower fractals and look for short opportunities, while if the price is above the 200 EMA, they focus on upper fractals and consider long trades. However, always remember to confirm the breakout of local levels for greater reliability in your trades.
Master the Bill Williams Fractal Strategy
The Bill Williams Fractal Strategy is a well-established method in crypto trading. Whether you're just starting out or you're an experienced trader, incorporating the fractal strategy can provide useful insights into potential market reversals and breakouts. By combining the Bill Williams Fractal Indicator with a solid risk management plan, you can enhance your trading approach.
That said, remember that no strategy guarantees success. Fractal trading isn't about predicting the market with absolute certainty — it's about managing your entries and exits with precision and maintaining discipline. Always make sure to think critically and adapt to market conditions. So, when you spot a Bill Williams Fractal on your chart, use it as a guide, but always trust your analysis and approach. Happy trading!

Exivara24: Bitcoin Weakens – Liquidity Drains, Demand ReversesBitcoin continues to face heavy pressure. Over the past two weeks, the market has experienced a sharp liquidity outflow and a simultaneous reversal of all the major capital inflow channels that were previously pushing price upward. At Exivara24, we are detecting an alarming synchronization of three key factors that is now dictating sentiment for both retail traders and institutions.
The three main demand engines are reversing at the same time
ETF outflow pressure stronger than expected
Spot Bitcoin ETFs (especially U.S. and European) have been recording consistent selling for the third straight week. Net outflows over the last 10 days exceeded $1.18 billion – the largest figure since May 2025. When ETFs shrink their balances, they directly pull capital out of the market, reducing order-book depth and amplifying volatility.
Sharp decline in DAT (Daily Active Transfers) activity
The number of daily active transfers on the Bitcoin network has fallen 34 % compared to October averages. This is a direct indicator of real network usage: fewer transfers = less capital rotation = weakening organic demand.
Stablecoin liquidity squeeze
The total volume of USDT and USDC held on exchanges (the primary source of “fast money”) has dropped by $2.4 billion in 14 days. Shrinking stablecoin reserves is a classic precursor to deeper and sharper price moves, as most margin buying is funded from these reserves.
Why this matters right now
When all three demand drivers reverse simultaneously, the market shifts into “thin liquidity” mode.
Any additional pressure (ETF outflows, whale selling, or macro-negative news) now triggers much stronger and faster price reactions than during periods of high liquidity.
What Exivara24 internal analytics show
Order-book depth on the top 5 exchanges is down 38–42 % versus October
Average BTC/USDT spread has widened from 0.008 % to 0.024 %
4-hour candle volatility has increased 61 % – every move is now “stretched”
Short-term scenarios from Exivara24
Base scenario (58 % probability)
Continued liquidity squeeze → test of $80,000 – $82,000 in the next 7–12 days → gradual stabilization and return above $90,000 after the holidays.
Bearish scenario (31 % probability)
Accelerated ETF outflows + continued DAT decline → break of $80,000 and fast move toward $72,000–75,000 (March 2025 lows).
Bullish scenario (11 % probability)
Unexpected major inflow (e.g., new large institutional buyer announcement or Fed dovish shift) → rapid reclaim above $95,000 as early as this week.
Exivara24 recommendations right now
Reduce or completely close leveraged long positions / move to spot or stablecoins
Prepare dry powder for entries in the $80,000–84,000 range – the most probable accumulation zone
Hard stops below $79,000 (weekly close) are mandatory
Watch ETF inflows and DAT dynamics – these two metrics will give the first reversal confirmation
Final take from Exivara24 – what this means for you right now
We see a clear picture: Bitcoin has entered a thin-liquidity stress phase, with the three key demand sources – ETFs, network activity, and stablecoins – all weakening at once.
This is not just a correction; it is structural compression that makes every price move sharper and more unpredictable.
Until these three trends reverse, downward pressure will remain dominant.
Yes, an unexpected catalyst (major institutional buyer, Fed softening, positive regulatory news) could flip the market in hours – but the current probability of that is only 11 %.
This is not the end of the bull cycle and not a “sell everything” signal.
It is a signal that easy money is gone.
The market has shifted into professional mode, where only those who:
strictly follow risk management
avoid unhedged leveraged longs
keep cash ready for buys at $80,000–84,000
are prepared for ±10–15 % swings in either direction within a day
…will survive and profit.
For us at Exivara24, this is not a crisis – it’s our normal working environment.
Our internal models switched to “liquidity stress” mode 10 days ago: we cut long exposure, strengthened hedging, and prepared client portfolios for the current conditions.
Result: average drawdown across all accounts in November is under 4.1 %, even on the worst days.
We don’t panic and we don’t get euphoric.
We just do our job: read capital flows, measure liquidity, and give you clear levels and actions.
If you want to get through this period calmly, with minimal losses (and ideally with profit on rebounds), now is the perfect time to join our real-time updates.
Full December protection & accumulation plan
Precise entry/exit levels and 24/7 alerts
Access to the private channel and morning/evening briefings

Still Good Long R:R's (Gold)Setup
Bullish trend / Correction
Gold still above 50 day moving average
Daily RSI stable around 50 level
Has made a 50% correction of rally since breakout at 3400
Commentary
It seems likely gold needs to first complete an ABCD correction before moving higher - meaning one more lower low. However, support at 3920 could hold, offering good R:R opportunities - even if 4200 holds as resistance.
Strategy
Look for bullish reversals below 4000, above 3920 support
Wait for bigger pullback to the 61.8% Fib / demand zone under 3800

PAEL analysis as a long-term stock!On a daily time frame, it shows a bearish divergence on the RSI 14. This might be ignored if it breaks the LH @ 55.4.
However, having good fundamentals intact, along with the Pole & Flag pattern and long bullish trend, makes it a good choice for the long-term portfolio. It can either be bought on Buy limit @ 48 or Buy Stop @ 54. For the safe side, it can be bought in two steps. First at Buy Stop and second at Buy Limit. Both values also comply with FVG (Fair Value Gap).
For swing trade, it would be a good buy @ 48, SL 42.7, TP 64 (1:3 RRR).


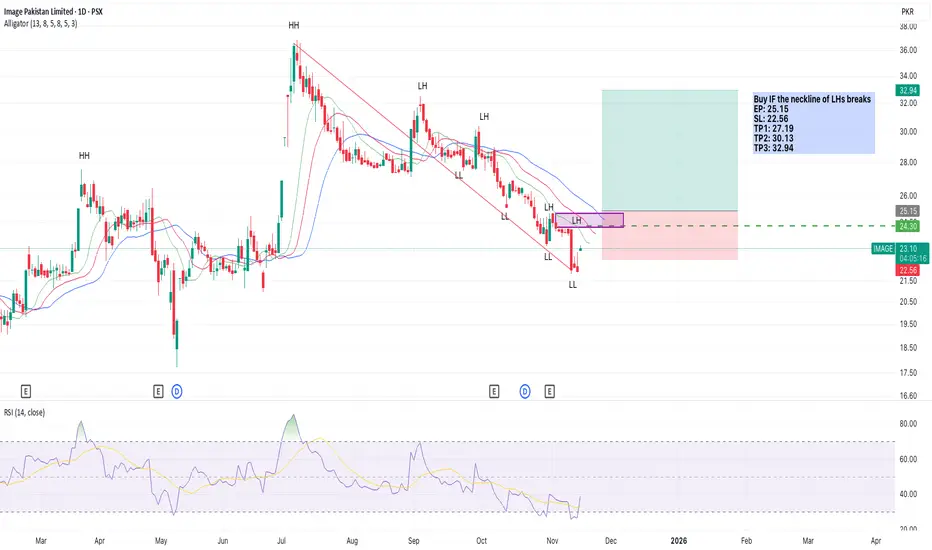
IMAGE Long positionBuy IF the neckline of LHs breaks
EP: 25.15
SL: 22.56
TP1: 27.19
TP2: 30.13
TP3: 32.94
BTC Bullish Zigzag Pattern (Elliott Wave)As an isolated, short-term pattern, BTC has formed into a near-perfect zigzag pattern. Wave-A is a violent monowave. Wave-B retraces exactly 61.8% of A and is structurally a flat pattern and a polywave. Wave-C relates to (A+B)/2 in time, 80% of wave-A in price, and is an impulsive wave.
Beyond the Neowave considerations, there's also a clear bullish momentum divergence, multi-peak AO, daily/4hr 1st wiseman, and 4hr 2nd wiseman (fractal).
Given all these considerations, and without considering the longer-term pattern, we are set for a decent bounce here which could potentially go to new all time highs.
After speaking privately with Glenn Neely, he also thinks BTC is nearing the final blow-off phase which could take us as high as $250k, and ending sometime early next year.
While I personally feel less confident about any long-term count now given multiple possibilities, at the very least, I think it's a good idea to be on the long-side here unless we clearly break through the $98-93k range. Especially because of this short-term pattern in isolation meeting all the normal signals I look for in a bottom pattern.
As things continue to develop it may be easier to see a single longer-term count emerging, especially as we near the conclusion of the long-term pattern. For now, it doesn't make a big difference what exactly the count for the long-term wave up is, just that there's a very high probability it is not yet finished and we are hitting a short-term bottom now.

ETHUSD 1H | Bullish Continuation Setup🟢 Market Structure
Price holding above key support at 3,600
4H sell-side liquidity taken below
Bullish structure intact with higher lows
🔵 Key Support Levels
Immediate Support: 3,600 - 3,610 (current zone)
Primary Support: 3,583 - 3,594 (consolidation base)
Strong Support: 3,549 (momentum defense)
🎯 Entry Zones & Targets
🟡 Primary Entry: 3,605 - 3,615 (current retest)
🟠 Secondary Entry: 3,583 - 3,594 (deeper retest)
🔴 Stop Loss: Below 3,548 (support break)
💰 Take Profit Targets
TP1: 3,637 - 3,650 (immediate resistance)
TP2: 3,700 - 3,720 (momentum extension)
TP3: 3,800 - 3,856 (liquidity zone)
⚡ Trade Management
Scale entries on support retests
Move SL to breakeven at TP1
Partial profits at each target
Bullish continuation expected - buying dips toward support
#ETH #Ethereum #TradingView #Bullish #Crypto

Silver, bullish or bearish?Bullish divergence in RSI, an ascending triangle, and a moving average, combined with hitting the neckline, all these indications make Silver a good candidate for a Bullish rally that can reap a 1:3 RRR.

Bullish trend reversal with divergence & Double bottomIn a 1H chart, AUDJPY is showing a "Bullish divergence" and "Double bottom" that may reverse the trend to be bullish soon...
Entry can be initiated once the neckline is broken at around 99.6

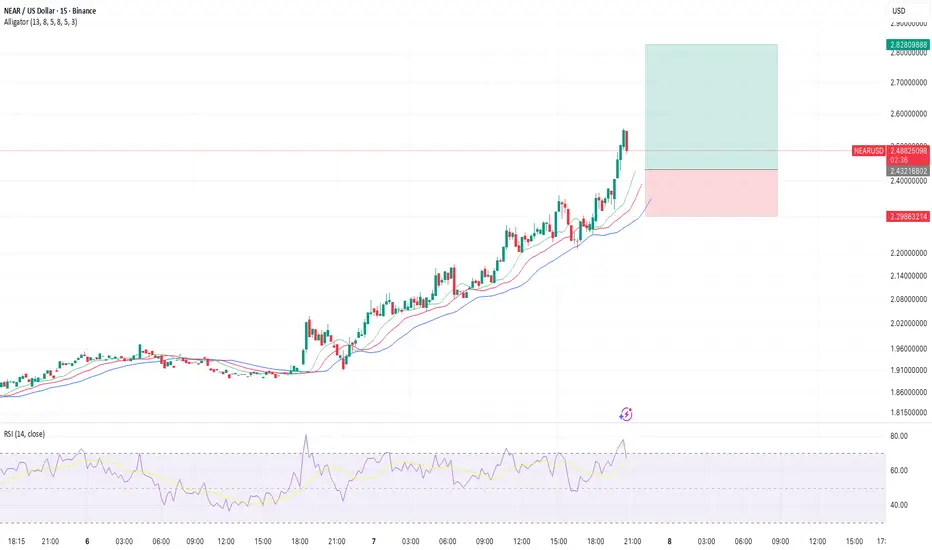
NEARUSD, 1H, 1:3 RRRUsing FVG (Fair Value Gap), it would reap a RR of 1:3. Entry point 2.432, SL 2.298, and TP around 2.828
Gold may hit a 5k mark soon!On the daily chart, Gold has formed a bullish flag that can lead to a 5k mark soon. RSI shows no divergence while candles are forming a perfect flag that seems about to break on a bullish trend.

Bullish divergence at 4hHaving a bullish divergence, ASTERUSDT may shoot for 2.0 on the BTC bullish trend (4h chart). Entry would be around 1.3 (when breaking the neckline of previous LH), SL at 1.023, and TP at 2.05

A chance to grab 1:3 RRR!In one hour chart, we've:
Bullish divergence.
Break the neckline in a Bullish trend.
Williams Alligator mouth wide open, confirming bullish trend.
Pole & Flag forming with retracement as a sign of continuation bullish pattern.
Dollar Index is Bearish (1H)
Euro Index is Bullish (1H)
All the above indicators are making it a good bullish ride with a 1:3 RRR with an entry at around 1.154, SL at 1.152, and TP at around 1.16.
Note: It is always advisable to have your own analysis before executing any live trade!
All the best...

ETH/USD – Reversal From DemandSMC | ICT | Bill Williams | 1H Bias
ETH swept lows into HTF demand and printed bullish displacement out of discount pricing.
📍 Key Levels
Entry Zone: ~$3,315 – $3,328
SL: ~$3,053
TP1: $3,600
TP2: $3,856 (liquidity + imbalance target)
📊 Confluences
Liq sweep below structure
LTF market structure shift
Demand block reaction + reclaim
Alligator shift — jaw opening up from compression
Bottom fractal forming at sweep point
Draw on liquidity toward premium inefficiency
🎯 Trade Logic
Stop run → algo long delivery
Targeting FVG fill + swing liquidity
Partial at mid-range, runner to premium
Monitoring price at $3,856 — strong reaction zone for continuation or rejection.

BTC/USD – Bullish Reversal PlaySMC | ICT | Bill Williams | 1H Bias
BTC swept HTF liquidity and reacted from a clean discount zone, showing displacement and reclaim structure.
📍 Key Levels
Entry Zone: ~$101,800 – $102,000
SL: ~$98,729 – $98,793
TP1: $106,000
TP2: $109,961 (premium zone + liquidity target)
📊 Confluences
HTF sell-side liquidity sweep
Bullish BMS after sweeping lows
Reaction from SMC demand block
Bill Williams Alligator shifting bullish (jaw opening)
SMT divergence into the lows
Price leaving discount → moving toward inefficiency
🎯 Trade Logic
Sell-side taken → buy-side liquidity draw
Targeting FVGs + imbalance fill above
Scaling partials at liquidity pockets & premium zone
Bias remains bullish into premium pricing — reassess if price rejects $109K zone.

RSR/USDT 1HR LONG SETUP 🟢 RSR/USDT | 1H Long Setup
Concepts: ICT | SMC | Bill Williams
Price is showing signs of a short-term bullish reversal after reaching a discount zone within the higher-timeframe range. Liquidity was taken below previous lows, sweeping sell-side liquidity — a classic ICT manipulation-to-displacement setup.
The Alligator indicator (Bill Williams) is starting to compress, showing potential for a phase transition from accumulation to the next impulsive wave. The lips (green), teeth (red), and jaw (blue) are beginning to align for a possible bullish cross, hinting at trend awakening.
Smart Money Confirmation (SMC):
Liquidity sweep: Below equal lows
Market structure shift: Minor break of structure on LTF
Entry: On fair value gap (FVG) + alligator compression zone
Stop loss: Below liquidity sweep zone (0.005286)
Take profit: Targeting the previous structural high (0.005835)
Trade idea:
🟩 Entry: 0.00543
🔴 Stop: 0.00528
🎯 TP: 0.00583
RR ≈ 3.2:1
📈 If bullish momentum continues and the Alligator opens upward with green lips leading, we could see continuation toward the upper range liquidity.

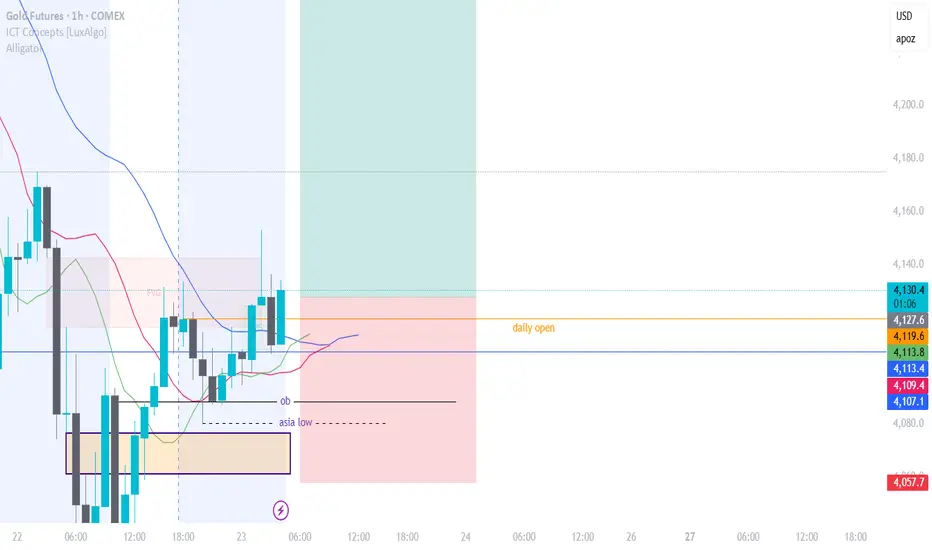
GOLD LONG 1hr setup
### 🧠 **Market Context & Liquidity**
- Gold took out some sellside liquidty
- We’re watching for whether buyers hold above the daily open or if we see a pullback into support.
- Key levels to watch:
- **Resistance:** 4,128 – 4,130 (recent high)
- **Support:** 4,107 – 4,112 (consolidation low & potential buy zone)
---
### 🐊 **Bill Williams Alligator Signal**
- The **Alligator** is awake and aligned — jaws above teeth above lips — indicating a **trending market**.
- Price is trading **above the Alligator**, supporting a **bullish bias**.
- Pullbacks into the Alligator (lips/teeth) are potential entries if structure holds.
---
### 🎯 **Gold (GC1!) Trade Plan – Long Setup**
- **Entry Zone:** 4,110 – 4,128 (support + Alligator confluence)
- **Stop Loss:** Below 4,057
- **TP1:** 4,128
- **TP2:** 4,200 4hr fvg (sibi)
---
### ✅ **Confirmation Needed:**
- Bullish reaction off support with volume.
- No loss of 4,107 level.
- Alligator continues pointing upward.
---
**Bottom Line:**
Gold is in a bullish structure above the Alligator.
Look for longs into support with a tight stop.
Trade the pullback — not the breakout.