AdEx VS Bitcoin - Medium Term OutlookFollowing the previous idea on ADX/USD , it has reached the upside target and rejected it. Pretty much the same is happening with Adex against the Bitcoin as it has approached the resistance at 25k satoshi.
This level has been acting as a support well as the resistance between August and September, so now the history may repeat itself. Not to mention that ADX/BTC reached the top of the descending channel and is very close to 2/1 Gann Fan trendline. 25k satosi support area could be acting as a strong resistance and could potentially send Adex back to the 200 Moving Average or the uptrend trendline.
On the upside note, break above the 25k resistance could prove that the trend up continues and then a buying opportunity might present itself. As for now, Adex remains a risky coin to hold.
Bitcion

Qtum VS Bitcoin Rising To Form Double Top?Qtum managed to break above the descending channel and 200 Moving Average suggesting that is it ready to continue trending upwards. QTUM/BTC producing higher highs and higher lows while trading within the ascending channel.
The overall trend is definitely bullish and Qtum should be moving higher to test 227.2% Fibonacci retracement level applied to the corrective wave after the descending channel breakout. This resistance is based at btc 0.0056 which is very close to the previously formed top in August last year.
The btc 0.0056 is the very first strong resistance for Qtum and it would be interesting to see the price action around this level, which should provide more clues about the further direction of QTUM/BTC. At this point, Qtum could continue trading within the ascending channel and could even move back to test the 38.2% Fibonacci support, which in fact has been already rejected. In the worst case scenario price could drop towards the 200 Moving Average, but only break below it should invalidate bullish outlook.

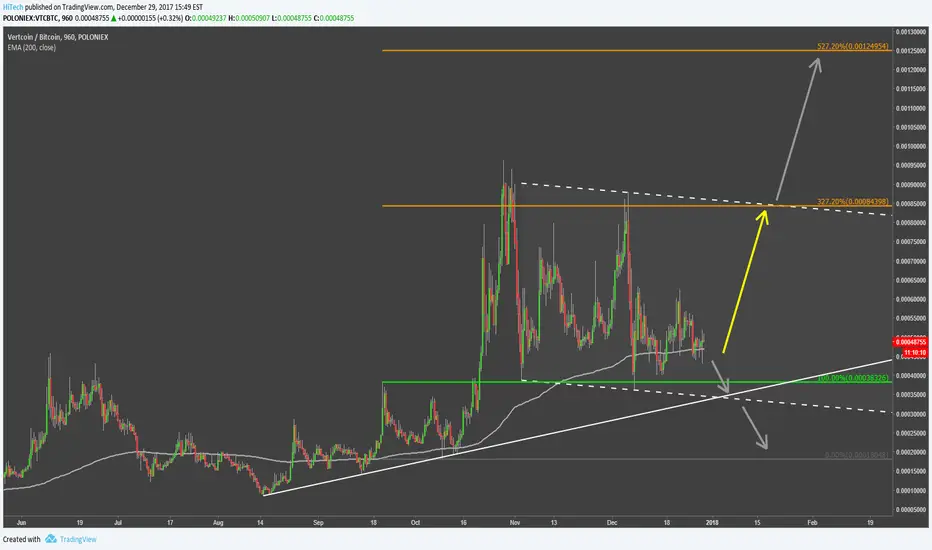
VertCoin - A Risky Purchase?During the past 6 months Vertcoin has been moving upwards against Bitcoin, although at the end of October when it reached the 96k satoshi high, the price dropped strongly. The wave down was stopped at the previous resistance near 40k satoshi.
This is when a consolidation period started and since then VTC/BTC continued to trade within the range between 40k and 85k satoshi. While the support is holding it is likely that range trading will continue and VertCoin will go towards the 85k resistance once again. Nevertheless, although the upside potential is there, VertCoin remains a risky investment as price still could go back to test the uptrend trendline near 35k satoshi level.
Bitcoin Cash BreakoutBitcoin Cash has continued its rally, pulling back only slightly to join IOTA in entering the second phase of the impulse wave. It is a banality at this point to mention that we have been pushing the upper bound of the KRI during this breakout, and a red triangle marks a brief retracement, that should portend a possible buying opportunity especially if BCH retraces further. Watch for it to form a dragon head formation before breaking out again.
Interested in the Altcoin Index and the Crypto Spread Indicator? Check them out here !
For daily commentary on cryptocurrencies, subscribe to our newsletter !

The Rise Of BitcoinCash - Plotted SpeedBump Resistance Lines Lets get right down to it. First the disclaimer.
Not financial advise, dont bet the farm... you know dont make any bets based on this opinion. Seek financial advance from a qualified advisor and do as much research as possible before making any trade.
The Update
~~~~~~~~~~~~
Sorry to the people that follow us on Twitter waiting for these and previous plotted lines on a chart. We face certain problems trying to calculate on such a big currency such as BCH. The straight answer is that there are alot of different exchanges and those pools of volume must be taken into account before coming up with the lines. We chose BITFINEX for plotting our resistance lines since it has the least amount of drift when calculating using (Vs. BTC).
If you followed us on Twitter (here twitter.com) , we posted the first few lines of resistance already which seem to be holding up very well. Up till now our 3712 was our outer orbit of resistance. This is because it will take a very large amount of volume above this line to break it. And looking at the numbers today (right now) there isnt enough escape velocity to break it. We believe (and hope) this will result in some consolidation. $BCH needs to digest the move that has already happened to keep things together.
New SB Resistance lines
SBR9 =9355.48
SBR8 =8001.6
SBR7 =7371.06
SBR6 =6052.67
SBR5 =5799.1
SBR4 =4403.7
SBR3 =3712.52 (Contested - needs a lot of volume to break)
Support =3333.23 (Resistance Defeated)
Support=3122.09 (Resistance Defeated)
Lurker Buyer =3077.87 (Last seen a while ago. Not seen since.) Will post when #Mudspike occurs.
Who is #MrBlackhole
~~~~~~~~~~~~~~~~~~~~~
There is a very large buyer we have detected in 3 cryptocurrencies and seems to have a very heavy influence. It seems this person/bot is buy side only and does not sell. This is why we branded him MrBlackHole. That said this is has made predicting movements higher easier because there is a very predictable incremental jumps buying levels. For some this sounds like pixie dust and hog wash. But if you look at our twitter and Trading view posts on VTC Vercoin, we have been able to predict levels of resistance before it even trades there. More recently we have been initiating coverage on BCH but unfortunately we do not have the sources to keep it up. So we will not be providing on going coverage beyond what we have posted here. The computing power, data storage and time required is .... taxing on our resources.
We will be providing coverage on one other coin in the coming days as soon as we verify the numbers. Now that we are finished with $BCH we will be focusing on the quieter coins.

IOTA UnstoppableIOTA seems unstoppable at this point, careening through the $1 and $2 handle, smashing through psychological and technical levels of resistance from above. It cut through the $3 handle with ease, and it is hard to fight the urge to chase this altcoin. Any dip should be seen as ripe for entry at this point, though one should consider taking some profits from this meteoric rise.
Check out my exclusive indicators !


Ripple Bullish But Facing ResistanceRipple just can't seem to get the memo the bulls left for cryptos. It's facing strong resistance at highs, despite hugging the upper bound of the Kovach Reversals Indicator. Both Kovach Momentum Indicators are chugging along, so hopefully we can push past this resistance soon. The Elliott Wave is a bit foreboding as we are far away from new highs at $0.40. I'm not entirely convinced of my representation of the current impulse, but my best guess is that we are in Wave 3 of the impulse of the 5-3 wave, which means we should be able to gain more traction as this is the longest and strongest phase.
Until then, turn to other altcoins for greener pastures.
If you like the Kovach Momentum and Reversals Indicator check them out here ! Also included in the package are crypto specific indicators!

BTCUSD BITFINEX - Inception TrianglesSomething I've been looking at. Added some other smaller trend lines to comply with some discussions with Automox. Still short due to volume dropping over this pump. Time will tell.

Bitcoin - Target 6600 [with quick exit plan]If the time is due for correction in bitcoin , the target is 6600. Rising wedge broke down with a strong spike and now consolidating. Will be taking a short at the top of the consolidation. THIS TRADE MAY FAIL. THIS IS NOT A HIGH PROBABILITY TRADE(because of the tight stop loss). BE PREPARED TO EXIT IF THE FLAG IS BROKEN UPSIDE.

BITCOIN (BTCUSD)People have been selling off on the climb.. The question is wether the suckers will continue to buy or more will sell. There is divergence as evidence of this happening. Does new buyers come in and make Bitcoin surge to the moon or are we in for a healthy BIG correction of selling, taking home profits? I would suggest the latter, the risk is too high not to take home a large portion of profits here...

Bitcoin BREAKOUT signal in Korean WonCheck out Bitcoin in Korean Won. It has already broken through those all time highs.
Unless this breakout fails and it crashes back through support, that is a very bullish sign for Bitcoin in USD.
Korea is always ahead of the USD market in Europe and the States, so this is certainly a strong tailwind that adds further momentum to our thesis that Bitcoin will break 5000 in USD soon.


BITCOIN: Short-term channel channel BuyShort-term buy..... look for the price to bounce of the support line

Bitcoin bullrun in anticipation of Segwit activation?If bitcoin goes on a bull run in anticipation of segwit activation mid to late august, expect a price of around $3950 at top of channel. #btcusd

BITCOIN: At Key Resistance (Short-term Sell)Sell now for short profit.... Wait for Long position when price drops to 2700-2800....


Posible short term winIn this trade that I opened on the 2nd of July I have a target Price of 2,900 BTC. Entered at the price of 2,500 with a Stop Loss of 6%, 2,350. I put this stop because is where the price could touch the low end of the Bollinger band. With a target price of 2,900. This is kind a risk and speculative move and if it does not brake the upper line of the triangle I will take my profits, but if it breaks it, I really think it could go up until 2,900.
But I will be very careful and I putted a little money buying BTC, if the coin breaks the 2,400 support is very probable that we see a down trend.
If someone was wandering why I put my Stop Loss on 2,350 and not in 2,400 is to a leave a little space for a confirmation of the support line.


US30 SELL SELL SELL 8000 PIPS TARGET :) I took a sell trade over a month ago
This setup may seem crazy and unrealistic
but i truly believe take profit will be hit by the end of 2016
Reasons behind this many reasons which i will not go into but if anyone would like to no why
contact me i have no issues with explaining :)
8000 pips here we come

Update: Bitcoin Back at Support for an Up SwingThis is actually a hard call because those that have followed me for a while know how much much i love my Triangles, which were very reliable in 2014, not as much in 2015. Statistically a Descending Triangle should break to the downside 2/3 rds of the time, but as we saw in late June, there was additional support via 50-day SMA to make the triangle break out to the upside. It appears we are facing the identical situation again just on a slightly bigger scale. (Fractal Fans Around).
In addition to the 50-day SMA we have the 3rd of our trend lines being hit right now and this is the one we are expecting to hold. The MACD and RSI are not ideal for a turn here and still have room to the downside but I'm being optimistic and a bit premature as I missed good entries on the last two up swings this summer waiting for a larger pull back each time to more sound support.
If the price does break to the downside there should be additional strong support around the $255 area and the 200-day SMA. As it stand right now the Swing target off support is the $320-330 area. Conservative stop loss with a close under the 50-day SMA and a lenient stop loss with a close under the 200-day SMA which has finally turned back up.
Good luck traders,
Please check out my more detailed Weekly Traders Newsletter published at BraveNewCoin:
bravenewcoin.com
And my weekly articles: bravenewcoin.com
I will also be speaking at several events this year like NYC LibertyFest, Inside Bitcions South Korea and San Diego along with a few more.
Tone Vays:
@Tone_LLT
