BITCOIN CRASH! TIME TO BUY?I hope you guys enjoyed the video! If you have any questions or comments; feel free to comment down below
Bitcoin (Cryptocurrency)

Bear Cycle Beginning(On the Daily Chart)
2-3 days ago, Bitcoin officially broke down and out below the upward channel it has been in for over 1050 days. It broke down from the channel, retested the bottom of it, and now is continuing downward to make a lower low today.
THAT IS BAD. Muy malo.
Sehr schlecht. Molto male.
The RSI is also confirming a break to the downside.
This time frames match with prior cycles.
Potential correlation to halving cycles is noted.
Note: The 2 year expansion and contraction cycles are exponential in growth while if you look at them is totality, the upward trend shows a logarithmic curvature when you connect the highs from the last 12 years.
IF,
This is a normal bear cycle pullback like the last few, we'll see 30k.
(Yellow Path)
We can't really know for sure, so it's silly to anticipate for this, but as an alternate case,
IF,
This is the end of the larger cycle, meaning the end of Act 1, where crypto doesn't bottom until it is announced dead in the newspapers, then just set a reminder in 5 years to check back unless you want to swing trade the thing with massive volatility.
(Red Path)

Ray Dalio’s bubble warning aged fast today Ray Dalio’s warning not to “sell just because there’s a bubble” didn’t land today as a delayed September jobs report showing 119,000 new jobs cut into hopes of a December Fed rate cut.
The S&P 500 swung from a 1.9% gain to a 1.1% loss, and the Nasdaq flipped from up 2.6% to down 1.5%. The S&P 500 chart now shows declining momentum with lower highs forming. That kind of engulfing behaviour can mark exhaustion phases in extended rallies.
Bitcoin also unraveled, dropping nearly 5% and sinking back under 87,000 as liquidations accelerated. The current monthly candle could be confirming a potential shift in trend momentum after a multi-year climb.

TradeCityPro | Bitcoin Daily Analysis #226👋 Welcome to TradeCity Pro!
Let’s dive into today’s Bitcoin analysis. Our new short triggers have activated, and the market is continuing its downward movement.
⏳ 1-Hour Timeframe
After Bitcoin made a fake downward move yesterday, today it formed a lower high below 93,555, and after breaking the 90,489 and 88,825 levels, it is now continuing strongly to the downside.
⭐ A very large amount of selling volume has entered the market, giving full control to the sellers. The downtrend is continuing with strong momentum.
✨ The next support levels are 85,846 and 83,333.If you already have open short positions, you can use these levels for partial profit-taking.
✔️ The RSI oscillator is currently in the oversold zone, around 21.53.Breaking this level could push the bearish move even further.However, if RSI gets supported here, momentum may weaken, and a correction could begin.
💡 If a correction happens, the resistance zones to watch are 88,825 and 90,489.Our main confirmation for a trend reversal will still come after breaking 93,555.
❌ Disclaimer ❌
Trading futures is highly risky and dangerous. If you're not an expert, these triggers may not be suitable for you. You should first learn risk and capital management. You can also use the educational content from this channel.
Finally, these triggers reflect my personal opinions on price action, and the market may move completely against this analysis. So, do your own research before opening any position.

MSTR to $676MSTR is on major support, looking to run to $676 once bitcoin lifts (currently just below it's long term trend buy area).
Good luck!

Should I sell Bitcoin?This chart is to offer up some guidance to those thinking of selling.
Trend lines are made to be broken. They express the rate of increase at the absolute bottom of the selling. So when a trend line breaks you're now in the area you actually want to buy for long term as a new trend will form from that low.
As you can see with past Bitcoin trends whenever there's a new low made, that's where the price eventually wants to come back to. And if the move above the trend was significant enough it will likely break it as people sell at the bottom. Currently as you can see from the Yellow section we are in a steady trend much like the latter part of 2016-2017. We've made small moves up to the previous (covid low) trend line and back down. These oscillations have been historically quite small. So any moves below this trend line are likely not to be significant.
If Bitcoin ever attempts a move up into the covid low channel at makes it up to that upper trend line, That would be a significant rise and would very likely follow a significant fall.
As for right now Bitcoin has breached the trend line slightly and is in what I would consider an opportunistic buy area with very low downside risk.
Good luck!

XRP HOLIDAY SALE!The overall crypto market has been sliding off recent highs since late September. This was after crypto markets created gap structures on the October 10th sell off. The gap left on XRP was priced in near $1.99-$1.98. We have just reached this liquidity zone. I expect fear to boost and bears to be trapped as the crypto season approaches the holidays, this should be an early Black Friday sale to new highs toward $4 and higher.
Happy Thanksgiving and Early Christmas
-This is not financial advice, R2C.

BTCUSDT.P - November 21, 2025Price is in a short‑term downtrend, with a series of lower highs and lower lows after rejecting the highlighted resistance area near 92,300–92,500 and breaking back below intraday consolidation. Loss of upside momentum and a rotation from a prior minor rally confirming sellers’ control and opening the door for continuation toward the marked support area around 88,800–89,200.

BTC LAST CHANCE OR DIE IN BEAR MARKET We are in the most critical part of this decline. Keep in mind that the previous fractal fell to this area and bounced strongly. I am expecting the same here; otherwise, a close below 85K means a bear market, so stay alert. BINANCE:BTCUSDT

Bitcoin Roadmap: Is This the Beginning of the Short-Term Rally?Today I want to share with you the Bitcoin ( BINANCE:BTCUSDT ) chart on the 15-minute time frame. This analysis is in line with the previous analysis (still valid) .
These days, considering that Bitcoin is facing many parameters to analyze. One of the most important parameters is the SPX500 index ( SP:SPX ). I am long on the SPX500 index.
Bitcoin is currently moving in the Support zone($91,900-$88,400) and near the Support lines and Cumulative Long Liquidation Leverage($91,131-$90,477) .
In terms of Elliott Wave theory, it seems that Bitcoin completed wave 5 with an Expanding Ending Diagonal , and we can now expect the start of the bullish waves , at least in the short term .
I expect Bitcoin to start rising from the Support zone($91,900-$88,400) and at least attack the Resistance lines . If the Resistance lines and the $95,700 level are broken with high momentum, we can expect further growth of Bitcoin.
First Target: $93,921
Second Target: $95,273
Third Target: $97,477
Stop Loss(SL): $89,537
Points may shift as the market evolves
Cumulative Long Liquidation Leverage: $88,570-$87,227
Cumulative Short Liquidation Leverage: $94,500-$93,785
Where do you think Bitcoin’s correction will go?
Please respect each other's ideas and express them politely if you agree or disagree.
Bitcoin Analysis (BTCUSDT), 15-minute time frame.
Be sure to follow the updated ideas.
Do not forget to put a Stop loss for your positions (For every position you want to open).
Please follow your strategy and updates; this is just my Idea, and I will gladly see your ideas in this post.
Please do not forget the ✅' like '✅ button 🙏😊 & Share it with your friends; thanks, and Trade safe.

$BTC 4H Analysis – Clear Bullish Structure FormingRight now on the 4-hour chart, BTC is clearly building a strong bullish pattern.
🔹 Price action is forming a clean Inverse Head & Shoulders structure.
🔹 RSI is showing a bullish divergence, meaning momentum is strengthening while price is stabilising.
🔹 This setup usually indicates a breakout move once the neckline is breached.
If BTC starts rising from the current zone, the market is likely to grab liquidity near the $97,000 level, which is the next major area where stop-loss clusters and pending orders are sitting.
In simple terms:
BTC looks ready for a bullish expansion — liquidity target: ~$97,000.
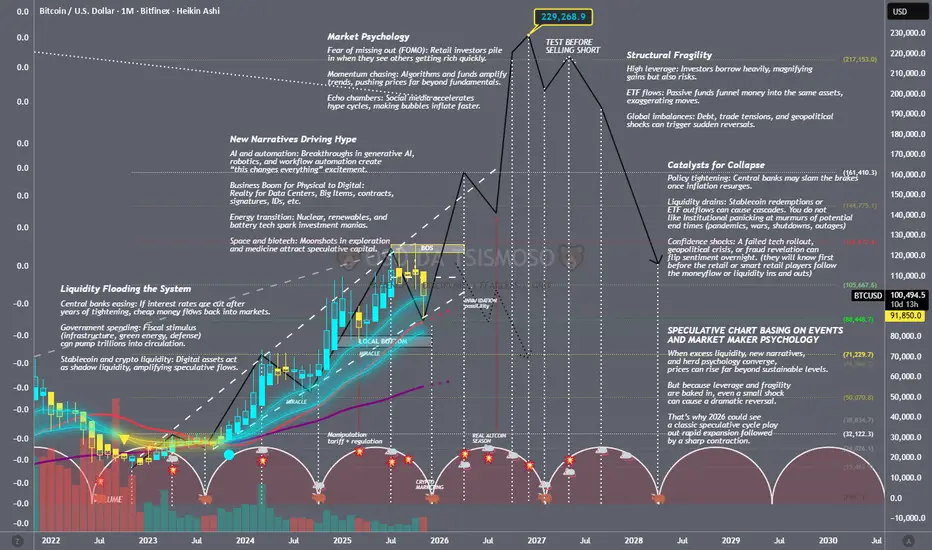
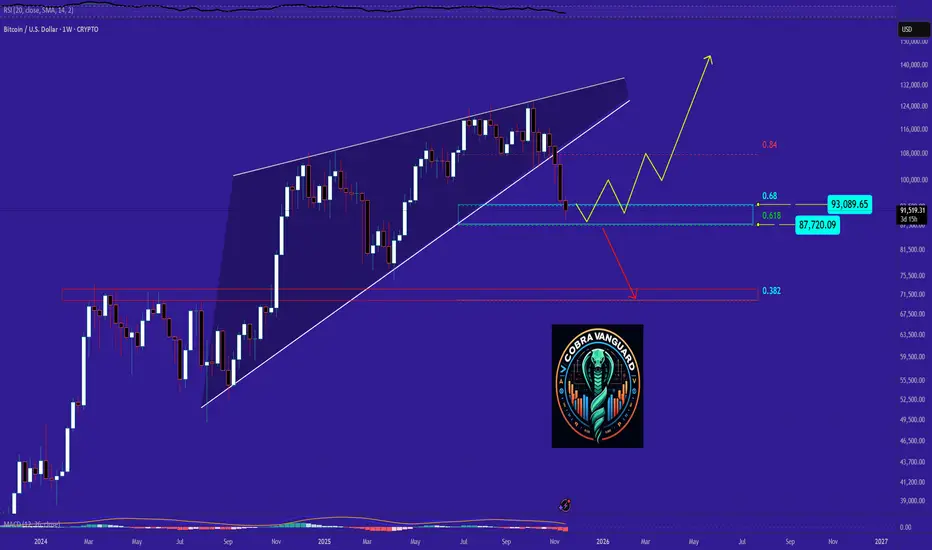
SPECULATIVE CHART (EVENTS AND MARKET MAKER PSYCHOLOGY FOR BTC)📘 Bitcoin Speculative Cycle (2026 Potential move I see)
1. Recognize the Setup
Liquidity conditions: Track central bank easing, stablecoin issuance, and ETF inflows. These are the fuel.
Narratives: Watch for hype drivers (AI + blockchain, tokenized real‑world assets, sovereign adoption).
Sentiment signals: Social media buzz, Google Trends, and retail inflows often spike before parabolic moves.
2. Identify the Expansion Phase
Price action: BTC breaks prior cycle highs with strong volume.
On‑chain metrics: Rising active addresses, increasing exchange inflows, and high leverage in futures.
ETF/Institutional flows: Monitor daily net inflows into Bitcoin ETFs — they magnify moves.
3. Ride the Momentum
Entry strategy: Scale in during confirmed uptrend (higher highs, higher lows).
Risk management: Use stop‑losses or hedge with stablecoins; never go all‑in.
Position sizing: Keep leverage modest speculative cycles punish overexposure.
4. Spot the Peak
Excessive leverage: Funding rates go extreme, perpetual swaps show unsustainable longs.
Retail mania: Everyone is talking about BTC, mainstream media runs “get rich quick” stories.
On‑chain warnings: Whales start sending coins to exchanges, signaling distribution.
5. Prepare for the Collapse
Exit strategy: Scale out when parabolic moves stall; don’t wait for the top tick.
Liquidity drains: Watch stablecoin redemptions and ETF outflows they trigger cascades.
Policy shocks: Rate hikes or regulatory crackdowns can flip sentiment instantly.
6. Survive and Reset
Capital preservation: Rotate into cash or defensive assets once the downtrend is confirmed.
Audit your trades: Document entries/exits to refine your playbook for the next cycle.
Re‑accumulate: Buy back BTC only after capitulation signs (low volume, despair, long consolidation).
🛠 Tools I used to track this;
On‑chain dashboards: Glassnode, CryptoQuant (free tiers give useful signals).
ETF flow trackers: Daily inflows/outflows for spot BTC ETFs.
Stablecoin supply charts: USDT/USDC issuance as shadow liquidity indicators.
Funding rate monitors: Binance, Bybit, Deribit for leverage extremes.
BTC FORECASTTrain your eyes and read the charts mind. Hoping to see a sell off and wait for more big boys accumulation before any major bounce

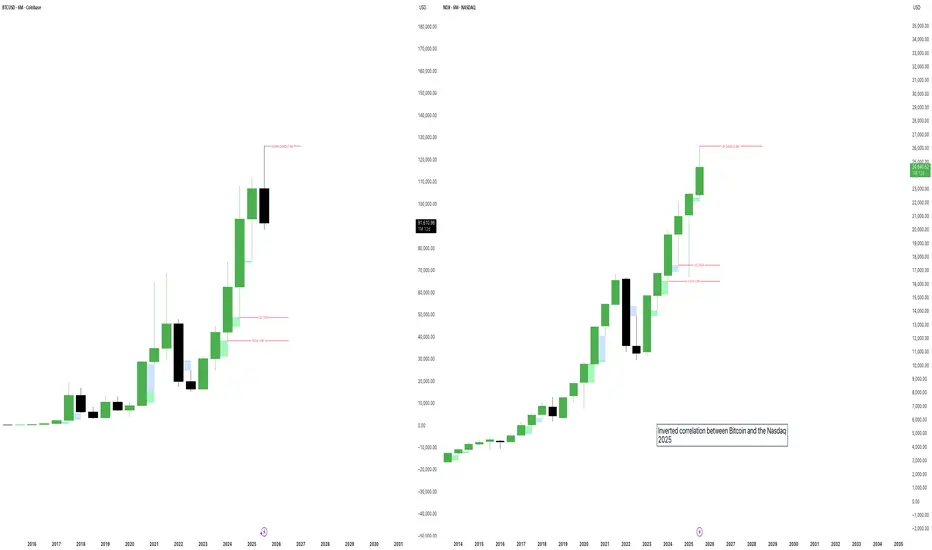
Inverted correlation between Bitcoin and the Nasdaq 2025There have been unusual behaviors between the NQ and BTC, which are normally highly correlated assets. However, this year the April dump on the NQ pushed the price down to the Q2 2024 low and came very close to the overall 2024 low — it missed it by only about 300 points. Bitcoin, on the other hand, wasn’t even close to its Q2 2024 low: the price dropped to $74,500, while the Q2 low sits at the $49,000 level.
On the flip side, the current 6-month candle on the NQ is still strongly bullish (as of November 20, 2025), while BTC’s 6-month candle is already strongly bearish. It opened at $107,000, and yesterday’s low (November 19) was $88,500 — meaning it would take a significant move for Bitcoin to close the half-year candle in the green, especially with less than six weeks left until the end of the year.
I’m very curious to see how the year closes out. Personally, I remain on the bearish side and have been shorting the market since $124,500 on BTC, adding to the position again at $115,500 and $107,300.
Greetings to all.
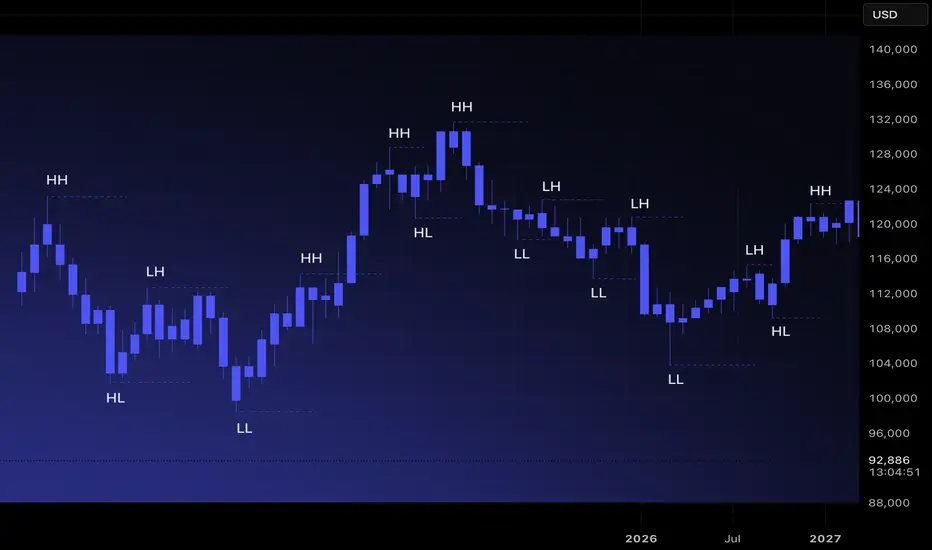
Market Structure 101: Navigating Price ActionMost traders jump directly into indicators, oscillators, or patterns. Yet every chart has a deeper foundation that determines direction long before any tool is applied. Market structure is that foundation. When you understand how price forms highs, lows, and transitions between them, you stop reacting to noise and start reading the market’s intent. It is the base layer that allows you to build a clear, consistent bias.
Price moves because buyers and sellers interact around key levels. Structure highlights where momentum strengthens, weakens, or reverses. By tracking how highs and lows evolve, you can identify trend, consolidation, and shifts in direction with far more clarity than any indicator can offer. Market structure is objective. It gives you a rule-based lens to interpret movement across all timeframes.
Understanding Highs and Lows
There are four structural components every trader must recognize.
Higher High (HH): Price breaks above a previous high, showing buyers in control.
Higher Low (HL): Price pulls back but stays above the prior low, confirming trend continuation.
Lower High (LH): Price rallies but fails to reach previous highs, indicating weakening demand.
Lower Low (LL): Price breaks below the previous low, signaling sellers taking control.
These sequences are the building blocks of trend identification. When mapped correctly, they remove guesswork and reveal underlying momentum.
Identifying Uptrends and Downtrends
Uptrend: A sequence of HHs and HLs. Buyers consistently push price higher and defend higher floors.
Downtrend: A sequence of LHs and LLs. Sellers control direction, rejecting higher prices and driving the market downward.
A trend remains intact until structure breaks. This is why experienced traders avoid predicting reversals and instead follow structural evidence. When the market prints new HHs and HLs, the bias remains long. When LLs and LHs appear, the bias rotates short.
Ranges and Consolidation
Markets do not trend all day. Much of the time, they move sideways. A range occurs when highs and lows stay relatively equal, creating a horizontal zone with equal highs and equal lows. This is where compression happens. Liquidity builds above the range highs and below the range lows, and trend often resumes only after one side of the range is taken.
In ranges, structure becomes neutral. Bias is formed only when price breaks out and retests with confirmation.
Break of Structure(BOS) and Trend Shift
A break of structure occurs when the market violates the pattern of the existing trend. In an uptrend, a break occurs when price prints an LL. In a downtrend, a break occurs when price forms an HH. This signals a potential shift in momentum.
Breaks of structure matter because they identify turning points without relying on subjective signals. They show where one side loses control and the other gains traction. They also create clear invalidation points for risk management.
How to Read Structure Across Timeframes
Market structure becomes even stronger when used across multiple timeframes. The higher timeframe sets the primary bias. The lower timeframe provides entry precision.
Weekly or Daily: Structural trend and major zones.
4H or 1H: Execution windows and key shifts.
15m and 5m: Entry confirmation.
When all levels of structure align, the probability of a clean move increases significantly.
Avoiding Common Mistakes
Many traders misread structure by focusing on every small fluctuation. Structure is defined by meaningful swings, not micro noise. Another common error is assuming a single HH or LL immediately reverses a trend. Context matters. Breaks followed by continuation and retests confirm the shift. A disciplined trader waits for structure to become clear instead of acting on isolated candles.
Turning Structure Into a Bias
Structure simplifies decision-making.
If the market is printing HH and HL formations, you prioritize longs.
If it is printing LH and LL formations, you seek shorts.
If highs and lows are equal, you wait for a breakout.
bitcoin Outlook after the Dip. What to expect NOW?After breaking out of the descending wedge, the price has reached a very strong PRZ (Potential Reversal Zone) support area. If the price holds this zone, there is hope for a rebound toward new highs. However, if this support fails, the price could drop below $70,000.
BITCOIN Is Bullish! Long!
Here is our detailed technical review for BITCOIN.
Time Frame: 9h
Current Trend: Bullish
Sentiment: Oversold (based on 7-period RSI)
Forecast: Bullish
The market is on a crucial zone of demand 91,866.60.
The oversold market condition in a combination with key structure gives us a relatively strong bullish signal with goal 98,030.74 level.
P.S
The term oversold refers to a condition where an asset has traded lower in price and has the potential for a price bounce.
Overbought refers to market scenarios where the instrument is traded considerably higher than its fair value. Overvaluation is caused by market sentiments when there is positive news.
Like and subscribe and comment my ideas if you enjoy them!

BOUNCE TO 98-100KMorning folks,
Last time we explained in details the fundamental background, so BTC remains bearish. But now it stands at weekly oversold and around 95K Daily support area. This creates friendly background for tactical bounce.
On 4H chart we have DiNapoli DRPO "Buy" pattern, that suggests upside bounce to 98-100K area at least.
That's being said, don't take any new shorts right now - wait for the pullback. For bullish intraday position, you could try to use this DRPO pattern. Don't place too far stop, just under lows should be enough, but be aware of NFP volatility today...

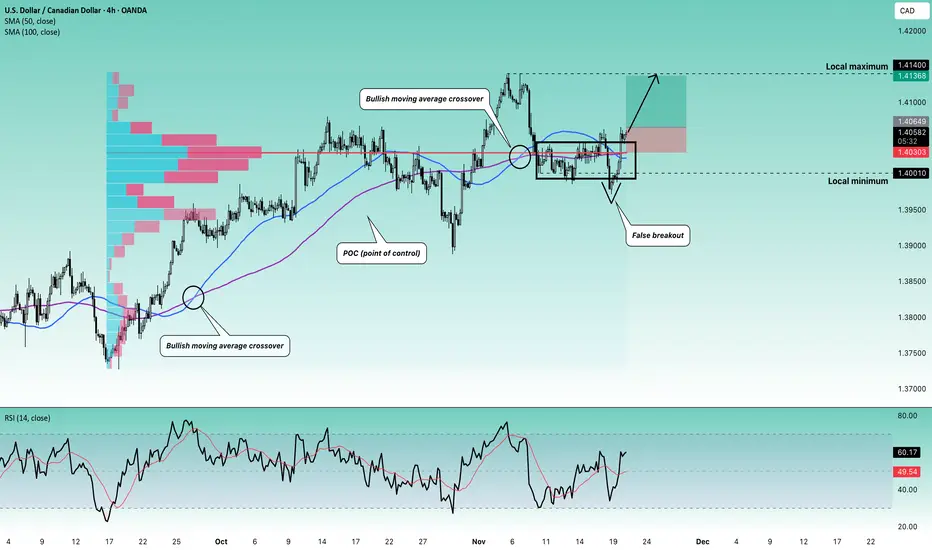
Stop!Loss|Market View: USDCAD🙌 Stop!Loss team welcomes you❗️
In this post, we're going to talk about the near-term outlook for the USDCAD currency pair☝️
Potential trade setup:
🔔Entry level: 1.40649
💰TP: 1.41368
⛔️SL: 1.40303
"Market View" - a brief analysis of trading instruments, covering the most important aspects of the FOREX market.
👇 In the comments 👇 you can type the trading instrument you'd like to analyze, and we'll talk about it in our next posts.
💬 Description: This currency pair was previously defined as a buy pair, and this one is proceeding exactly as per the previous analysis, with the buy priority remaining. Given the current context, namely, a breakout of the upper balance boundary above 1.40010, an additional, shorter-term buy trade can be considered with the same target as before, namely, near 1.41400.
Thanks for your support 🚀
Profits for all ✅
BTCUSD – Outlook for the Coming MonthMonthly View
The monthly timeframe remains bullish overall, but Bitcoin has pulled back to gather strength. This kind of move is typical when the market is gearing up to break a higher high. The broader structure hasn’t shifted—this is simply a deeper retracement inside a bullish narrative.
Weekly View
The weekly chart is showing a similar story. Price has been dropping consistently without giving even a single proper reversal. If BTC truly wanted to fall aggressively, it would normally make a move up first, trigger traders’ stop-losses near previous highs, and then dump. But this time, it didn’t do that.
This unusual behavior hints that the market may be preparing something different from what most traders expect.
Daily View
The daily timeframe is where things get really interesting. Bitcoin spent more than half the recent sessions moving sideways, collecting liquidity on both sides. After that, it dipped and formed a lower high—but that lower high hasn’t been broken yet.
According to my analysis, BTC is currently sitting in the Discount Zone, an area where buyers often start becoming active.
4-Hour View
On the 4H chart, I already had a clean short setup earlier, but now I’m watching for signs of a potential reversal. That reversal idea is not guaranteed, though—it becomes invalid if BTC fails to break the series of lower highs.
There’s also another scenario: BTC might refuse to break the lower highs and begin forming higher lows at the same time. If that happens, we’ll see a period of sideways consolidation. When the breakout finally comes—whichever direction it chooses—the move is likely to be powerful.
Final Thoughts
Based on my analysis, BTC is showing mixed but promising signals across the higher and lower timeframes. The monthly structure is still bullish, and this pullback looks more like preparation for a stronger push rather than a trend reversal. Weekly price action hasn’t shown any meaningful bounce yet, which is unusual—and that alone hints that the market might be setting up something unexpected.
On the daily chart, BTC has swept liquidity after moving sideways for quite a while, and now it’s resting in the Discount Zone, where smart money usually becomes active. The 4H timeframe already gave clean short opportunities earlier, but now the market is approaching a point where a reversal could begin—unless lower highs remain untouched.
If BTC starts forming higher lows without breaking lower highs, the market will likely slip into a compression phase. When price finally breaks out of that squeeze, the move—up or down—can be very strong.
Again, this is just my personal viewpoint. Please do your own analysis before investing. Your profits and losses are entirely your responsibility—I’m only sharing what the charts are suggesting to me right now. Stay alert to the reaction levels ahead; that’s where the next major direction will reveal itself.
----------------------------------------------------------------------------------------------
Thanks for checking out this analysis! If you enjoyed it, hit that follow button so you don’t miss future updates. And if this breakdown helped you out, drop a like 👍 and share your thoughts in the comments 💬—I always appreciate the feedback!

Would history repeat itself?Would history repeat itself — or would this time be different?
In previous rally, Bitcoin often rallied, consolidated, then experienced a deep washout before breaking into a new all-time high.
Now we’re seeing a similar setup: a strong rally, followed by consolidation…
but the question is — will we see another deep correction first, or will Bitcoin break directly into a new ATH this time?

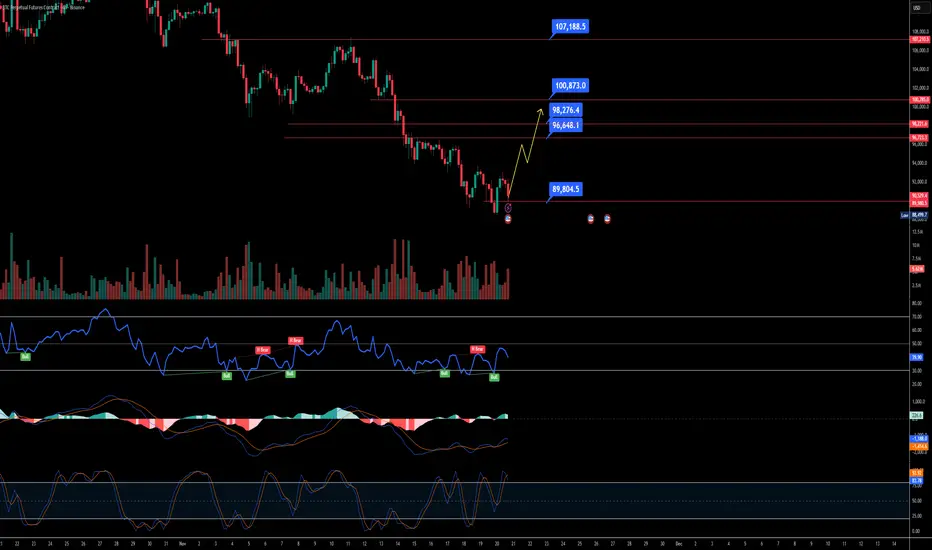
Bitcoin Downtrend UpdateAlright friends, Bitcoin has confirmed its intention to move toward 86,000 and lower.
My previous forecast with the invalidation zone at 96,600 is still valid, but I decided to make a fresh post.
At the moment, my new invalidation level is 96,012.5.
From a broader perspective, I’m still expecting Bitcoin to reach 83,000.
But as I mentioned earlier, we first need to see 86,000 tested — because once that level is hit, Bitcoin may go into a correction before continuing toward 83,000 and below.
Yes-yes, I do expect it even lower, but more on that in the upcoming updates.
Make sure to follow so you don’t miss them

Bitcoin Holds 90k (For Now), 70k A Real PossibilityMy bearish bitcoin target outlined in the middle of October came to fruition this week. I update my levels and technical reasoning as to how it could still head for 70k after a potential bounce.
Matt Simpson, Market Analyst at City Index
