btceur bull market till May 2022 at 15000 on 10 week cyclesIf bitcoin will not break 65000 €uro ca $75000 in December then we are in bull market and following 5 cycles in 10 week periods till May 2022 will be selling cycles,
Price will slowly fall up to 15000.
Green arrows are the cycles when buying is profitable (except the unpredictable fluctuation in March 2021 the COVID panic month).
Red are the 10 week periods when selling shorting is profitable
Whole is n big parallel channel
Bitcoindollar


BTCUSDT 15 Min Chart Demand & Supply Zones#Bitcoin #BTC 15 Min chart Demand and Supply Levels.
Bullish Supply Range ( Go Long) - USD 19,550- to USD 19,774-
(Blue Circle in Image)
Bearish Supply Range ( Go Short) - USD 20,200- to USD 20,500/-
(Red Circle in Image)
#bitcoin #btc #cryptocurrency #crypto
Current Status - Movement Towards Bull Run.

BTCUSD imbalance filled! Bitcoin filled the imbalance and now we have a potential long to 27'000. I think we are gonna bounce hard here.
What do you guys think? leave a comment down below!

BTCUSD bloody mess.Influencers will scream 30'000 or a new high after we break the trend line.
For me we will just take the Liquidity and move heavy to the down side.
12'000 by no later than end of the year.
Just watch and do the opposite of the "Influencers"
Please dont but all the money on the line, your saving will be gone.
What do you guys think? please comment down-below

Bitcoin - What goes up must come downHappening now: We are looking good on the daily timeframe, BTC has decisively gone over multiple resistance points and continues to cross over them with conviction. The concern is that this is all happening as the leading economies in the world are showing signs of bad times coming, During different times I would say that the bottom was in, but since we are in the times we are in, I would warn you and tell you to be cautious, at this point, I still expect BTC at around 11K.
On the weekly timeframe, I will wait to see if at the very least Bitcoin closes above the 200MA on Sunday. This is like poker and I believe that BTC has a weak hand and it will be coming down soon. I am 66% in and at this point I have nothing to lose if I sit and wait. The last 34% of capital left has to go in at the right time and into the right coin in order to multiply 30+ times.
What is driving this move up? I see it as a two-sided effect. 1. The traditional markets are still posting good gains and profit seems to be healthy in a few sectors. What does that mean? It means that as companies raise their prices you are ok paying a premium for their products therefore they are posting profits. 2. Bitcoin is simply following the Dow, if it goes up so will BTC. However, as far as Bitcoin and crypto are concerned the current bull spike is not sustainable.
VERY IMPORTANT: Hitting the "Like" button is like a tip, please don't forget to do so after reading, this is your way of thanking me for my time and so I thank you for yours.

another bearish BTC prediction based on R.Wyckoff distribution PSY—preliminary supply, where large interests begin to unload shares in quantity after a pronounced up-move. Volume expands and price spread widens, signaling that a change in trend may be approaching.
BC—buying climax, during which there are often marked increases in volume and price spread. The force of buying reaches a climax, with heavy or urgent buying by the public being filled by professional interests at prices near a top. A BC often coincides with a great earnings report or other good news, since the large operators require huge demand from the public to sell their shares without depressing the stock price.
AR—automatic reaction. With intense buying substantially diminished after the BC and heavy supply continuing, an AR takes place. The low of this selloff helps define the lower boundary of the distribution TR.
ST—secondary test, in which price revisits the area of the BC to test the demand/supply balance at these price levels. For a top to be confirmed, supply must outweigh demand; volume and spread should thus decrease as price approaches the resistance area of the BC. An ST may take the form of an upthrust (UT), in which price moves above the resistance represented by the BC and possibly other STs before quickly reversing to close below resistance. After a UT, price often tests the lower boundary of the TR.
SOW—sign of weakness, observable as a down-move to (or slightly past) the lower boundary of the TR, usually occurring on increased spread and volume. The AR and the initial SOW(s) indicate a change of character in the price action of the stock: supply is now dominant.
LPSY—last point of supply. After testing support on a SOW, a feeble rally on narrow spread shows that the market is having considerable difficulty advancing. This inability to rally may be due to weak demand, substantial supply or both. LPSYs represent exhaustion of demand and the last waves of large operators’ distribution before markdown begins in earnest.
UTAD—upthrust after distribution. A UTAD is the distributional counterpart to the spring and terminal shakeout in the accumulation TR. It occurs in the latter stages of the TR and provides a definitive test of new demand after a breakout above TR resistance. Analogous to springs and shakeouts, a UTAD is not a required structural element: CR - school.stockcharts.com

BTCUSD: Next BULL RUN starts! 🚀Hello my friends!
Bitcoin is on track again. I haven't posted that much in the last time. My last post was from 9 February. Since that time I have been buying the dips step by step. My last buy was at 12 May. I waited deliberately until I was writing this post. I wanted to make sure we hit the bottom. We might still have a small dip at the very maximum, but the next BULL RUN has been launched.
NOW to my chart: To evaluate the long-term bottom, its helpfull to use Bollinger Band (Timeframe 3D, Length 150, Source low and StdDev 1.618) in combination with Keltner Channel (1W, Lower Line, Length 86, Multiplier 4, ATR 172) and SMA (1W, 200). The two important indicators (BB and KC) were touched. Only the 1W-SMA200 has not yet been touched. This can still happen in the near future at a possible retest or sideways movement. But is not mandatory.
Bitcoin is on track at its steady uptrend. Our stairs to heaven! My recommendation as always: Buy the dips and hodl. 😀
--
Let's see what happens.
Happy trading.
BTCINVESTING
--
--
My Post Dec 15, 2021
--
My Post Apr15, 2019 (3 years ago!): "BTC: Why will 1 Bitcoin really be worth more than USD 1 million?" I was one of the first btw. ;-)
--

Bitcoin is going to 18k!!! (Bearish Head & Shoulder pattern)I see bearish head & shoulder pattern for bitcoin. This pattern has a target of 18k.
I see also strong support at 30k so this support can hold bitcoin a bit but at the end its target is 18k.
How to calculate head & shoulder pattern target:
www.tradingsetupsreview.com
Have a nice day,
Berk.

BTCUSD - UpdateA reversal should be prompt once 13K - 16K is hit
I am still very bullish on crypto and digital assets


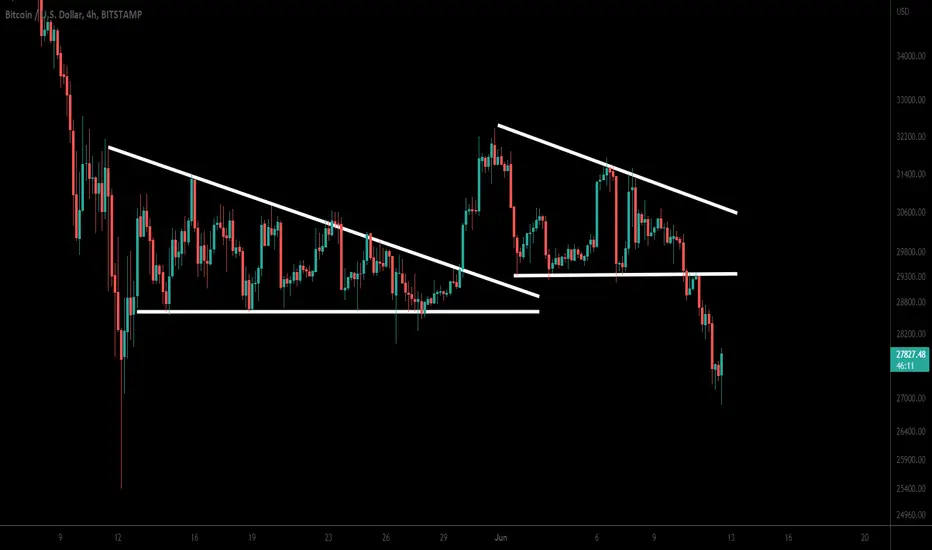
Bitcoin On Chain Analysis Suggesting BTC Is Now In CapitulationHi dear friends, hope you are well and welcome to the new trade setup of Bitcoin ( BTC ).
Net Unrealized Profit/Loss (NUPL):
If we take a look at on-chain analysis then On-chain Bitcoin: Net Unrealized Profit/Loss (NUPL) suggests, that now we are in the capitulation phase.
Broke down the triangle:
On a 4-hr time frame, Bitcoin has formed two triangles and both were descending. The previous one was broken out but the recent one is broken down. Now the target for this breakdown can be $26400.
Big wedge:
On a weekly time frame, priceline is not closed below $28600, and the support of a big falling wedge pattern. If Bitcoin closes below $28600 and the support of wedge, then it may test the weekly 200 simple moving average.
Conclusion:
On-chain analysis is signaling that Bitcoin is going through a capitulation phase. At one side it is not because, thre can be another sell-off, but on the other hand, it can be really
good news, because after the capitulation phase another long-term bullish move can be started.
Bitcoin/USD 1M: EMA(50) and RSI(14) guide us! - LONGHi mates,
One of the most important support lines is touched: EMA50! Bollinger Band gives also support. AND: RSI shows clear signals. Pullback expected!
Indicators:
EMA (50) = Fuchsia
Bollinger Band (1D 400 StdDev 1.618) = Red
RSI (14) = White
--
Much success
tbot21
the trading robot 🤖
--


Bitcoin is bouncing off support and moving towards resistance.Hi Guys
The chart shows BTC vs USDT on the 8 hourly on Coinbase.
Bitcoin is bouncing off the June 2021 ATL (Green Horizontal Line), which is seemingly providing a level of support so far.
Bitcoin is about to re-enter a downward parallel channel (Red Lines) in which you can see has formed strong price points (support/resistance) with the white highlights.
Breaking this channel with strong volume would be a bullish move.
Right now we are getting a lot of side action but it will have to end at some point.
What are your thoughts guys, bullish or bearish?
Like if you agree.
Many thanks,
Casey
Disclaimer: Not professional Advice

BTCUSD Bitcoin : A weekly long-term analysis 2.5Bitcoin is pop culture.
It made a lot of people rich and a lot of people lost money.
Most people lost because of emotional trading.
Smart traders made it big.
If we look at Bitcoin from a rational technical and fundamental perspective this is what we come up with:
*Upside is still very relevant and could be much more significant than any probable downside.
*It must be traded with proper risk management and patience, while considering the worst case scenario.
Thank you so much for reading/watching!
---------------------------------------------------------------------------
I hope my idea was helpful! If so, please like and follow, it would mean the world to me :D
I promise to respond to any and all comments/questions , so please don't hesitate to ask me anything.
Once again, thank you.
---------------------------------------------------------------------------

Bitcoin road to a new high...Hello cryptofolks
Bizzare I dea for Bitcoin here
Will get invalidated if the IHS pattern doesn't come out
Looking for bottom around $19k
-Goodluck
Forza Luna holders

LONG-TERM BITCOIN PROJECTIONHi Guys
We have possibly hit the bottom and here's an idea you may find very interesting that could predict a rough route Bitcoin could take to see new ATH's.
THE LONG ROAD AHEAD
First off the chart: KRAKEN; WEEKLY; BTC vs USDT. The red, yellow and green lines represent areas of support and resistance. The pink dotted line represents a 50% price point between the ATH and the recent low (possibly ATL for 2022). Th blue horizontal Line represents the lowest weekly close since 2021. The White lines represent a price projection.
Unless you've been living under a rock, you would of heard about the Wyckoff Approach, which outlines how massive financial machines buy up or sell off assets.
I found an interesting Reaccumulation Schematic. (See Reaccumulation Schematic 2 in the website bellow)
halotrader.medium.com
This schematic shows very similar price movements (so far) with the weekly price action of bitcoin. Not 100% of course but similar enough to compare.
I traced the exact lines onto the chart and came up with this scenario.
I'm 100% confident the exact lines will NOT be followed but COULD be a helpful guide to judge price direction.
Please Like if you agree and comment with your thoughts.
Many thanks,
Casey
DISCLAIMER: NOT PROFESSIONAL ADVICE.

BITCOIN LONGS 📉📉📉BITCOIN - As usual price made a huge drop below sell side liquidity to take out retail stops, and closed bullish above on the D1 meaning there is a huge potential for the upside movement, fear/greed index is in extreme fear as well meaning there is a good buying opportunity.

BITCOIN CASH LONGS ACTIVE 📉📉📉📉 Expecting bullish price action on BITCOIN CASH as price shifted the market strucutre from bearish into bullish, price just made the retracement back into a bullish orderblock area and for now we have clear area for 350/400$ price area.
What do you think ? Comment below..

Bitcoin | XAU Priced in gold any thoughts on this? BTC/GOLD SUPPJust playing around trying to find true price discovery that makes sense at least, when you price BTC in GOLD you get this support line.

Inside Bar Candlestick Pattern 📉📉📉📉 We will cover the following today:
Inside Bar (Inside Day)
Inside Days
📉 Inside Days are a daily pattern involving two daily candles, we have a day of trade, also known as the ‘mother candle’ and then the following day trades the whole day within the range of the previous day. This is a two-day bias suggesting a potential reversal. A great way to play these sorts of biases is to pre-empt the failure of this reversal, as well as playing the success of the inside day, so what does this look like? Let’s take a look at an example below.
What is an inside bar? The inside bar is a popular reversal/continuation candle formation that only requires two candles to present itself. This pattern is a direct play on short-term market sentiment looking to enter before the 'big moves' that may take place in the market.
📉 Is an inside bar bullish?
Imagini pentru inside bar candlestick
First, unlike other candlestick patterns, inside bars are usually not distinguished as bullish and bearish by their look or color of the body itself, but rather by the location they are at and other peripheral developments
An “inside bar” pattern is a two-bar price action trading strategy in which the inside bar is smaller and within the high to low range of the prior bar, i.e. the high is lower than the previous bar's high, and the low is higher than the previous bar's low.
📉 TRADING WITH THE INSIDE BAR CANDLESTICK PATTERN: TOP TIPS AND STRATEGIES
Some traders consider it a continuation pattern though a breakout in the opposite direction is possible too. After price has trended up (or down) for an extended period, the pause in price movement (represented by the inside bar) precedes a reversal of the trend. Therefore, the inside bar is looked at for a short-term trade (or swing trading) in the counter-trend direction with the goal of holding the trade for less than 10 bars.
However, there is another way to trade inside bars and this is rooted directly from what the candle pattern does NOT reveal. When traders see an inside bar pattern form, it is interpreted as the markets unwillingness to push price higher or lower. This can be for any number of reasons:
An extremely pertinent report is being issued soon, or
The market just made a stratospheric leap and traders are tepid about bidding price much higher or lower.
Whatever the reason, the motive is the same: seeking potential volatility in an effort to increase profitability. When there is a situation in which traders are unwilling to bid price higher or lower, it is seen as a potential situation for future increases in volatility. The inside bar candle pattern is NOT telling traders that the market is bidding price higher or lower but rather that the market is waiting before making the next big move in the asset. This means potential opportunities for traders.
What do you think ? Comment below..

Bitcoin: Holding $41.5K is a must!Hello friends, today you can review the technical analysis idea on a 1W linear scale chart for Bitcoin (BTCUSD).
BTC will need to maintain the $41.5K price area to keep the structure in place. If it wicks lower, that would be okay but a candle body close will be concerning. Keep this chart in mind near the end of the week.
If you enjoy my ideas, feel free to like it and drop in a comment. I love reading your comments below.
Disclosure: This is just my opinion and not any type of financial advice. I enjoy charting and discussing technical analysis . Don't trade based on my advice. Do your own research! #cryptopickk
