BABA 1D Time frame📊 Market Snapshot
Current Price: Around $146–147
Recent Trend: Strong upward momentum over the past weeks
Overall Technical Bias: Bullish, but nearing overbought
🔎 Technical Indicators
RSI (14-day): ~75 → Overbought zone, signals strong momentum but also risk of pullback.
MACD: Positive → Momentum remains bullish.
Stochastic & CCI: High readings → Also showing overbought conditions.
📈 Moving Averages
5-day MA: ~$146 → Bullish short-term support
10-day MA: ~$145 → Still bullish
20-day MA: ~$140 → Strong base level
50-day MA: ~$137 → Medium-term support
100-day MA: ~$130 → Long-term support
200-day MA: ~$125 → Major long-term support
All major moving averages are aligned bullishly.
🔧 Support & Resistance
Support Zone: ~$145–146
Resistance Zone: ~$147–150 (immediate), with potential toward $160 if breakout continues
📅 Outlook
Bullish Case: If price holds above ~$147, it could target $150+ and possibly $160.
Bearish Case: Overbought readings may trigger a pullback toward $145 or even $140.
Overall Bias: Bullish trend intact, but short-term consolidation or mild correction is possible.
Bitcoinusd

COIN 1D Time frameMarket Snapshot
Current Price: ~$318.78
Daily Change: +5.5% (strong upward move)
🔎 Technical Indicators
RSI (14-day): ~71 → Overbought zone, signals caution.
MACD: Positive and rising → Strong bullish momentum.
Stochastic Oscillator: High → Overbought conditions, risk of short-term pullback.
ADX: ~16 → Weak trend strength despite recent move.
📈 Moving Averages
5-day MA: ~$315 → Bullish
50-day MA: ~$305 → Bullish
200-day MA: ~$314 → Bullish
All three show buy signals, confirming trend strength.
🔧 Support & Resistance
Support Levels: ~$315, ~$313, ~$311
Resistance Levels: ~$319, ~$321, ~$330
📅 Outlook
Bullish Case: If COIN sustains above ~$319, it could push toward $330 or higher.
Bearish Case: With RSI in overbought territory, a pullback toward ~$315–311 is possible.
Overall Bias: Moderately bullish, but vulnerable to short-term profit-taking.

PLTR 1D Time frameCurrent Price & Market Metrics
Current Price: $162.36 USD
Previous Close: $156.10 USD
Day Range: Not available
52-Week Range: Not available
Market Cap: Not available
P/E Ratio: Not available
EPS: Not available
🔎 Technical Indicators
Relative Strength Index (RSI): 41.18 — Neutral
Moving Averages:
5-day: $155.47 — Buy
10-day: $156.69 — Sell
20-day: $164.09 — Sell
50-day: $156.92 — Sell
100-day: $140.04 — Buy
200-day: $111.35 — Buy
Moving Average Convergence Divergence (MACD): -1.74 — Sell
Commodity Channel Index (CCI): -47.49 — Neutral
Price Rate of Change (ROC): -10.30 — Sell
Trend Strength Indicator (ADX): 24.55 — Neutral
📈 Support & Resistance Levels
Support: $152.80 – $154.27
Resistance: $164.77
📅 Outlook
Bullish Scenario: A breakout above $164.77 could signal a move toward higher levels.
Bearish Scenario: A drop below $152.80 may lead to further downside.
Overall Bias: Neutral, with mixed signals from momentum indicators and moving averages.

AAPL 1D Time frameCurrent Price & Market Metrics
Current Price: $234.35 USD
Market Cap: $3.01 Trillion
P/E Ratio: 30.28
EPS: $6.59
Beta: 1.15
Volatility: 2.32%
52-Week Range: $139.34 – $200.00 USD
🔎 Technical Indicators
Relative Strength Index (RSI): 67.00 — Neutral
Moving Averages:
5-day: $237.11 — Buy
10-day: $233.72 — Buy
20-day: $231.59 — Buy
50-day: $219.01 — Buy
100-day: $210.66 — Buy
200-day: $220.99 — Buy
Moving Average Convergence Divergence (MACD): 5.61 — Sell
Stochastic Oscillator: 89.58 — Sell
Commodity Channel Index (CCI): 136.25 — Sell
Average True Range (ATR): 4.41
📈 Support & Resistance Levels
Support: $220.11
Resistance: $239.78
📅 Outlook
Bullish Scenario: A breakout above $239.78 could signal a move toward $255.59.
Bearish Scenario: A drop below $220.11 may lead to further downside.
Overall Bias: Neutral to Bullish, with mixed signals from momentum indicators and moving averages.

NVDA 2HourTime frameNVDA 2-Hour Snapshot
Current Price: $170.76 USD
Previous Close: $168.31 USD
Day Range: $166.74 – $170.97 USD
52-Week Range: $139.34 – $200.00 USD
Volume: 170,370,750
VWAP: $169.67 USD
Market Cap: $1.1 Trillion
🔎 Technical Indicators
Relative Strength Index (RSI): 39.44 — Neutral
Moving Averages:
5-period: $169.68 — Sell
10-period: $174.59 — Sell
20-period: $177.06 — Sell
50-period: $172.58 — Sell
100-period: $150.61 — Buy
200-period: $139.34 — Buy
Moving Average Convergence Divergence (MACD): -0.91 — Buy
Stochastic Oscillator: 20.33 — Neutral
Commodity Channel Index (CCI): -119.52 — Buy
Average True Range (ATR): 4.93
📈 Market Sentiment
Pivot Points:
Resistance: $175.00 USD
Support: $165.00 USD
📅 Outlook
Bullish Scenario: A breakout above $175.00 USD could signal a move toward $185.00 USD.
Bearish Scenario: A drop below $165.00 USD may lead to further downside.
Overall Bias: Neutral, with mixed signals from moving averages and momentum indicators.

AMZN 2Hour Time frameAMZN 2-Hour Snapshot
Current Price: $238.24 USD
Change: +1.02% from the previous close
Intraday High: Not available
Intraday Low: Not available
🔎 Technical Indicators
Relative Strength Index (RSI): Neutral
Moving Averages:
5-period MA: Not available
10-period MA: Not available
20-period MA: Not available
50-period MA: Not available
📈 Market Sentiment
Pivot Points:
Resistance: Not available
Support: Not available
📅 Outlook
Bullish Scenario: A breakout above the current price could lead to further gains.
Bearish Scenario: A drop below the current price may test support levels.
Overall Bias: Neutral, with mixed signals from moving averages and momentum indicators.

BTCUSDT 2Hour Time frameBTC/USDT 2-Hour Snapshot
Current Price: $112,349.00
Change: -0.29% from the previous close
Intraday High: $112,891.00
Intraday Low: $110,812.00
🔎 Technical Indicators
Relative Strength Index (RSI): Neutral
Moving Averages:
7-period MA: $112,376 (short-term support)
25-period MA: $111,484 (medium-term support)
99-period MA: $113,049 (short-term resistance)
📈 Market Sentiment
Pivot Points:
Resistance: $113,650
Support: $108,666
📅 Outlook
Bullish Scenario: A breakout above $113,650 could signal a move toward $120,000.
Bearish Scenario: A drop below $108,666 may lead to further downside.
Overall Bias: Neutral, with mixed signals from moving averages and momentum indicators.

MSFT 45Minutes Time frameMSFT 45-Minute Snapshot
Metric Value
Current Price $498.41 USD
Change +0.05% from previous close
Market Cap $2.79 Trillion
P/E Ratio 28.88
EPS $12.93
🔎 Technical Indicators
RSI (14): 40.92 — Neutral
MACD: -2.70 — Bearish momentum
Moving Averages:
5-period SMA: $502.33 — Sell signal
10-period SMA: $504.10 — Sell signal
20-period SMA: $509.62 — Sell signal
50-period SMA: $509.09 — Sell signal
📈 Market Sentiment
Pivot Points:
R1: $507.19
R2: $519.38
R3: $526.79
S1: $487.59
S2: $480.18
S3: $467.99
📅 Outlook
Bullish Scenario: A breakout above $507.19 could lead to a push toward $519.38 and higher.
Bearish Scenario: A drop below $487.59 may test support around $480.18.
Overall Bias: Neutral to slightly bearish, with mixed signals from moving averages and momentum indicators.

AMZN 45Minutes Time frameAMZN 45-Minute Snapshot
Current Price: $238.24 USD
Change: +1.02% from the previous close
Intraday Range: $235.08 – $238.85 USD
52-Week Range: $161.38 – $242.52 USD
🔎 Technical Indicators
RSI (14): 67.1 — Neutral to slightly overbought
MACD: 1.88 — Bullish momentum
Moving Averages:
5-period SMA: $237.61 — Buy signal
10-period SMA: $236.92 — Buy signal
20-period SMA: $235.59 — Buy signal
50-period SMA: $231.42 — Buy signal
📈 Market Sentiment
Pivot Points:
R1: $238.90
R2: $239.43
R3: $240.13
S1: $236.97
S2: $237.67
S3: $238.20
📅 Outlook
Bullish Scenario: A breakout above $238.90 could lead to a push toward $239.43 and higher.
Bearish Scenario: A drop below $236.97 may test support around $235.59.
Overall Bias: Neutral to slightly bullish, with positive momentum but facing near-term resistance.

SENSEX 45Minutes Time frameSENSEX 45-Minute Snapshot
Current Price: 81,422.80 INR
Change: +0.33% from the previous close
Day's Range: 81,235.42 – 81,643.88 INR
52-Week Range: 71,425.01 – 85,978.25 INR
🔎 Technical Indicators
RSI (14): Neutral
MACD: Bullish momentum
Moving Averages:
5-period SMA: Buy signal
10-period SMA: Buy signal
20-period SMA: Buy signal
50-period SMA: Buy signal
📈 Market Sentiment
Golden Cross: The SENSEX recently formed a "golden cross," where the 50-day moving average crossed above the 200-day moving average, indicating a bullish trend.
Analyst Outlook: Analysts maintain a positive outlook on SENSEX, with a consensus rating of "Buy" and a 12-month price target suggesting potential upside.
📅 Outlook
Bullish Scenario: A breakout above 81,643.88 INR could lead to a push toward 82,000 INR and higher.
Bearish Scenario: A drop below 81,200 INR may test support around 80,800 INR.
Overall Bias: Moderately bullish, with positive momentum but facing near-term resistance.

NIFTY 45Minutes Time frameNifty 45-Minute Snapshot
Current Price: 24,976.70 INR
Change: +0.42% from the previous close
Recent High: 24,970.00 INR (August 28, 2025)
Recent Low: 23,500.00 INR (March 13, 2025)
🔎 Technical Indicators
RSI (14): Neutral
MACD: Bullish momentum
Moving Averages:
5-period SMA: Buy signal
10-period SMA: Buy signal
20-period SMA: Buy signal
50-period SMA: Buy signal
📈 Market Sentiment
Golden Cross: The Nifty 50 recently formed a "golden cross," where the 50-day moving average crossed above the 200-day moving average, indicating a bullish trend.
Analyst Outlook: Analysts maintain a positive outlook on Nifty 50, with a consensus rating of "Buy" and a 12-month price target suggesting potential upside.

COIN 3Hour Time frame📊 COIN 3-Hour Snapshot
Current Price: $318.78
Change: +5.49% from the previous close
Intraday Range: Not specified
Market Cap: Approximately $83.3 billion
P/E Ratio: Not specified
Beta: 2.89
🔎 Key Levels
Resistance:
R1: $318.78 (recent high)
R2: $330.00 (next resistance zone)
Support:
S1: $310.00 (immediate support)
S2: $300.00 (next support level)
📈 Technical Indicators
RSI (14): Not specified
MACD: Not specified
Moving Averages:
5-period SMA: Not specified
50-period SMA: Not specified
200-period SMA: Not specified
📌 Market Sentiment
Catalysts: Positive momentum following recent gains and analyst upgrades.
Sector Performance: Cryptocurrency market showing strength, with Coinbase leading gains among peers.
Options Activity: Significant trading in call options at $318.78 strike price, indicating bullish sentiment.
📅 Outlook
Bullish Scenario: A breakout above $318.78 could lead to a push toward $330.00 and higher.
Bearish Scenario: A drop below $310.00 may test support around $300.00.
Overall Bias: Moderately bullish, with positive momentum but facing near-term resistance.

BTCUSDT 1D Time frame 📊 BTC/USDT Daily Snapshot
Current Price: $112,493
Change: −0.37% from the previous close
Intraday Range: $110,812 – $113,029
Market Cap: Approximately $2.2 trillion
P/E Ratio: Not applicable (Bitcoin is not a stock)
Beta: Not applicable (Bitcoin is not a stock)
🔎 Key Levels
Resistance:
R1: $113,000 (recent high)
R2: $116,000 (next resistance zone)
Support:
S1: $110,800 (immediate support)
S2: $107,000 (next support level)
S3: $102,000 (longer-term support)
📈 Technical Indicators
RSI (14): 43 — Neutral, indicating balanced buying and selling pressure
MACD: Bullish crossover observed, suggesting upward momentum
Moving Averages:
5-day SMA: $111,500 — Buy signal
50-day SMA: $112,830 — Resistance level
200-day SMA: $101,000 — Long-term support
Stochastic Oscillator: Oversold, indicating potential for a bounce
📌 Market Sentiment
Catalysts: Positive momentum following recent gains and analyst upgrades.
Sector Performance: Cryptocurrency market showing strength, with Bitcoin leading gains among peers.
Options Activity: Significant trading in call options at $113,000 strike price, indicating bullish sentiment.
📅 Outlook
Bullish Scenario: A breakout above $113,000 could lead to a push toward $116,000 and higher.
Bearish Scenario: A drop below $110,800 may test support around $107,000.
Overall Bias: Moderately bullish, with positive momentum but facing near-term resistance.

RELIANCE 1D Time frame Reliance Industries (RELIANCE)
Current Price: ₹1,380.10
Change: +0.28% from the previous close
Intraday Range: ₹1,375.50 – ₹1,381.20
Volume: 9,753,126 shares traded
Market Cap: ₹18.67 trillion
P/E Ratio: 25.10
EPS (TTM): ₹60.23
Dividend Yield: 0.40%
Beta: 0.88 (indicating lower volatility relative to the market)
🔎 Key Levels
Resistance:
R1: ₹1,385.00 (recent high)
R2: ₹1,400.00 (psychological level)
R3: ₹1,420.00 (next resistance zone)
Support:
S1: ₹1,375.50 (immediate support)
S2: ₹1,360.00 (next support level)
S3: ₹1,350.00 (longer-term support)
📈 Technical Indicators
RSI (14): 58.21 — Neutral to slightly bullish
MACD: 2.15 — Positive momentum
Moving Averages:
5-day SMA: ₹1,373.00 — Buy signal
50-day SMA: ₹1,350.00 — Buy signal
200-day SMA: ₹1,300.00 — Buy signal
Stochastic Oscillator: 75.00 — Overbought, indicating potential for a pullback
📌 Market Sentiment
Catalysts: Positive momentum following recent gains and analyst upgrades.
Sector Performance: Oil & Gas sector showing strength, with Reliance leading gains among peers.
Options Activity: Significant trading in call options at ₹1,400 strike price, indicating bullish sentiment.
📅 Outlook
Bullish Scenario: A breakout above ₹1,385.00 could lead to a push toward ₹1,400.00 and higher.
Bearish Scenario: A drop below ₹1,375.50 may test support around ₹1,360.00.
Overall Bias: Moderately bullish, with positive momentum but facing near-term resistance.

PLTR 1D Time frame📊 Palantir (PLTR) Daily Snapshot
Current Price: $162.36
Change: +4.01% from the previous close
Intraday Range: $156.37 – $162.75
Volume: 59,300,483 shares traded
🔎 Key Levels
Resistance:
R1: $162.75 (recent high)
R2: $165.00 (psychological level)
R3: $170.00 (next resistance zone)
Support:
S1: $156.37 (recent low)
S2: $150.00 (psychological support)
S3: $145.00 (next support zone)
📈 Technical Indicators
RSI (14): 67.41 — Neutral to slightly bullish
MACD: 1.51 — Positive momentum
Moving Averages:
5-day SMA: $157.25 — Buy signal
50-day SMA: $145.00 — Buy signal
200-day SMA: $130.00 — Buy signal
Stochastic Oscillator: 77.32 — Overbought
ADX (14): 44.32 — Strong trend strength
📌 Market Sentiment
Catalysts: Positive momentum following recent gains and analyst upgrades.
Sector Performance: AI and data analytics sectors showing strength, with Palantir leading gains among peers.
📅 Outlook
Bullish Scenario: A breakout above $162.75 could lead to a push toward $170.00.
Bearish Scenario: A drop below $156.37 may test support around $150.00.
Overall Bias: Moderately bullish, with positive momentum but facing near-term resistance.

AMZN 1D Time frame📊 Amazon (AMZN) Daily Snapshot
Current Price: $238.24
Change: +1.02% from the previous close
Intraday Range: $235.08 – $238.85
Volume: 27,033,778 shares traded
🔎 Key Levels
Resistance:
R1: $238.85 – $239.50 (short-term resistance zone)
R2: $242.52 (52-week high)
Support:
S1: $235.08 – $235.84 (short-term support zone)
S2: $230.00 (psychological support)
📈 Technical Indicators
RSI (14): 60.03 — Neutral to slightly bullish
MACD: 2.30 — Positive momentum
Moving Averages:
5-day SMA: $233.62 — Buy signal
50-day SMA: $226.19 — Buy signal
200-day SMA: $213.56 — Buy signal
📌 Market Sentiment
Catalysts: Positive market sentiment, with AMZN outperforming key competitors in recent sessions.
Sector Performance: Tech sector showing strength, with AMZN leading gains among peers.
📅 Outlook
Bullish Scenario: A breakout above $238.85 could lead to a push toward $242.52 (52-week high).
Bearish Scenario: A drop below $235.08 may test support around $230.00.
Overall Bias: Moderately bullish, with positive momentum but facing near-term resistance.

TSLA 1D Time frame Tesla (TSLA) Daily Snapshot
Current Price: $346.97
Change: +0.61% from the previous close
Intraday Range: Not specified
Trend: Bullish continuation
🔎 Key Levels
Resistance:
R1: $347.17 – $350.85 (short-term resistance zone)
R2: $360.56 – $362.90 (medium-term resistance zone)
Support:
S1: $324.94 – $330.14 (short-term support zone)
S2: $313.64 (trendline support)
S3: $302.62 (horizontal support)
📈 Technical Indicators
RSI (14): 57.10 — Neutral
MACD: 5.23 — Sell signal
Moving Averages:
5-day EMA: $339.84 — Buy
50-day SMA: $324.49 — Buy
200-day SMA: $330.33 — Buy
📌 Market Sentiment
Catalysts: Positive market sentiment, with TSLA outperforming key competitors in recent sessions.
Sector Performance: Tech sector showing strength, with TSLA leading gains among peers.
📅 Outlook
Bullish Scenario: A breakout above $347.17 could lead to a push toward $360.56–$362.90.
Bearish Scenario: A drop below $324.94–$330.14 may test support around $313.64.
Overall Bias: Moderately bullish, with positive momentum but facing near-term resistance.

WIPRO 1D Time frame📊 Wipro Daily Snapshot
Current Price: ₹256.50
Change: Up 2.97% from the previous close
Volume: 804,499 shares traded, significantly higher than the 50-day average of 369,496
MarketWatch
🔎 Key Levels
Resistance: ₹253.70 (short-term)
Support: ₹239.55 (short-term)
52-Week High: ₹324.55 (January 23, 2025)
52-Week Low: ₹239.55 (recent support level)
📈 Technical Indicators
RSI (14): Approximately 75 — indicates overbought conditions
MACD: Positive — suggests upward momentum
Moving Averages: Trading above 5-day (₹255.97), 50-day (₹248.47), and 200-day (₹247.12) SMAs — bullish trend
Stochastic Oscillator: Indicates overbought conditions
ADX: Approximately 17.49 — suggests a weak trend strength
Top Stock Research
📌 Market Sentiment
Catalysts: Positive market sentiment, with Wipro outperforming key competitors like HCL Technologies and Tata Consultancy Services in recent sessions
MarketWatch
Sector Performance: IT sector showing strength, with Wipro leading gains among peers
📅 Outlook
Bullish Scenario: Sustained trading above ₹253.70 could lead to a push toward ₹277.65 (long-term resistance)
Bearish Scenario: A drop below ₹239.55 may test support around ₹234.20 (mid-term support)

NIFTY 1D Time frame📊 NIFTY 50 Snapshot
Current Price: Approximately 24,991
Change: Up ~0.49% from the previous close
Trend: Fifth consecutive day of gains
🔎 Key Levels
Resistance: Near 25,000 — psychological level and recent high
Support: Around 24,800 — recent low and consolidation zone
📈 Technical Indicators
RSI (14): Approximately 58 — neutral to slightly bullish
MACD: Positive — indicating upward momentum
Moving Averages: Price trading above key moving averages, suggesting a bullish trend
📌 Market Sentiment
Catalysts: Optimism over potential GST cuts and revival of trade talks with the U.S.
Sector Performance: Broad-based gains across sectors, with IT and financials leading
📅 Outlook
Bullish Scenario: Sustained trading above 25,000 could lead to a push toward 25,200–25,300.
Bearish Scenario: A drop below 24,800 may test support around 24,600.

EURUSD 4Hour Time frame📊 EUR/USD Snapshot
Current Price: ~1.1706
Recent Range: ~1.1685 – 1.1739
Intraday Change: Slightly negative (~-0.03%)
🔎 Key Levels (4H Focus)
Pivot Point: ~1.1702
Resistance:
R1: ~1.1712
R2: ~1.1729
R3: ~1.1739
Support:
S1: ~1.1685
S2: ~1.1675
S3: ~1.1658
📉 Technical Indicators
RSI: Neutral (~50) → no overbought/oversold condition.
MACD: Slightly positive → mild bullish momentum.
Moving Averages: Price is holding above the 20-period SMA (~1.1710), which acts as short-term support.
📌 4-Hour Outlook
Bullish Scenario: If EUR/USD stays above 1.1700–1.1710, it may push toward 1.1780 and higher levels like 1.1825–1.1850.
Bearish Scenario: If it drops below 1.1700, short-term weakness could test 1.1685 → 1.1675.
Bias: Moderately bullish, but momentum depends on breaking above 1.1780.
✅ Conclusion: On the 4-hour chart, EUR/USD is holding a cautious bullish tone, supported by short-term moving averages. The key battleground is around 1.1700 support and 1.1780 resistance — whichever side breaks first will guide the next move.

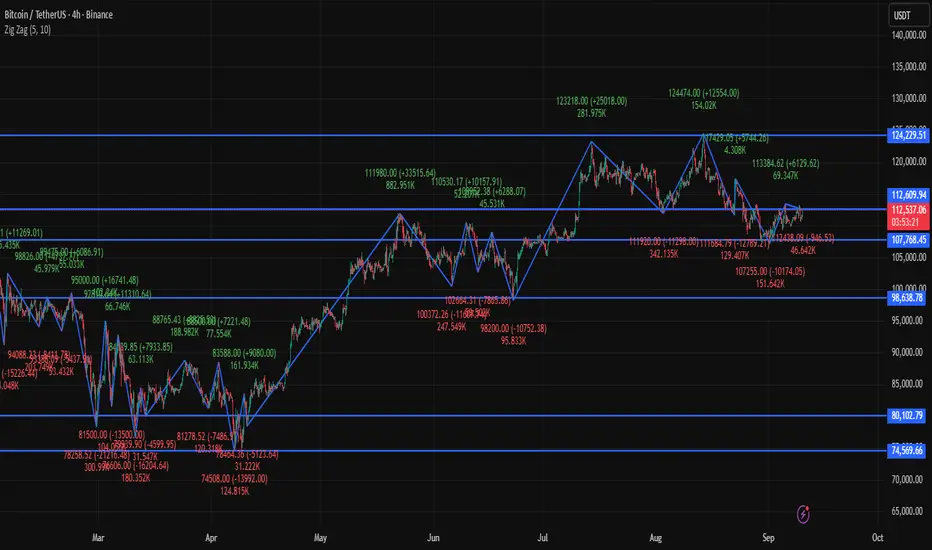
BTCUSDT 4Hour Time frame📊 BTC/USDT Snapshot
Current Price: ~$112,419
Range (Intraday): $110,812 – $113,138
Change: Around –0.5% from the last close
🔎 Key Levels (4-Hour Focus)
Support Zone: ~$106,000 (recent double-bottom area)
Current Pivot: ~$112,000 (key resistance and decision zone)
Next Resistance: ~$117,000 (if breakout holds)
📉 Technical Indicators (4-Hour Context)
RSI: In the mid-50s → showing moderate strength after bounce
MACD: Slightly positive → early bullish signal
Momentum: Neutral to bullish; recovery attempt underway
📌 4-Hour Outlook
Bullish Case: If BTC closes firmly above $112,000, it could push toward $117,000.
Bearish Case: If rejection happens at $112,000, price may slip back toward $110,000 → $106,000 support.
Bias: Consolidation with bullish potential, but resistance needs to be cleared.
✅ Conclusion: On the 4-hour chart, BTC/USDT is in a neutral-to-bullish phase, holding above its recent bottom. $112K is the key battleground — breakout could fuel upside momentum, while rejection risks another retest lower.
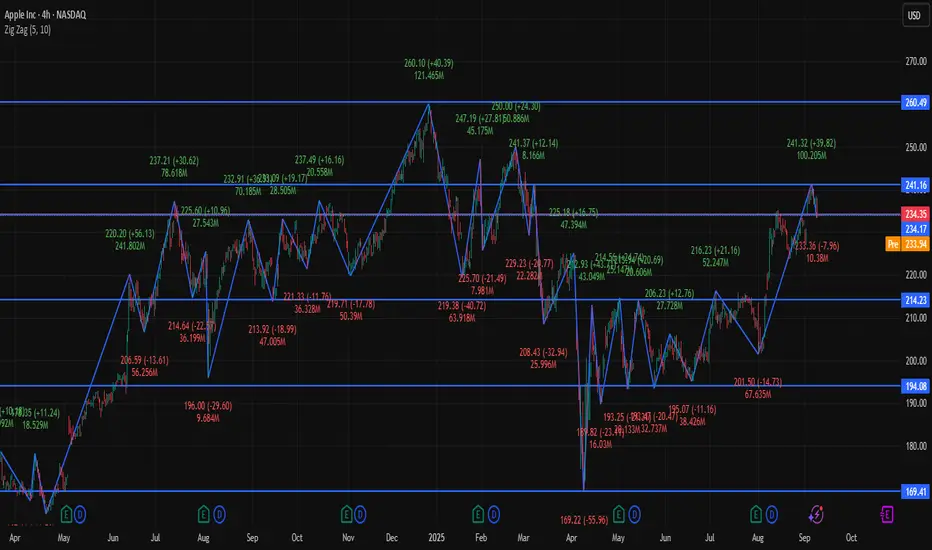
AAPL 4Hour Time frame📊 Apple (AAPL) Snapshot
Current Price: ~$234.35
Day Range: $233.01 – $238.66
Open Price: ~$236.73
Market Cap: ~$3.0 Trillion
P/E Ratio: ~30.3
EPS: ~6.59
🔎 Pivot Levels (Daily Basis → useful for 4H)
Pivot Point: ~$234.6
Resistance:
R1: ~$235.9
R2: ~$238.0
R3: ~$239.2
Support:
S1: ~$232.5
S2: ~$231.3
S3: ~$229.1
📉 Technical Indicators (4-Hour Insight)
RSI: ~40 → weak, leaning bearish.
MACD: Negative → bearish momentum.
Moving Averages: Short-term averages show Sell, long-term still supportive (Buy).
📌 4-Hour Frame Outlook
Momentum: Neutral-to-bearish; price is consolidating around the pivot zone ($234–235).
Bullish Scenario: If AAPL breaks above $238, short-term upside could open toward $239+.
Bearish Scenario: If price slips below $232, risk increases for a move toward $230.
✅ Conclusion: On the 4-hour chart, Apple is in a neutral to bearish phase, with weak momentum. Bulls need a breakout above $238 to take control, while bears may dominate if it breaks under $232.
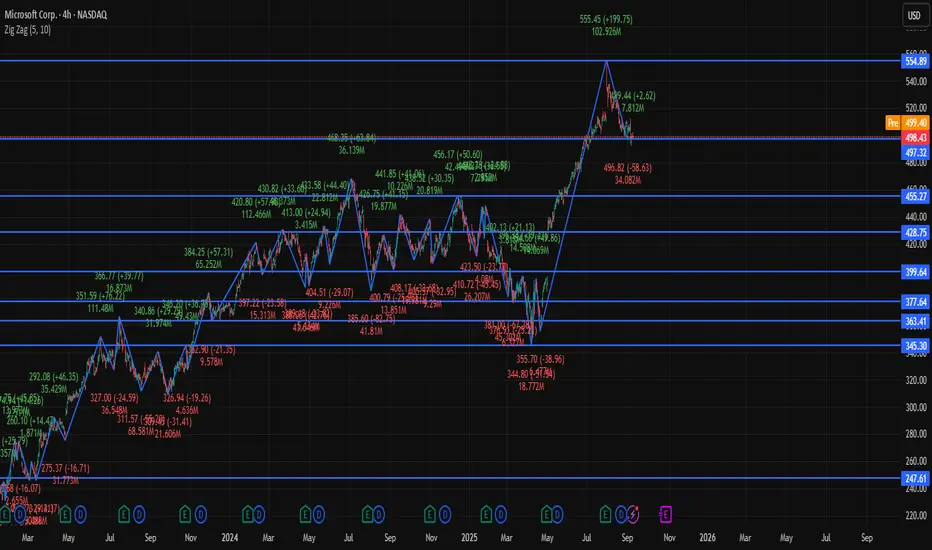
MSFT 4Hour Time frameMSFT Snapshot (as of latest session)
Current Price: Around $498.40
Day Range: $497.0 – $502.2
Open: ~$501.4
Market Cap: ~$2.79 Trillion
P/E Ratio: ~28.9
EPS: ~12.93
Pivot Levels (Daily basis, useful for 4-Hour analysis)
Pivot Point: ~$498.9
Resistance Levels:
R1: ~$499.5
R2: ~$500.0
R3: ~$500.6
Support Levels:
S1: ~$498.4
S2: ~$497.8
S3: ~$497.3
Technical View (4-Hour Frame)
Momentum: Price is consolidating near the pivot (~$498–499).
Indicators:
RSI around 45 → neutral to slightly bearish.
MACD negative → bearish bias.
Moving Averages (short and long) → leaning bearish.
Bias:
A breakout above $500 may open short-term upside toward ~$500.6 or higher.
If MSFT falls below $498, pullback risk increases toward $497.8 → $497.3.
✅ Conclusion: On the 4-hour timeframe, MSFT is in a neutral-to-bearish phase, stuck around its pivot. Buyers need a clear move above $500 to regain strength; otherwise, it risks drifting lower toward support.