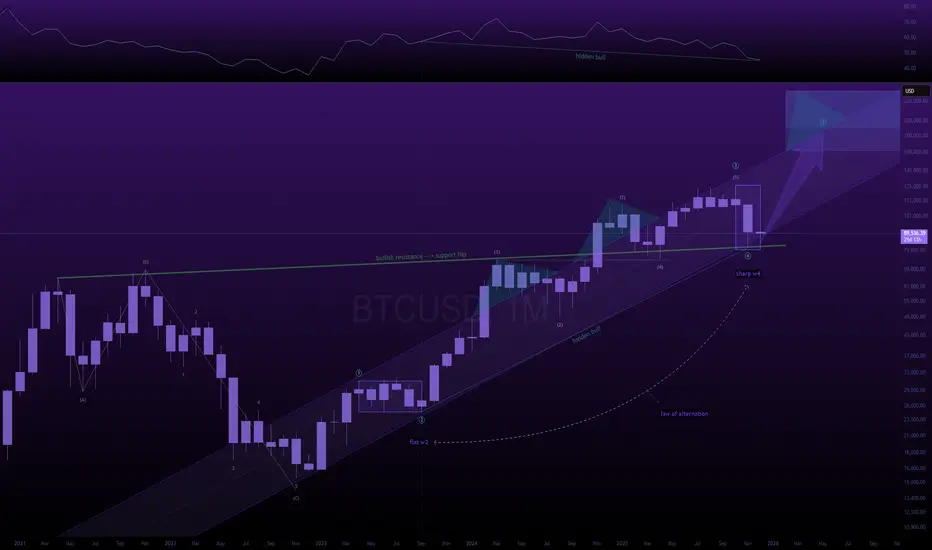
bitcoin explodes to 750kgood evening,
before i share my idea -
i'd like to share a disclaimer:
what i'm about to say will undoubtedly trigger you.
---
the way metals are rallying all of a sudden,
re-sparks my original bull case from many years ago.
the bull case essentially is pretty simple.
the macro bull trend is not finished yet,
and btc is in the final 5th wave of the 5 wave impulse.
the estimated upside target sits at 753k,
but it could in theory go significantly higher.
---
the last time gold and silver had comparably strong rallies was in 2020.
shortly after, btc explosively ran like 10x, followed by one of the most insane altseasons ever.
it might feel hard to imagine right now,
but i wouldn’t be surprised if something similar plays out next year.
funny how all the signs are there,
yet most people are still in complete disbelief.
---
note: there is also a chance that wave 5 is in.
so if we fail to spark this rally which i portray,
it would imply that the grand cycle top could be in.
it is important to entertain both scenarios,
but it's equally important to keep a very open mind during these times.
---
the cycle has thus far has felt very far from regular, so we must treat it differently than we would previous cycles. the main reason for these changes is because of who the new market participants are (institutions) - they're not playing on a 4 year timeline, they're playing in decades.
---
🎯 = 753k
BLX

here's how bitcoin reaches 185k part 2.good morning,
in my last btc post i promised you my macro btc analysis if the post reached 5 likes,
so here you are.
---
the count is extremely simple;
from the 2022 bear market lows, btc has come up quite impulsively.
i label the entire leg from september 2023 -> october 2025 as a wave (3).
if you look closely, none of the waves overlap in this leg.
sure it might have an unconventional look, but it's not invalid by any technical standards.
---
if i'm correct with my analysis, wave (5) should see an equal appreciation as the length of wave (1) - could become slightly longer, too. usually in cases such as this, you can measure the distance of wave (1) and project it out from the bottom of wave (4);
> look for 100.00% - 123.60% - 161.80% extensions.
this puts the average upside target between 161k - 248k
---
we have had a sustained reading of extreme fear almost all month.
btc is at the bottom of the bullish pitchfork.
most people have given up hope. (bullish contrarian signal)
business cycle has yet to top.
fed man stopped quantitative tightening and has hinted at a balance sheet expansion.
aggressive rate cuts.
monthly hidden bullish divergence present between wave (2) and wave (4) pivot lows.
we are flipping previous cycle highs into support (horizontal support).
bitcoin capitulation metric has hit an all time high this cycle (each one has marked a major low).
---
all of this leads me to believe that we are not finished with the current bull trend.
---
🎯 = 185k
Is everyone too bearish on BTC? Up to $108k before down?Everyone is extremely bearish on BTC here calling for new lows, but the chart and indicators don't look like they support a move straight down.
Even though we're technically consolidating in a bear flag, I don't think we actually break to the downside (yet).
To me, it looks like we should see a large bounce first up to the $103k-108k range, then I think a larger downside move can play out down to the lower support levels.
The reason why I don't think we see a move straight down is because we're so oversold on high timeframes (weekly) and we're still above key support levels. It makes more sense to me to see a fake out move up that makes everyone bullish again before we see the large move down.
As long as we remain above that $86.1k support level, then I think this is a strong possibility of an outcome.
Let's see if we can hold that level and how it plays out.

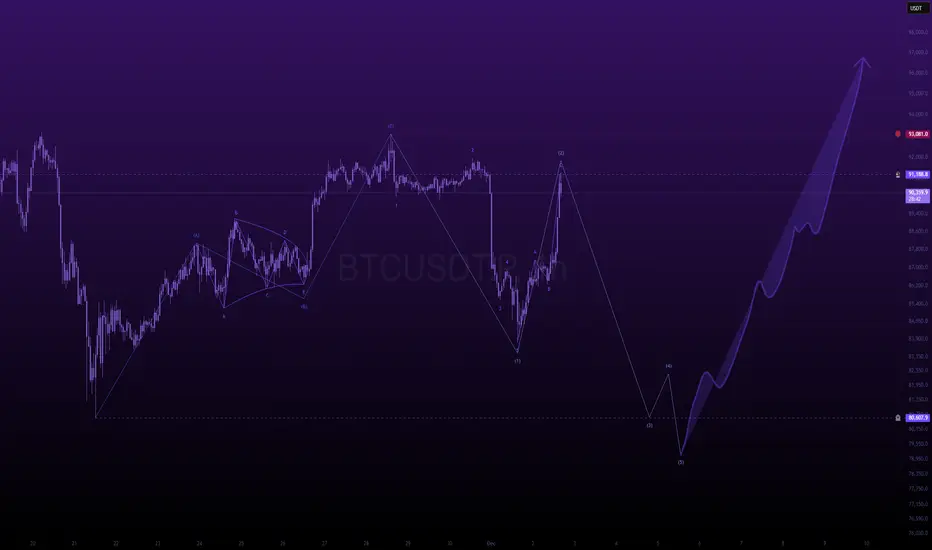
max pain in sight for the bullsgm,
i've been entertaining a few ideas on btc, and this one comes to mind today.
the possibility of 1 more leg down, to take the rest of the longs that fomoed into the rally this week, and the few who managed to survive the drop from ath by averaging down mindlessly.
---
the way we bounced is very reminiscent of a wave 4.
btc is teethering on the edge of a negative funding rate (our favorite contrarian indicator)
by creating one more low, we will for certain print a massive, multi-week negative funding reading, and that's when a proper buy could take place.
---
i have personally decided to fade the rally, and have de-risked quite substantially from the positions i managed to pick up near the lows.
---
in my opinion, the path of maximum pain is a sweep of that notorious 75k level that everyone keeps talking about.
---
---
🎯 - 75k

did bitcoin make an inorganic low?good afternoon,
an inorganic low is reffered to as a "truncated 5th" in elliott wave theory. one of the original people who mentioned the term was ralph nelson elliott, when he wrote "the wave principle"
an inoragnic low, by definition is a 5th wave which fails to sweep the wave 3 area. in an uptrend, this can happen due to loss of momentum, but in a downtrend, this could happen due to a major sign of strength.
through out my years in this market, i have personally observed and studied the psychology behind the truncated 5th and how the crowd mentality behaves around it.
often times, there's a sharp reversal and people expect the low to get swept, orders at the lows; but price never returns down there, and their orders don't get filled - which leads to panic buying on the way up, creating extensions in the waves which follow.
---
truncated 5ths in a downtrend are very bullish.
---
i postulate btc sweeps the all time highs, without sweeping the recent 80k low.
---
🎯 = 151k

you're not bullish enough, but neither am i.next 48 hours are key.
i believe btc raids 80k with force to stop out everyone who fomo'd into the move over the last 2 weeks in this current range.
typical wyckoff accumulation behavior.
create a range, make it look like we're going to breakout, and then sweep the lows, taking everyones position before the real breakout.
---
fakeout
then
breakout.
---
some elliott wave terminologies,
from nov 21st low btc came up in a bearish 3 wave move peaking last friday.
from there it came down in a clean impulsive wave to the downside.
yesterday we were skeptical about it and entertained multiple scenarios,
but after some further thought, i conclude my statement by saying
it does indeed look impulsive, and there is a 95% chance we sweep 80k before attempting to bombrush 185k.
---
🎯 = 80k into end of week.
btc taps 185kgm,
i'm projecting an upside target of 185k for btc. this upside target should in theory be the top of our current bull cycle, the final fifth wave of the impulse which begun back in 2022.
for us to reach 185k, we must remain above last weeks low.
we also have to sweep the all time highs, to invalidate any bear scenarios which are around.
---
sentiment is quite bleak,
many people have given up
many people think we are in a bear market.
my personal upside target sits at 185k, and i'm very bullish on crypto until then.
----
ps. if this post gets 5 likes, i will share my detailed macro bull case for btc.

185kthis is the last post i will ever make on this account. after today, i will be discontinuing the usage of this account in perpetuity. it will remain a relic of sorts.
---
gm,
many of you remember me as eloquent trades, or elo. i come today with one final post for you before i disappear onto the dark side of the moon.
---
i predict the bitcoin rally is not yet finished,
i believe we have one final leg up to go
my upside target sits at $185k this cycle.
---
once 185k has been attained, i predict a crash like we've never seen before, one that defies logic, one that takes everything away, from anyone associated with this market.
---
ps. this is not financial advice, this is merely a theory-craft, the final one on this account.
farewell
🌙

BTCUSD 1W Chart – The Cyclical Geometry of Bitcoin MarketsA close examination of Bitcoin’s long-term structure reveals a striking symmetry between its bull and bear phases. The last two bear markets each lasted 364 days, while the two subsequent bull runs expanded for 1,064 days — a rhythm so precise it reflects the mechanical heartbeat of Bitcoin’s market cycles.
Following the 2020 halving, Bitcoin rallied +2,105% over 1,064 days, peaking at $69,000 in 2021. The previous cycle delivered an even greater +18,044% rally, followed by an -84% correction that defined the next macro bottom.
The current cycle, post Halving 2024, continues to mirror this same time symmetry with remarkable accuracy. If history holds, the projected top should arrive roughly 1,064 days after the Halving — around late 2026 — with a potential target zone between $143K and $146K, adjusted for performance decay over time.
However, if the market breaks this cyclical rhythm, it would mark the first major deviation in Bitcoin’s historical pattern. Such a break would not just disrupt the four-year cycle theory — it could signal the birth of a Supercycle, a multi-year parabolic expansion phase driven by institutional adoption, sovereign participation, and macro liquidity shifts.
Until then, all evidence still supports an ongoing reaccumulation phase within the broader bull structure.
Bitcoin’s 364-day downtrend → 1,064-day expansion remains one of the cleanest repeating geometries in financial history a rhythm that could either repeat once more or evolve into something far greater.
-CryptoPASOK

BITCOIN - The Corrective Pattern Since 2013 Explained...In this video, I break down Bitcoin’s corrective pattern since 2013 using the AriasWave methodology—rather than Elliott Wave or Bollinger Bands. This marks a significant moment for AriasWave followers, as I apply the method in a more advanced way to decode not only Bitcoin’s structure, but also global markets and, most importantly, Altcoins.
I highlight Altcoins in particular because they appear to hold the greatest potential for explosive growth, largely due to their lagging correlation with Bitcoin. This video is the first in a new analysis series, where I’ll soon take a closer look at Bitcoin’s short-term price action. For now, I wanted to start with this broader perspective, which projects Bitcoin reaching a target range between $276K and $311K.
The target for Ethereum is $69K.
I will explain the target for Thor Chain in an upcoming RUNEUSDT video.

XLM Breakout Watch | How Global Markets Are Setting the StageIn this update, I break down XLM’s mid-term outlook and why the $0.65 level is a key breakout zone to confirm further upside. Based on current patterns, I’m targeting a potential move into the $100–$138 range over the mid-term.
While Bitcoin still influences XLM, the backdrop of massive money printing since 2018 has created conditions for meaningful accumulation, setting the stage for higher prices. Add to that an environment of rising interest rates, Fed interventions, and volatility cycles, and it’s clear we’re only at the beginning of what could be a period of outsized returns.
Stellar’s role in a shifting economic system also can’t be ignored. As fiat currencies face structural limits, crypto offers a framework that breaks those shackles, with altcoins like XLM poised to outperform Bitcoin in the next cycle.
Markets will continue to follow their familiar pump-and-dump patterns, but each cycle brings diminishing returns for central bank interventions—leaving room for crypto markets to step in and restore balance.
Stay tuned for the charts and insights that put these patterns into perspective.

[4h] BTC forming bullish flag at ATHBitcoin will likely form bullish structure here at ATH as we near a breakout. A bull flag or a falling wedge will create significant momentum and push BTC towards 125k+ on initial wave. Cycle top remains ~150k.

a possible massacre.what if i told you that bitcoin could drop 50% before june is over?
i know that probably sounds extreme. maybe even a little unbelievable. and that's okay; most people react that way when faced with a scenario they weren't prepared for.
i’m not here to scare you, and i’m not trying to make a bold claim just to get attention. i’m here to share a message that comes from a rare, proprietary sell signal in our system; something that doesn’t trigger often, but when it does, we pay very close attention.
i believe there’s a real possibility bitcoin drops below 50k by the end of june.
---
here’s the technical stuff to anyone interested:
since the bottom in november 2022, bitcoin moved up in a clear five-wave pattern, peaking around january 2025. from there, it seems to be forming what’s known as an expanded flat correction. this is a three-wave structure (3-3-5) that often tricks the crowd before the next major move begins.
ironically, this potential drop doesn't change the bigger picture at all. i still believe the long-term target sits between 750k and 1m by year-end. but markets don’t move in straight lines; sometimes, they shake out everyone who’s too confident, right before taking off.
consider this a heads-up,
not a certainty,
but one worth preparing for.
---
ps. the stop-loss on my btc long sits at the target of this idea. if i'm right about this, my stop will get hit, and it will open the door to a new entry.
---
🌙

$BTC back to $59-62kAs you can see from the chart, BTC is rejecting from the range highs which sets up the next (and final) leg lower before we continue the bull run.
Despite the bounce over the last few weeks, all we've done is retested the area which we broke down from back in February.
Now this sets up a large move lower down to the lower support levels at GETTEX:59K -$62k.
After we tag those levels, we'll continue our next move higher into 2026-2027.

The Perfect Bounce- Quick update
- IYKYK.
- Everything is in graph, no need a long speech.
Happy Tr4Ding !

Bitcoin are you Worried ?Everything is in chart.
- Like i said many times, more you look from far, more it's easy to predict the future.
- This Monthly Chart combinated with indicators show you how BTC moved in 2016-2017 BullRun so keep eyes open and you will find the way for 2020-2021.
- We cannot compare a Bullrun from 400$ to 20,000$ with a Bullrun From 4000$ to 3XX,XXX+$, the chart will be exponential. We are now playing with big numbers.
- imo right now we are in fake bear market stage, this stage happened also in 2016-2017 pre-bullrun ( but Numbers were smallers...), whales are just trying to create fear and remove retails investors.
- Actual stage could be a Consolidation Phase, if Whales see there's a lack of interest, they will push BTC up, or we could get a quick fast Trap to 20,000$ if Whales feel Retails not fear enough (Not sell their BTC).
- 100 000$ Target is still very preservative, past this stage it will be the FOMO Stage to go Higher!
TheKing is dead??? Long live TheKing!! :D
Happy Tr4Ding !

Market Update - This Stock Market Analysis Aligns With Bitcoin..What if I told you that the stock market’s pattern could actually reveal what’s coming next for Bitcoin—would you stick around and watch the entire video? That’s exactly what I’m diving into here. I didn’t force this analysis to fit; somehow, over the past week, it just lined up this way.
In this video, I break down exactly why the next market move could be more severe than anything we’ve seen in our lifetime—yet it’s not the end of the world. In fact, if approached correctly, this could be the opportunity of a lifetime. The rebound that follows could be massive.
I’ve always had a gut feeling about this, but now the patterns are speaking loud and clear. This is the reason I created AriasWave—and this is exactly where we are right now.
This also aligns with my latest Euro analysis linked below in related ideas.

bitcoin enters a hyper-parabolic state to 753kgm,
this was initially a private post,
but i've decided to open it up to the public, for the people.
---
interest rates are collapsing. not slowly. not in a controlled, measured descent. this is a freefall. the kind that rewrites economic history.
monetary debasement is inevitable. quantitative easing will accelerate, liquidity will flood the system, and the us dollar will plunge. this isn’t speculation. this is math.
and when that happens, the gates open. the largest alt season in history is not a possibility. it is an inevitability. this will be the kind of move that people will talk about for decades. portfolios multiplied beyond reason. valuations pushed to levels most can only dream of.
the everything bubble will expand beyond comprehension. people will call it unsustainable. they will call it madness. but madness is where the greatest opportunities are born.
most won’t be ready. they will hesitate. they will overthink. they will sell too early,
watching in disbelief as the market leaves them behind.
we will not.
🌙
---
tp - 753k

BITCOIN - Short Trade Entry - Minor Wave ii Looks Complete...The video idea for this chart is linked below. The current thesis is that minor wave ii has recently completed, confirmed by a retest and rejection of the previous key level at 81,222. Additionally, a brief touch of the 0.618 retracement level supports this view, along with the overall wave structure, suggesting that wave ii is complete and we are now in the early stages of wave iii to the downside.
This third wave may start off slowly due to initial market uncertainty, but as sentiment clears, price action typically aligns with the dominant trend—which, in this case, is down.
While it may be a bit premature to lower the stop until we break below 75,786 (the start of Wave E), that level is quite far, and it may be more prudent to keep the stop at recent highs for now. Ultimately, your stop placement should reflect your comfort level with the wave count and risk tolerance.
If the analysis holds, the rejection at 81,222 becomes a logical stop-loss level for a fresh short position. The target remains unchanged at 61,000.

BITCOIN - Short Trade Idea Update - Wave ii Looks Complete...In this video, I break down what I woke up to this morning regarding the wave structure.
With wave ii appearing to be complete, I’m looking to add to my short position and adjust my stop level down to 81,223—creating another potential entry point for the short trade.
Recognizing and understanding these developing patterns is essential if you want to stay in the game.

BITCOIN - Short Trade Idea - Targeting $61K Area...This idea is explained in the video linked below.
The price action speaks for itself, and it’s hard to ignore what looks like the end of the recent correction. A break below $81,222 would confirm this view.
Short Entry: $81,222
Stop Level: $84,715
Target: $61,000

BITCOIN - Price Could Be Heading Towards 60K...After multiple rejections at higher price levels, the most recent major rejection—followed by a break of the lows—suggests that the corrective move we've seen since the end of February may have concluded.
In this video, I outline the key reasons why a larger upside move no longer appears likely.
With the potential end of the corrective wave combinations now in sight, I'm shifting to a bearish outlook, targeting a potential move down to $61K. To validate this view, we need to see a break below $81,222, confirming the start of a deeper breakdown.
As it stands, I can no longer support a short-term bullish scenario unless we see a strong break above $84,715. However, given the recent sharp move to the downside, this seems unlikely and may, in fact, mark the beginning of a larger downward trend.

BITCOIN - Long Trade Price Action Update...In this video, I break down the latest price action while incorporating some AriasWave analysis along the way.
There's nothing unusual happening—just psychological reactions testing your patience.
Welcome to the world of trading lol, where you can be riding high one moment and facing losses the next, shifting between excitement and frustration.
Today, I dive into the psychology of trading—what drives a trader’s mindset, the balance between logic and mental discipline, and how mastering both can help grow your bank account. Everything begins in the mind, whether it’s knowledge or habit.
I remain bullish, and while the external picture hasn’t changed much, what about your internal one?
